Technically Speaking – July 6, 2022

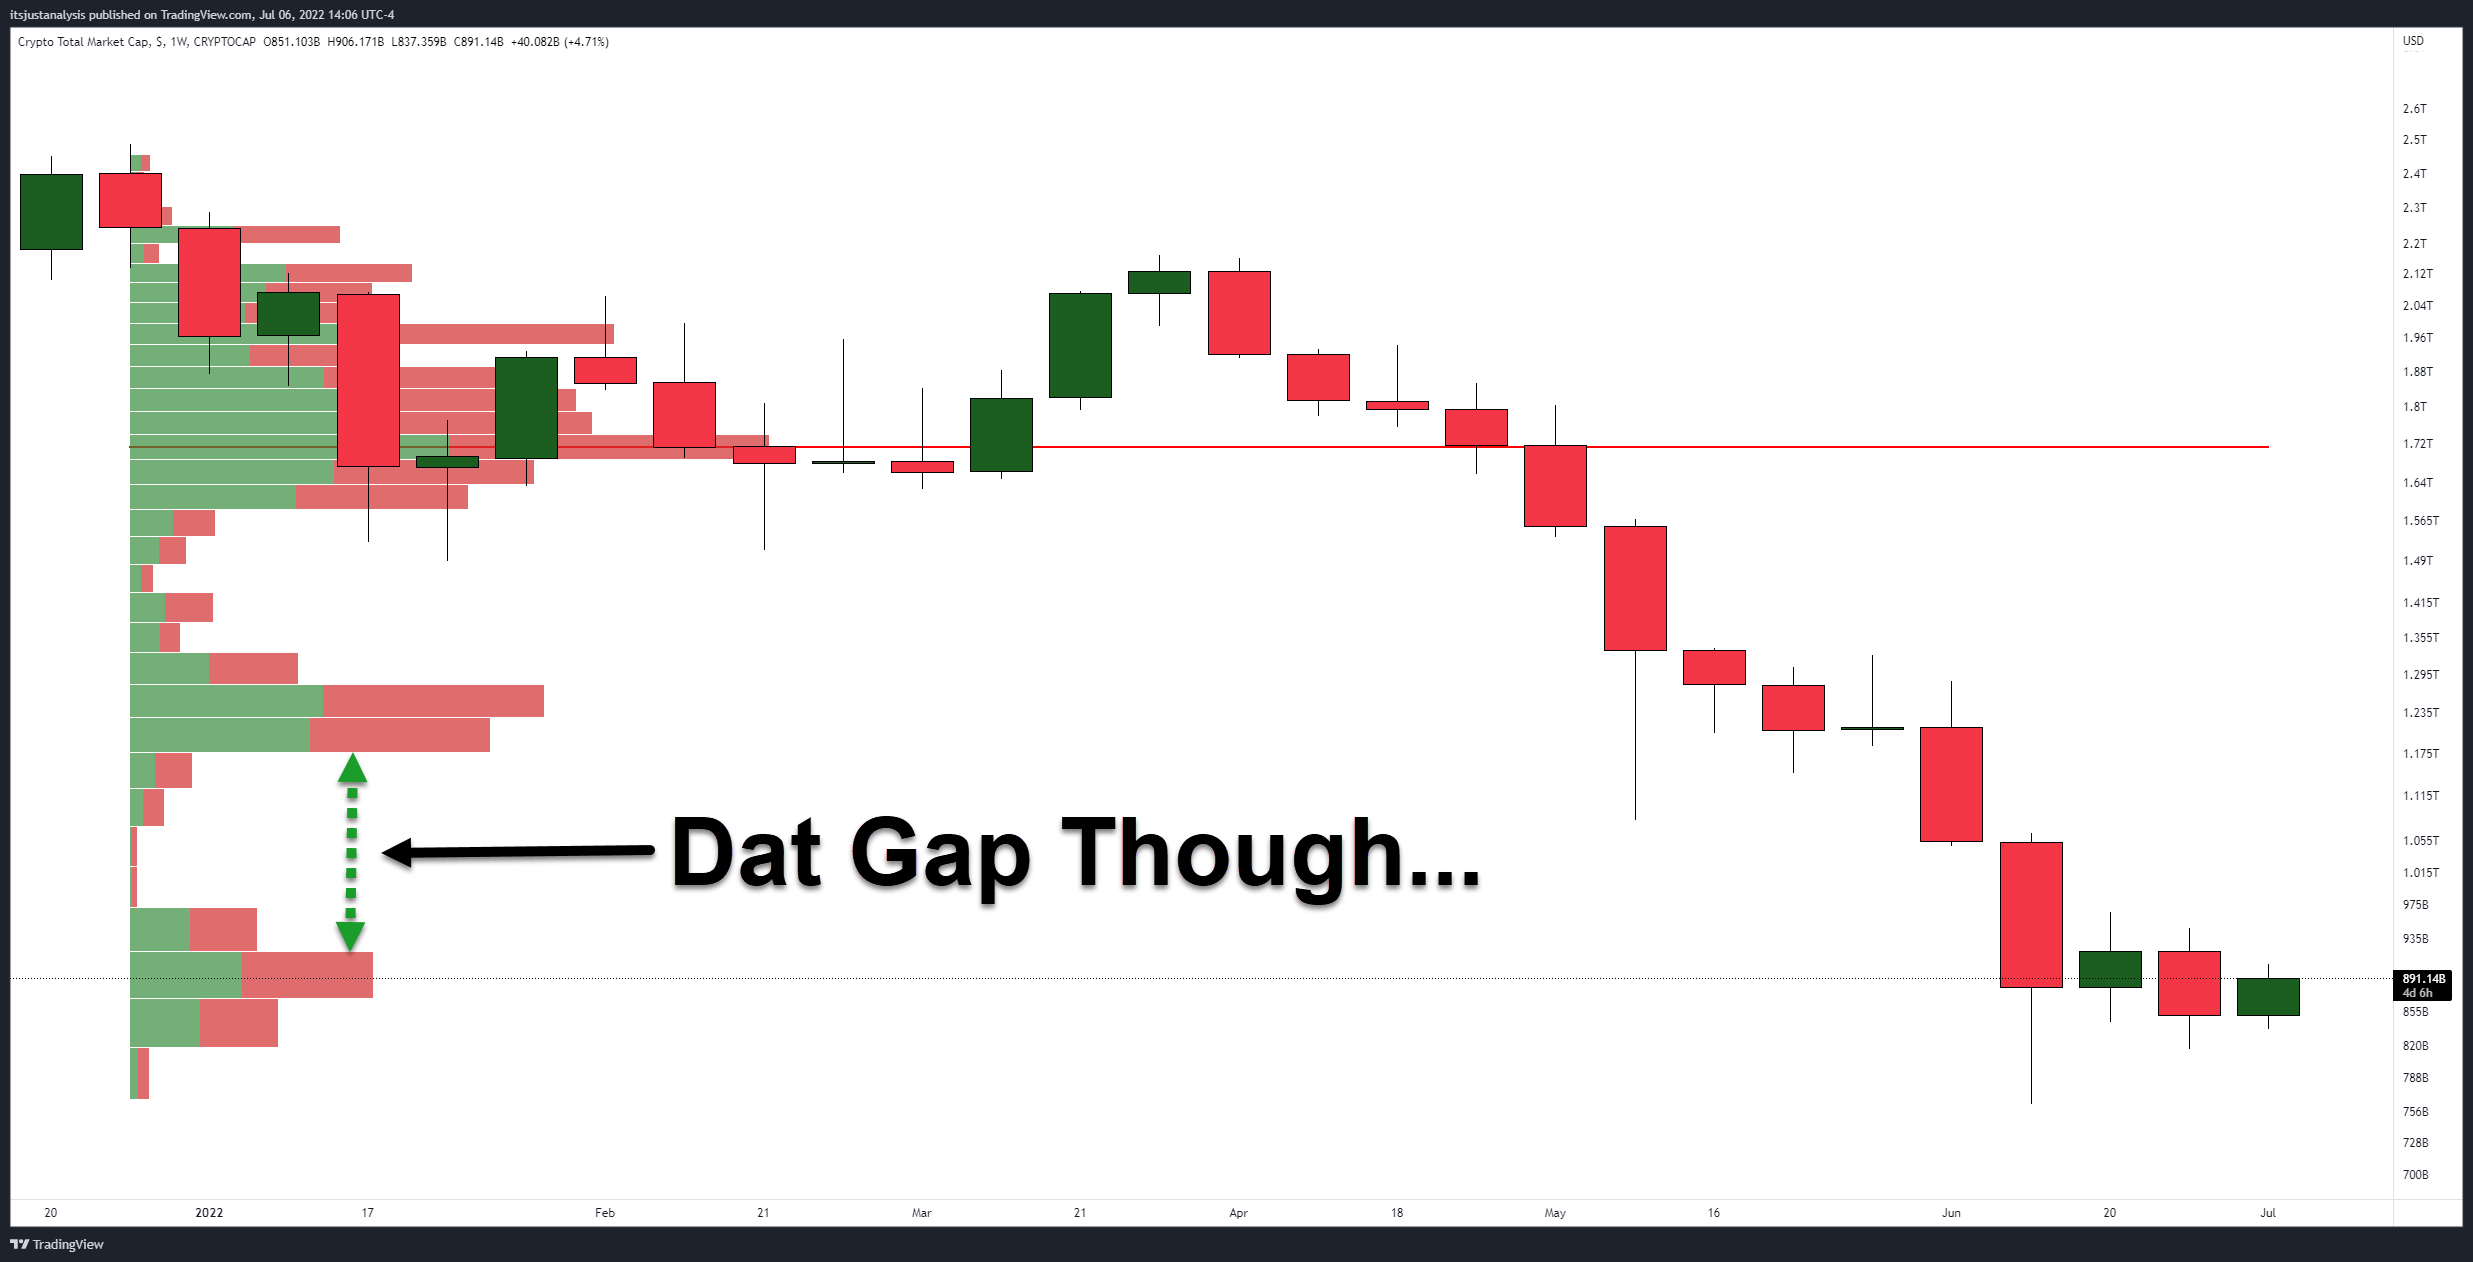
The chart above is the Total Market Cap for cryptocurrencies. The horizontal bars on the image above measure volume at price – in other words, it measures how much of something was traded at a particular price level.

When a whole lotta trading occurs at a certain level, the bars get longer. The longest chunks of the volume profile are called ‘high volume nodes.’ Now, notice the big gap between the green arrow. 

Volume profile traders loooooove gaps. Why? Because gaps act like a vacuum. For volume profile traders, this chart and that gap excite them in all the right places. In theory, if the Total Market Cap moves and closes a daily or weekly candlestick above $975 billion, we should expect a violent push higher towards the next high volume node near $1.17 trillion. 

It’s going to be exciting to watch what happens at these levels. And the Litepaper will keep you updated when the move happens. 🚀

More in   Crypto

View All

Bitcoin Hits New All-Time High Then Someone Punched It In The Face

I’m a crypto fanatic. I am constantly observing and looking at what’s going on, and like many of you, the past couple of days, I’ve been glued to my screen or phone waiting for the news when Bitcoin hit a new all-time high. 👀

And now I need your help. Because I need someone to figure out the odds of someone like me, MISSING THE GODDAMN EVENT BECAUSE OF A DR’S APPOINTMENT.

Read It

Frogs, And Dogs, And BONKs Oh My

Memecoin madness is back, and it’s like deja vu. All over again, like deja vu. 🐶

According to the fine folks at Santiment, the spotlight’s on $PEPE, $FLOKI, $BONK, and a few others, all of which have decided to moon together. Price surges of over 500% and trading volumes that skyrocketed nearly 3,000%? Just another crypto memecoin insane bull run

Read It