September is almost done, with October just around the corner. September has historically been a weak one for the crypto market. And unless something dramatic happens between now and Friday, this will be the sixth consecutive September that has closed in the red for the crypto market. Let’s look at the Total Market Cap chart.
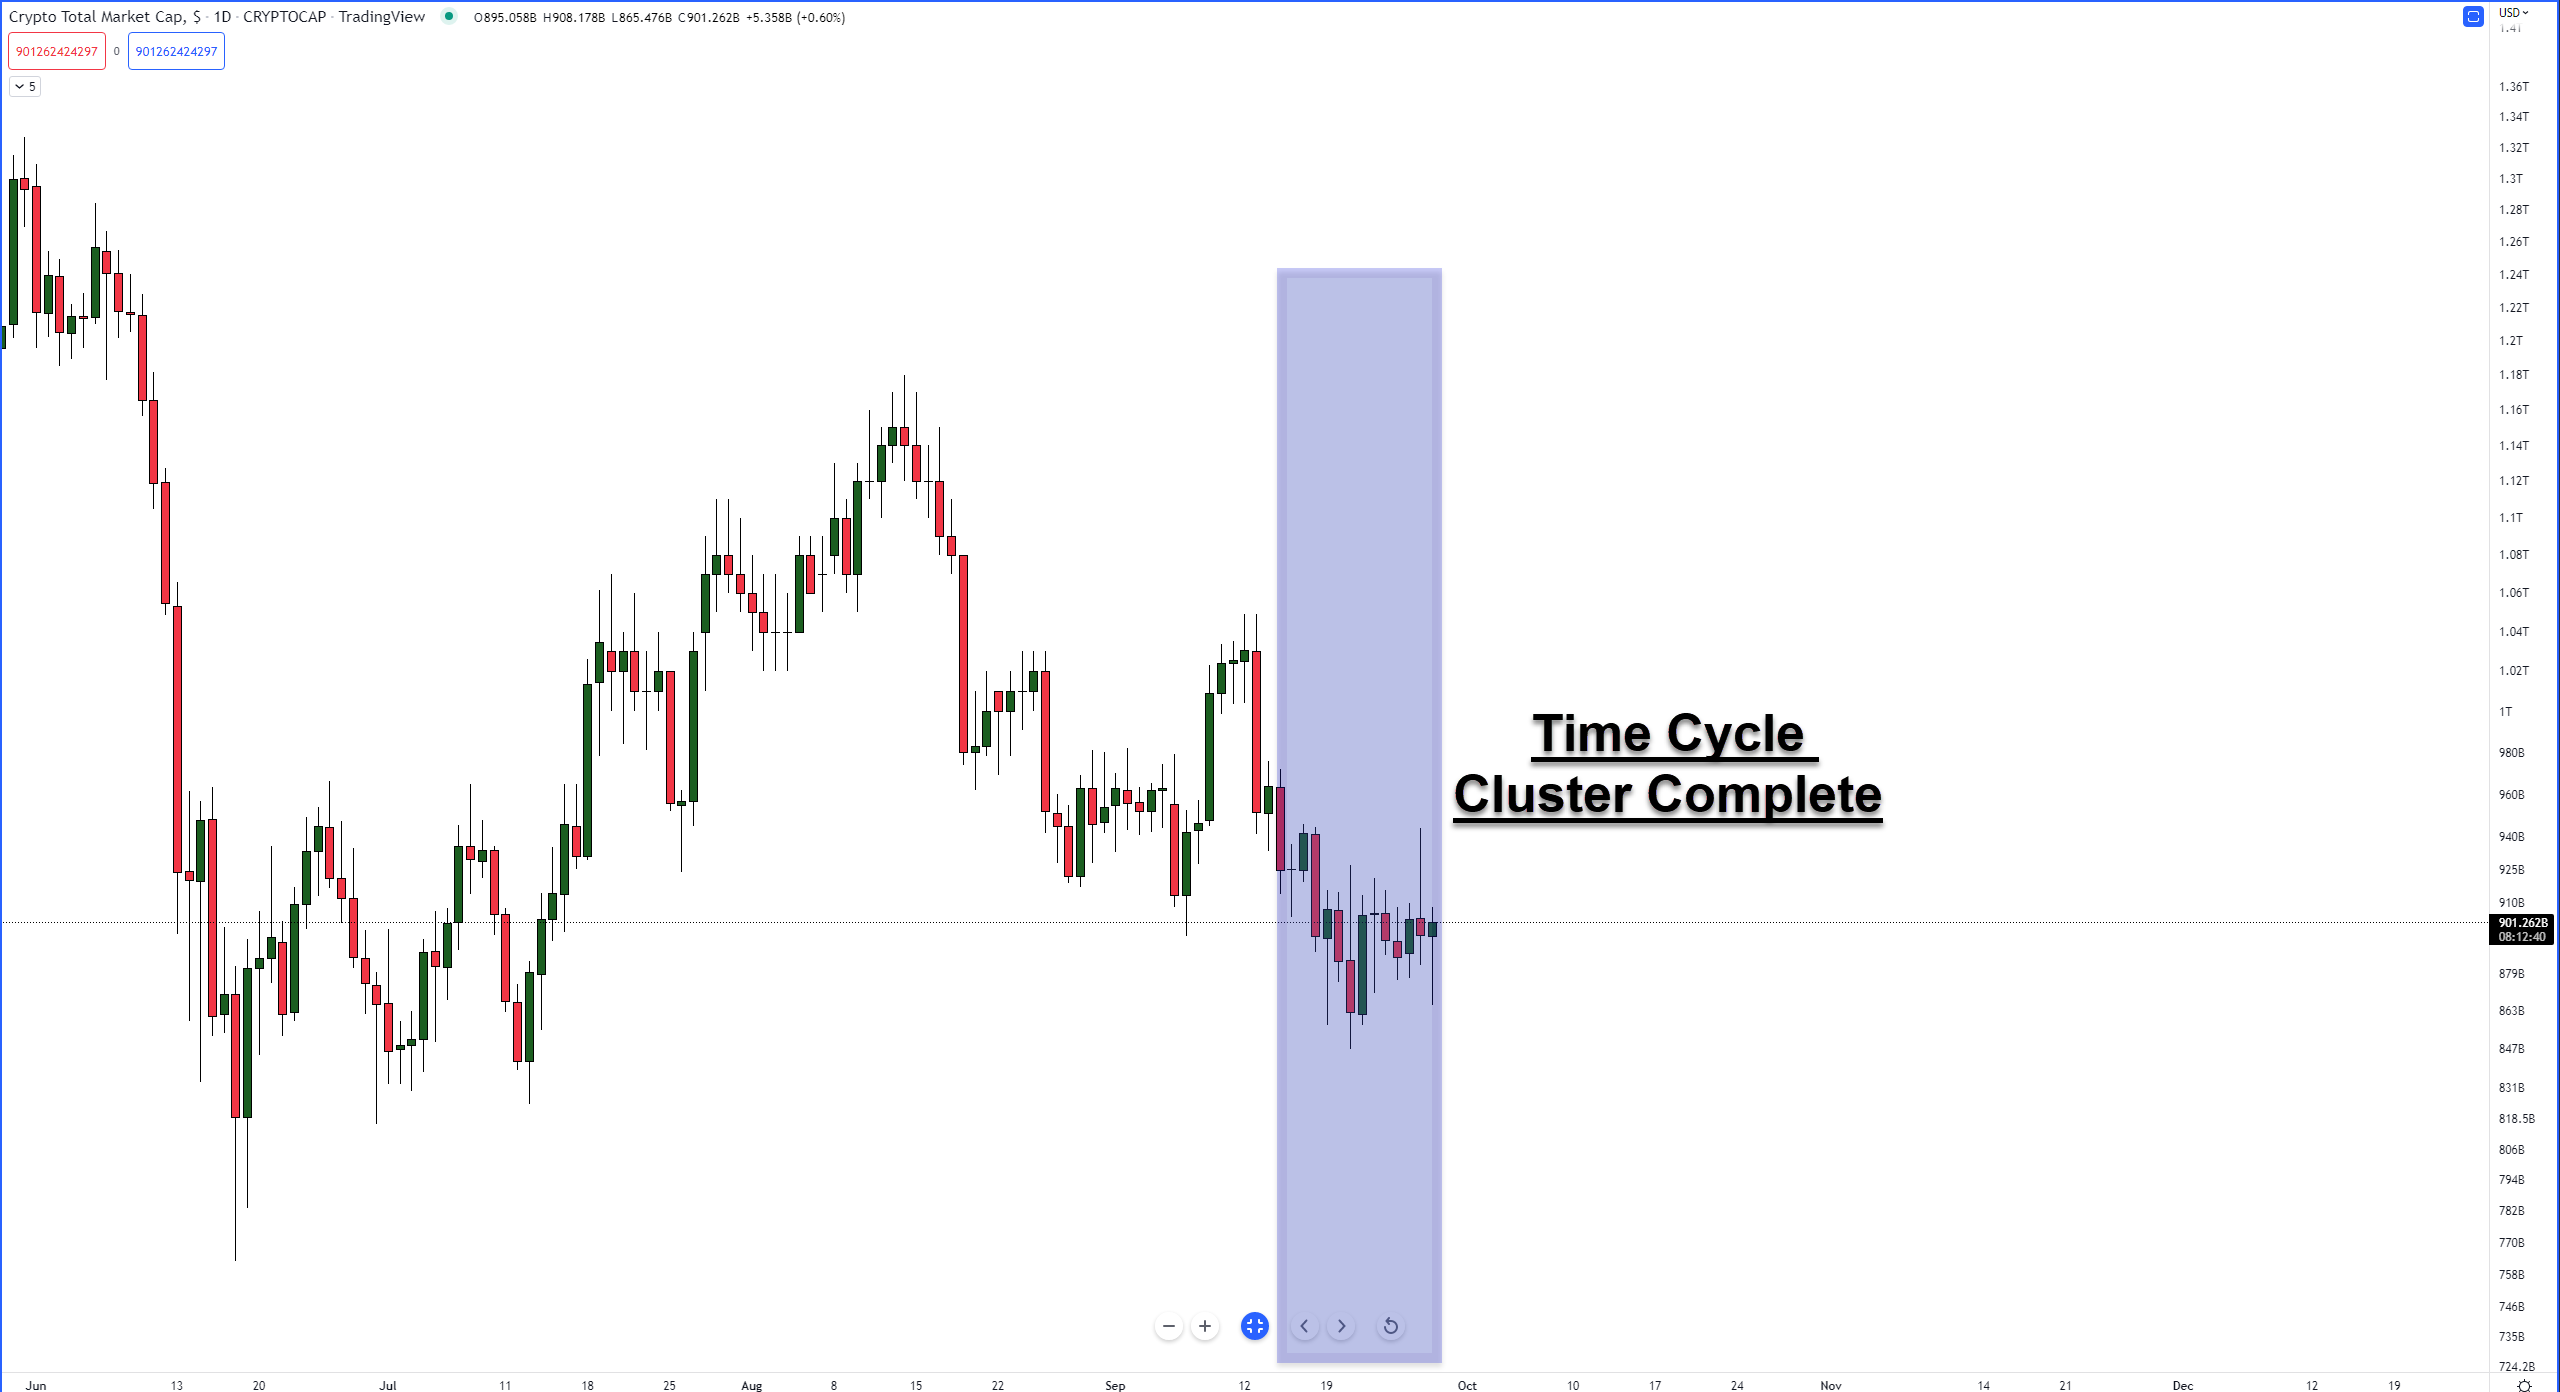
Today, September 28, 2022, is an important date from a Gann Analysis perspective. It is the final date in a massive cluster of time cycles that began on September 19 and culminated today. What does that mean? It means there is a high probability of a very powerful move and trending move beginning anytime between now and October 5.
Note: The next major time cycle cluster occurs between October 25 and October 29.
A Kumo Twist on the daily chart (not shown) within the Ichimoku Kinko Hyo system occurs today and compliments Gann’s time cycles, providing a further warning to market participants that a massive drive out of this present price range is likely.
The Volume Profile on the monthly Total Market Cap chart (below) shows that any substantial bullish or bearish breakout is positioned for an explosive move. On the upside scenario, any daily or weekly close above $975 billion means price could spike to the next high volume node at $1.6 trillion. But with Bitcoin struggling to hold and maintain the $20,000 value area, the upside scenario is difficult.
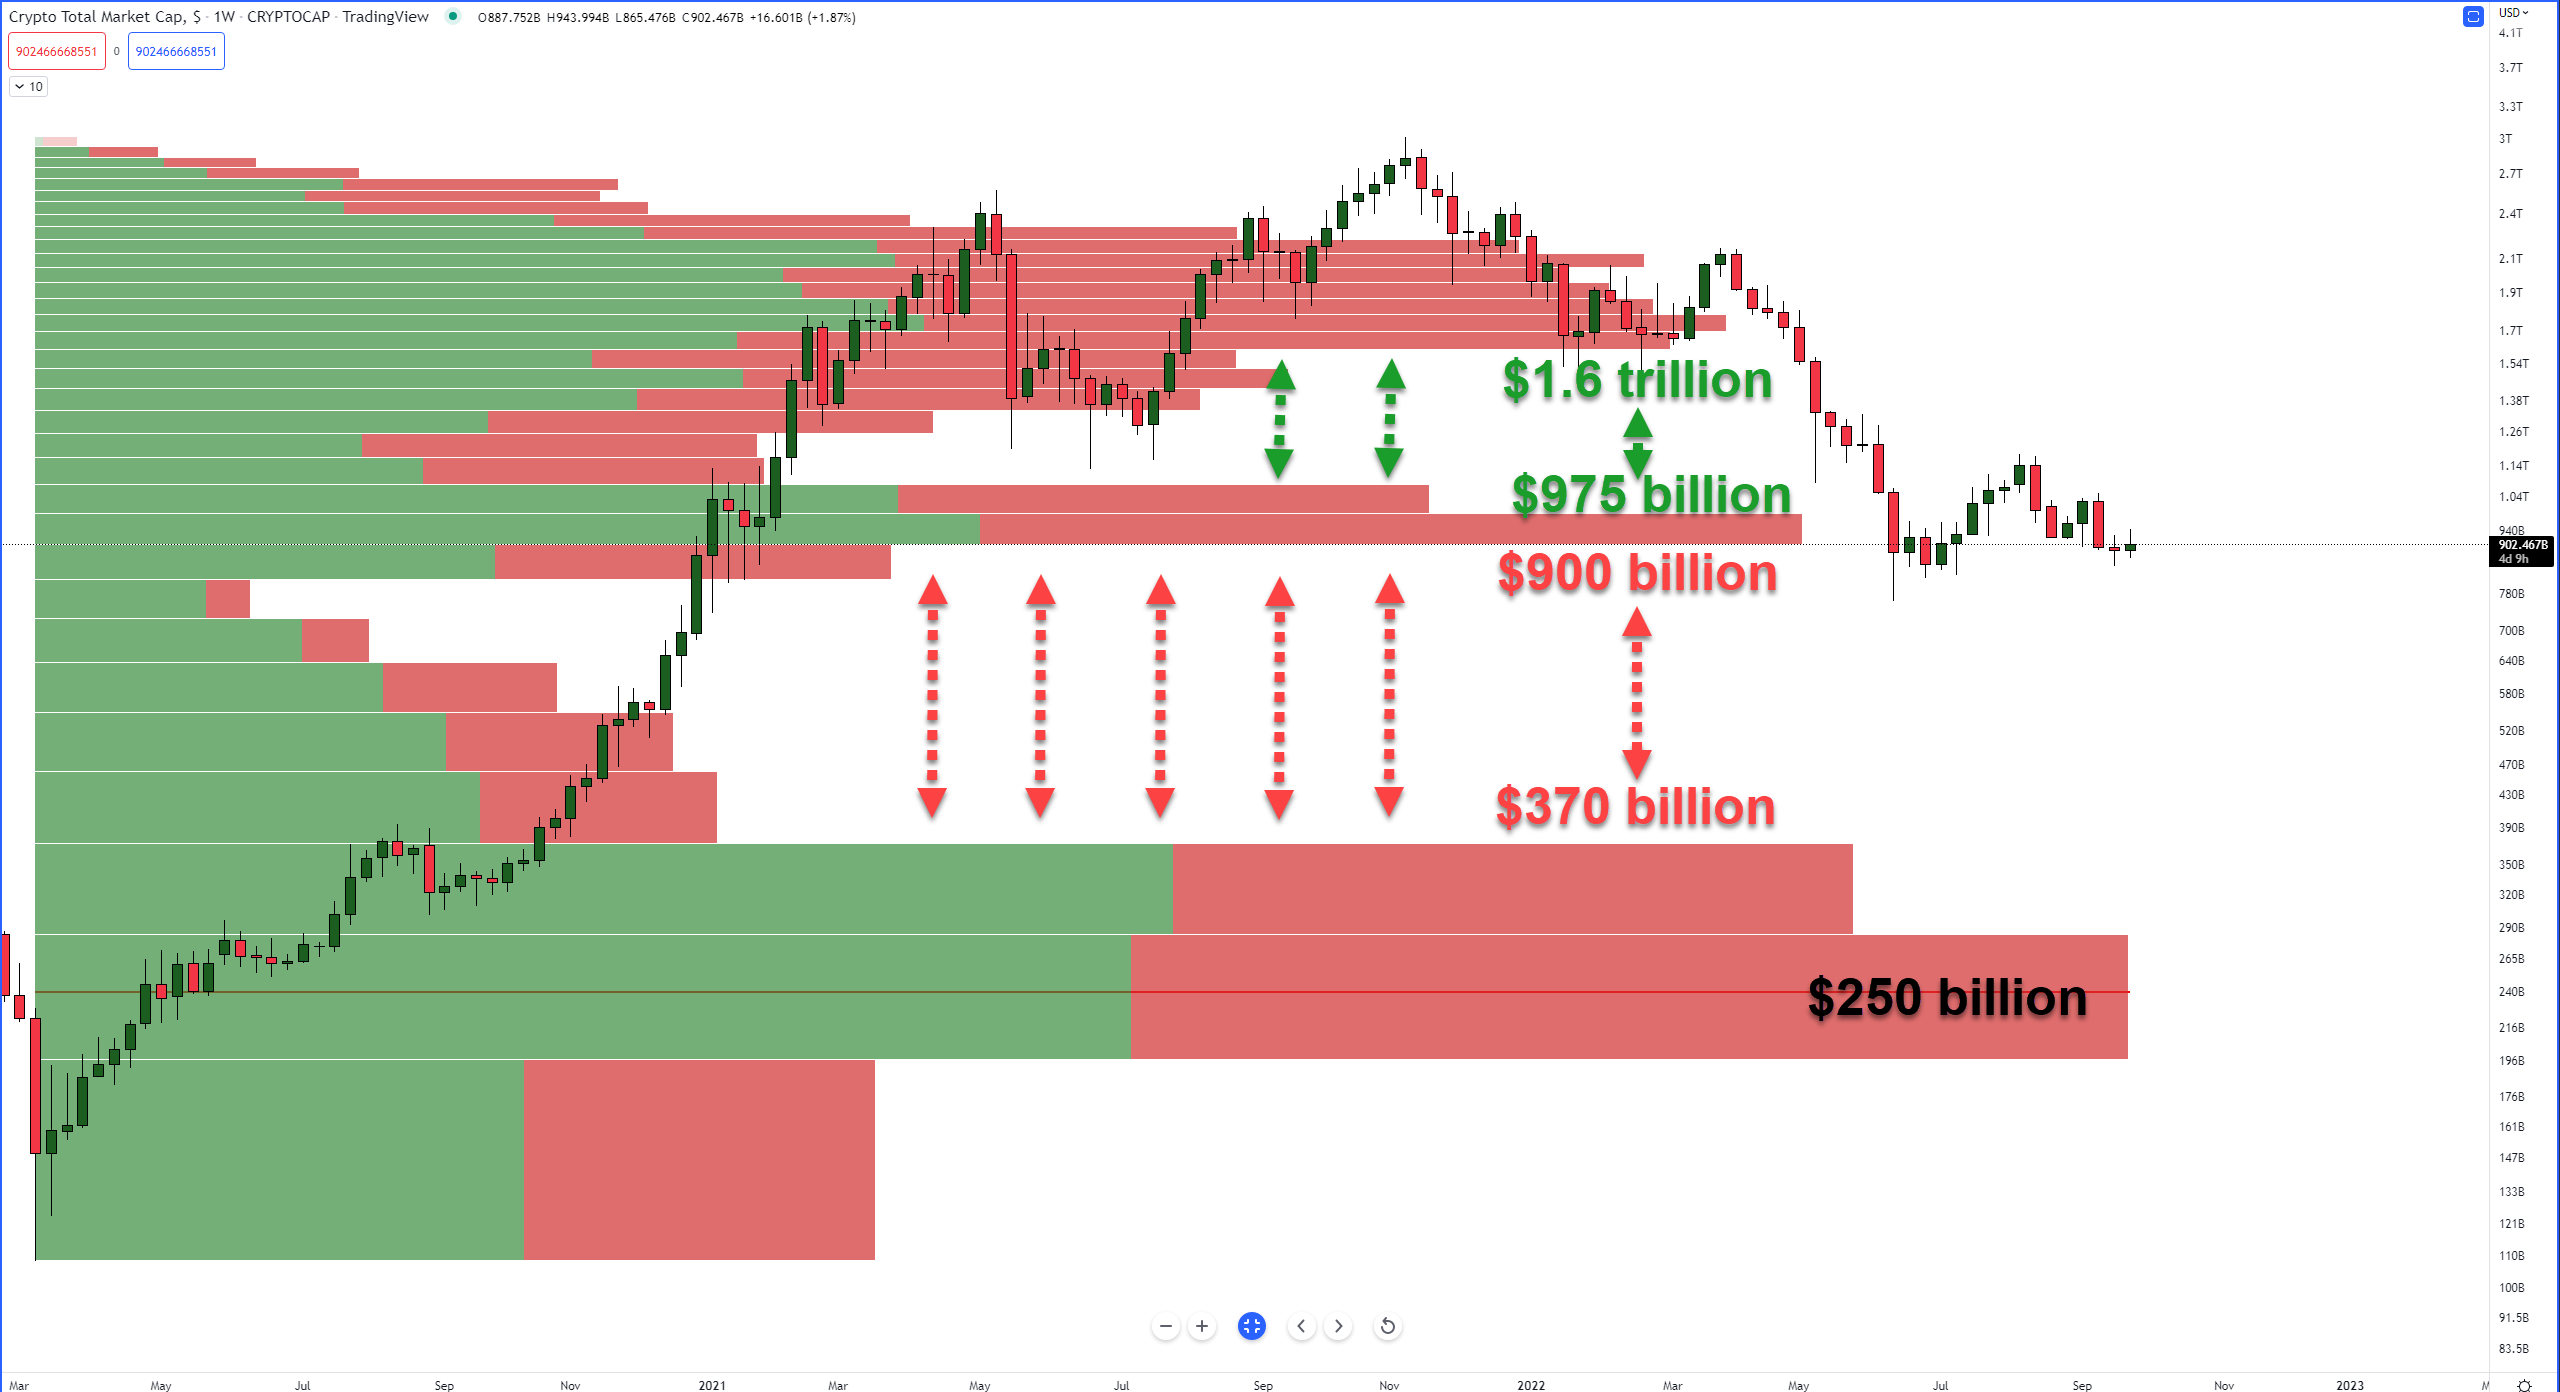
An explosive move lower is the most immediate and most likely given where the Total Market Cap is presently positioned. The current weekly candlestick is parked right on top of the bottom of the current high volume node at $900 billion. Any close at or below $900 billion threatens a swift collapse to the next high volume node near $370 billion.
However, from the perspective of the Ichimoku Kinko Hyo system on the monthly chart, it shows further downside pressure may be limited to exhausted. Note the monthly Total Market Cap chart above below. I removed the wicks from the candlesticks to clarify the space between the bodies of the candlesticks and the Tenkan-Sen.
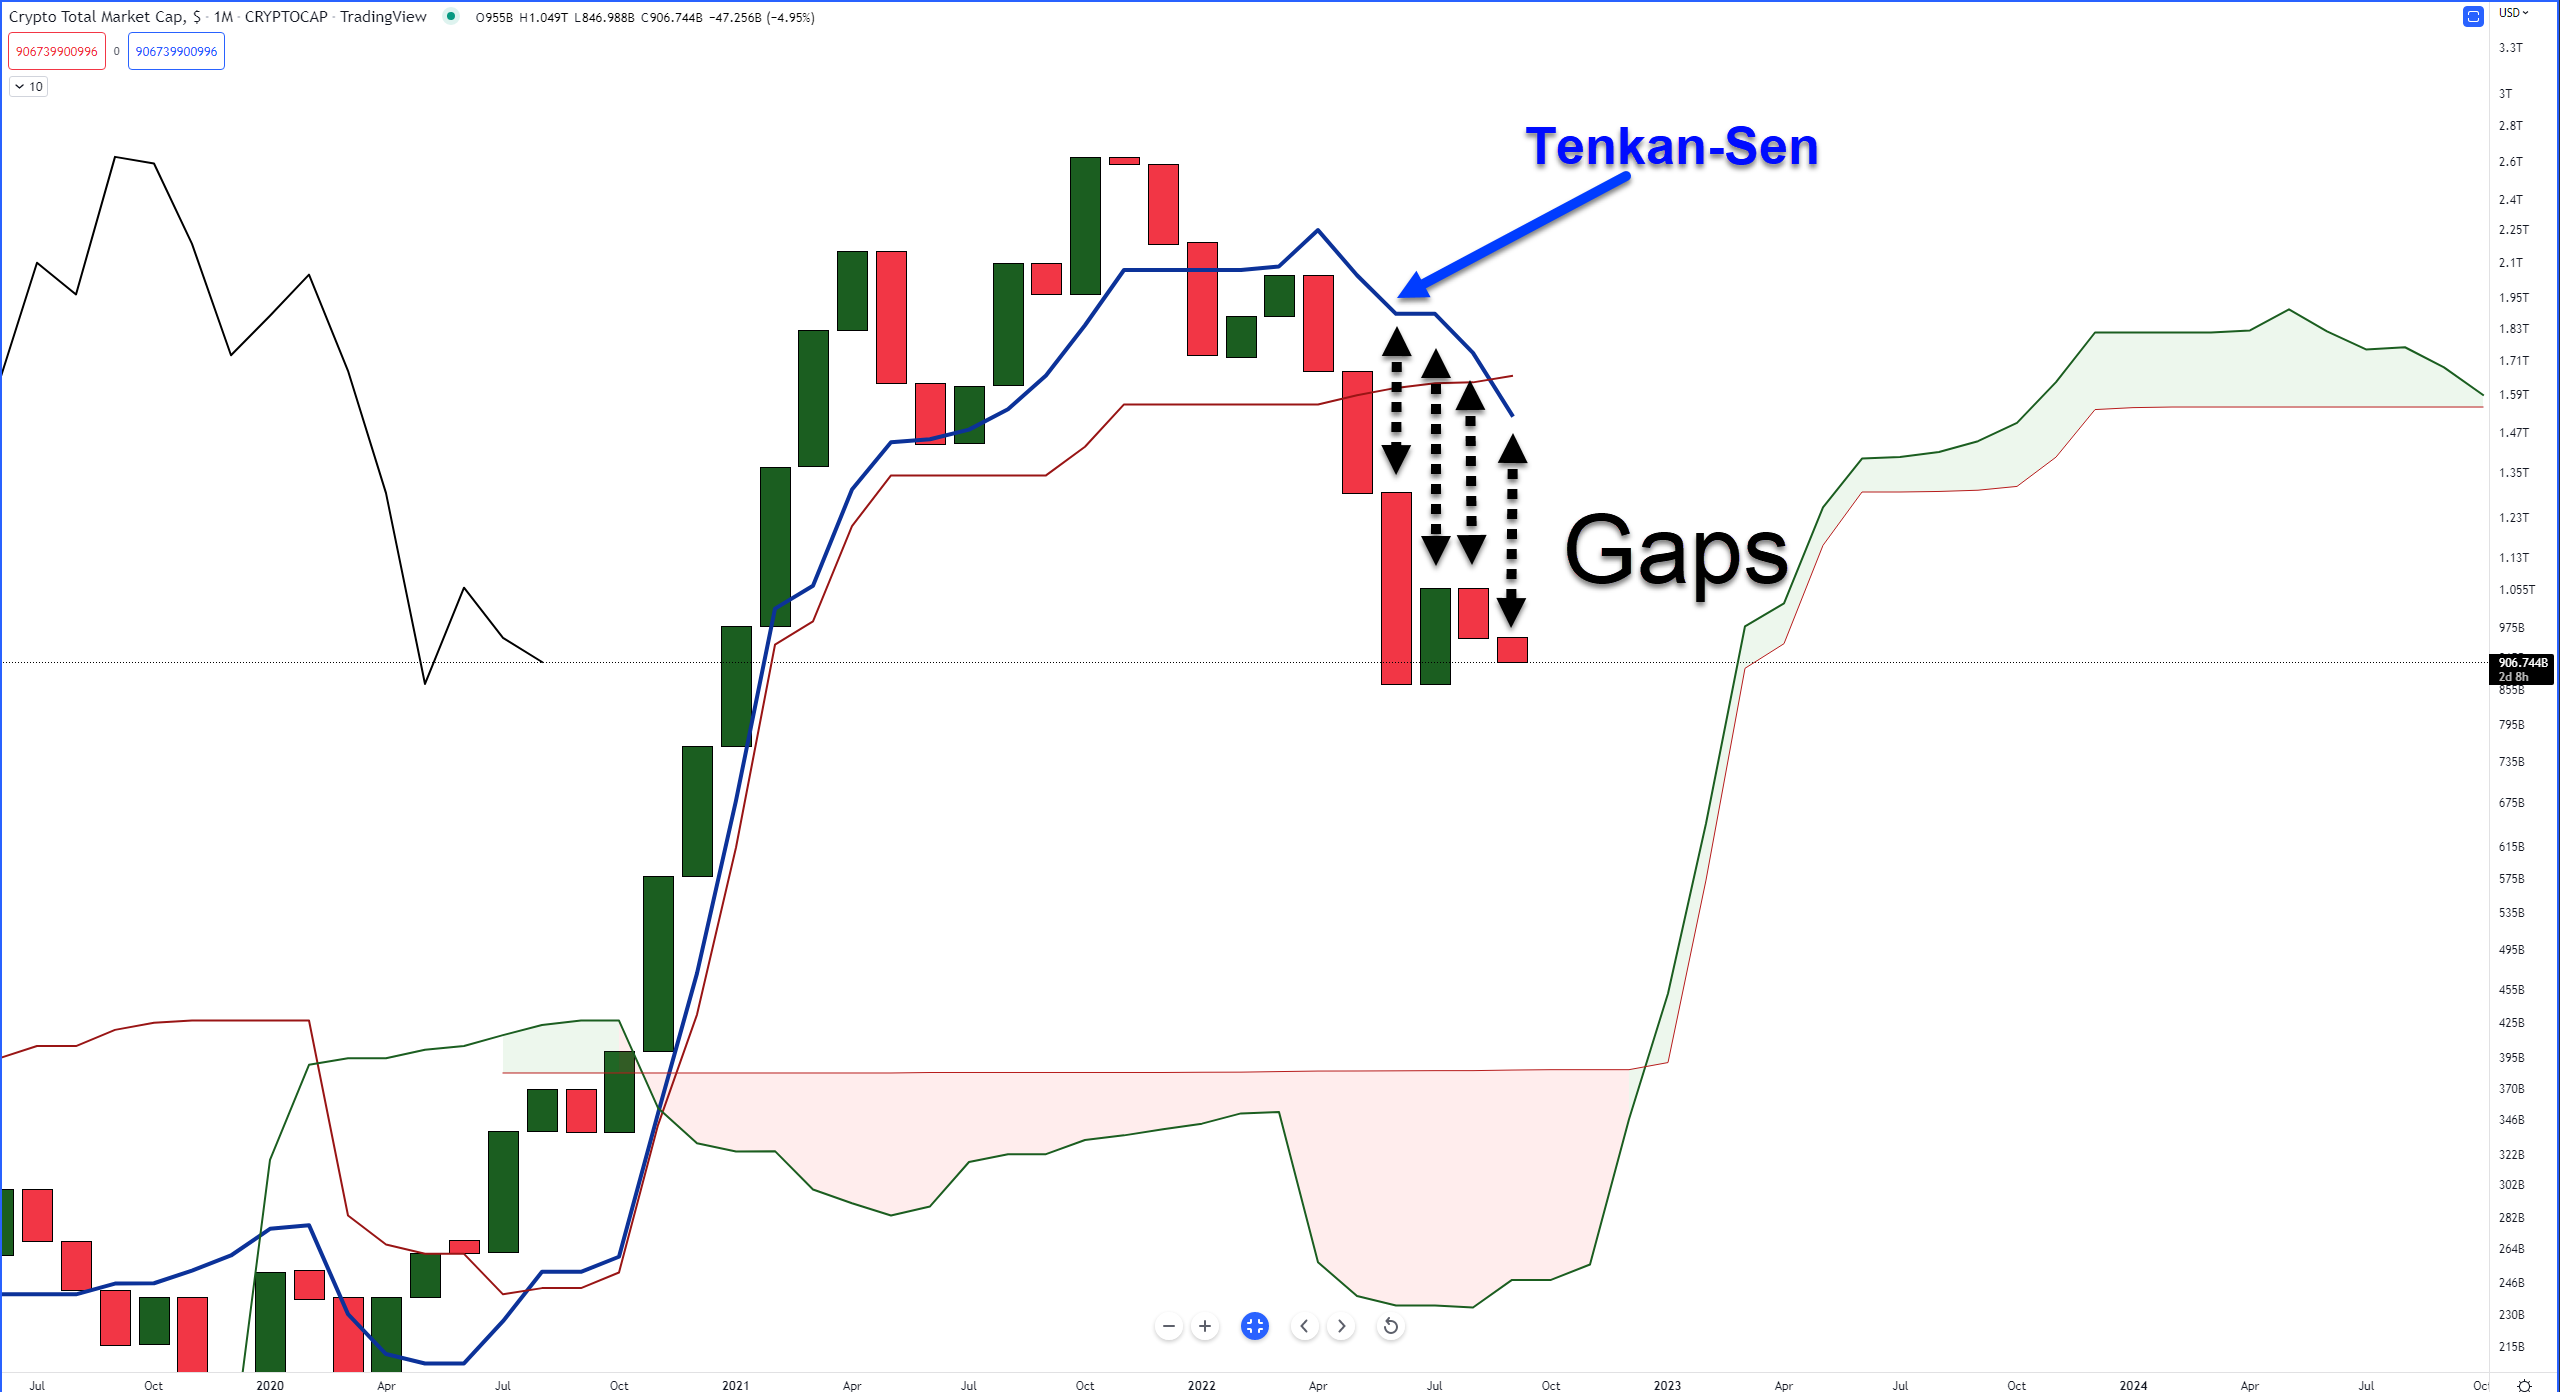
Gaps between the bodies of candlesticks and the Tenkan-Sen do not last long and often correct within a few periods – and the monthly chart is most definitely within that range of correction. The candlestick body and the Tenkan-Sen are like a negative and positive poled magnet – it’s very hard to keep them away from each other before they snap back.
The monthly oscillators show further difficulty moving lower from the present range. The Relative Strength Index (RSI) remains in bull market conditions and is presently just above the final oversold level of 40, with small signs of regular bullish divergence developing.
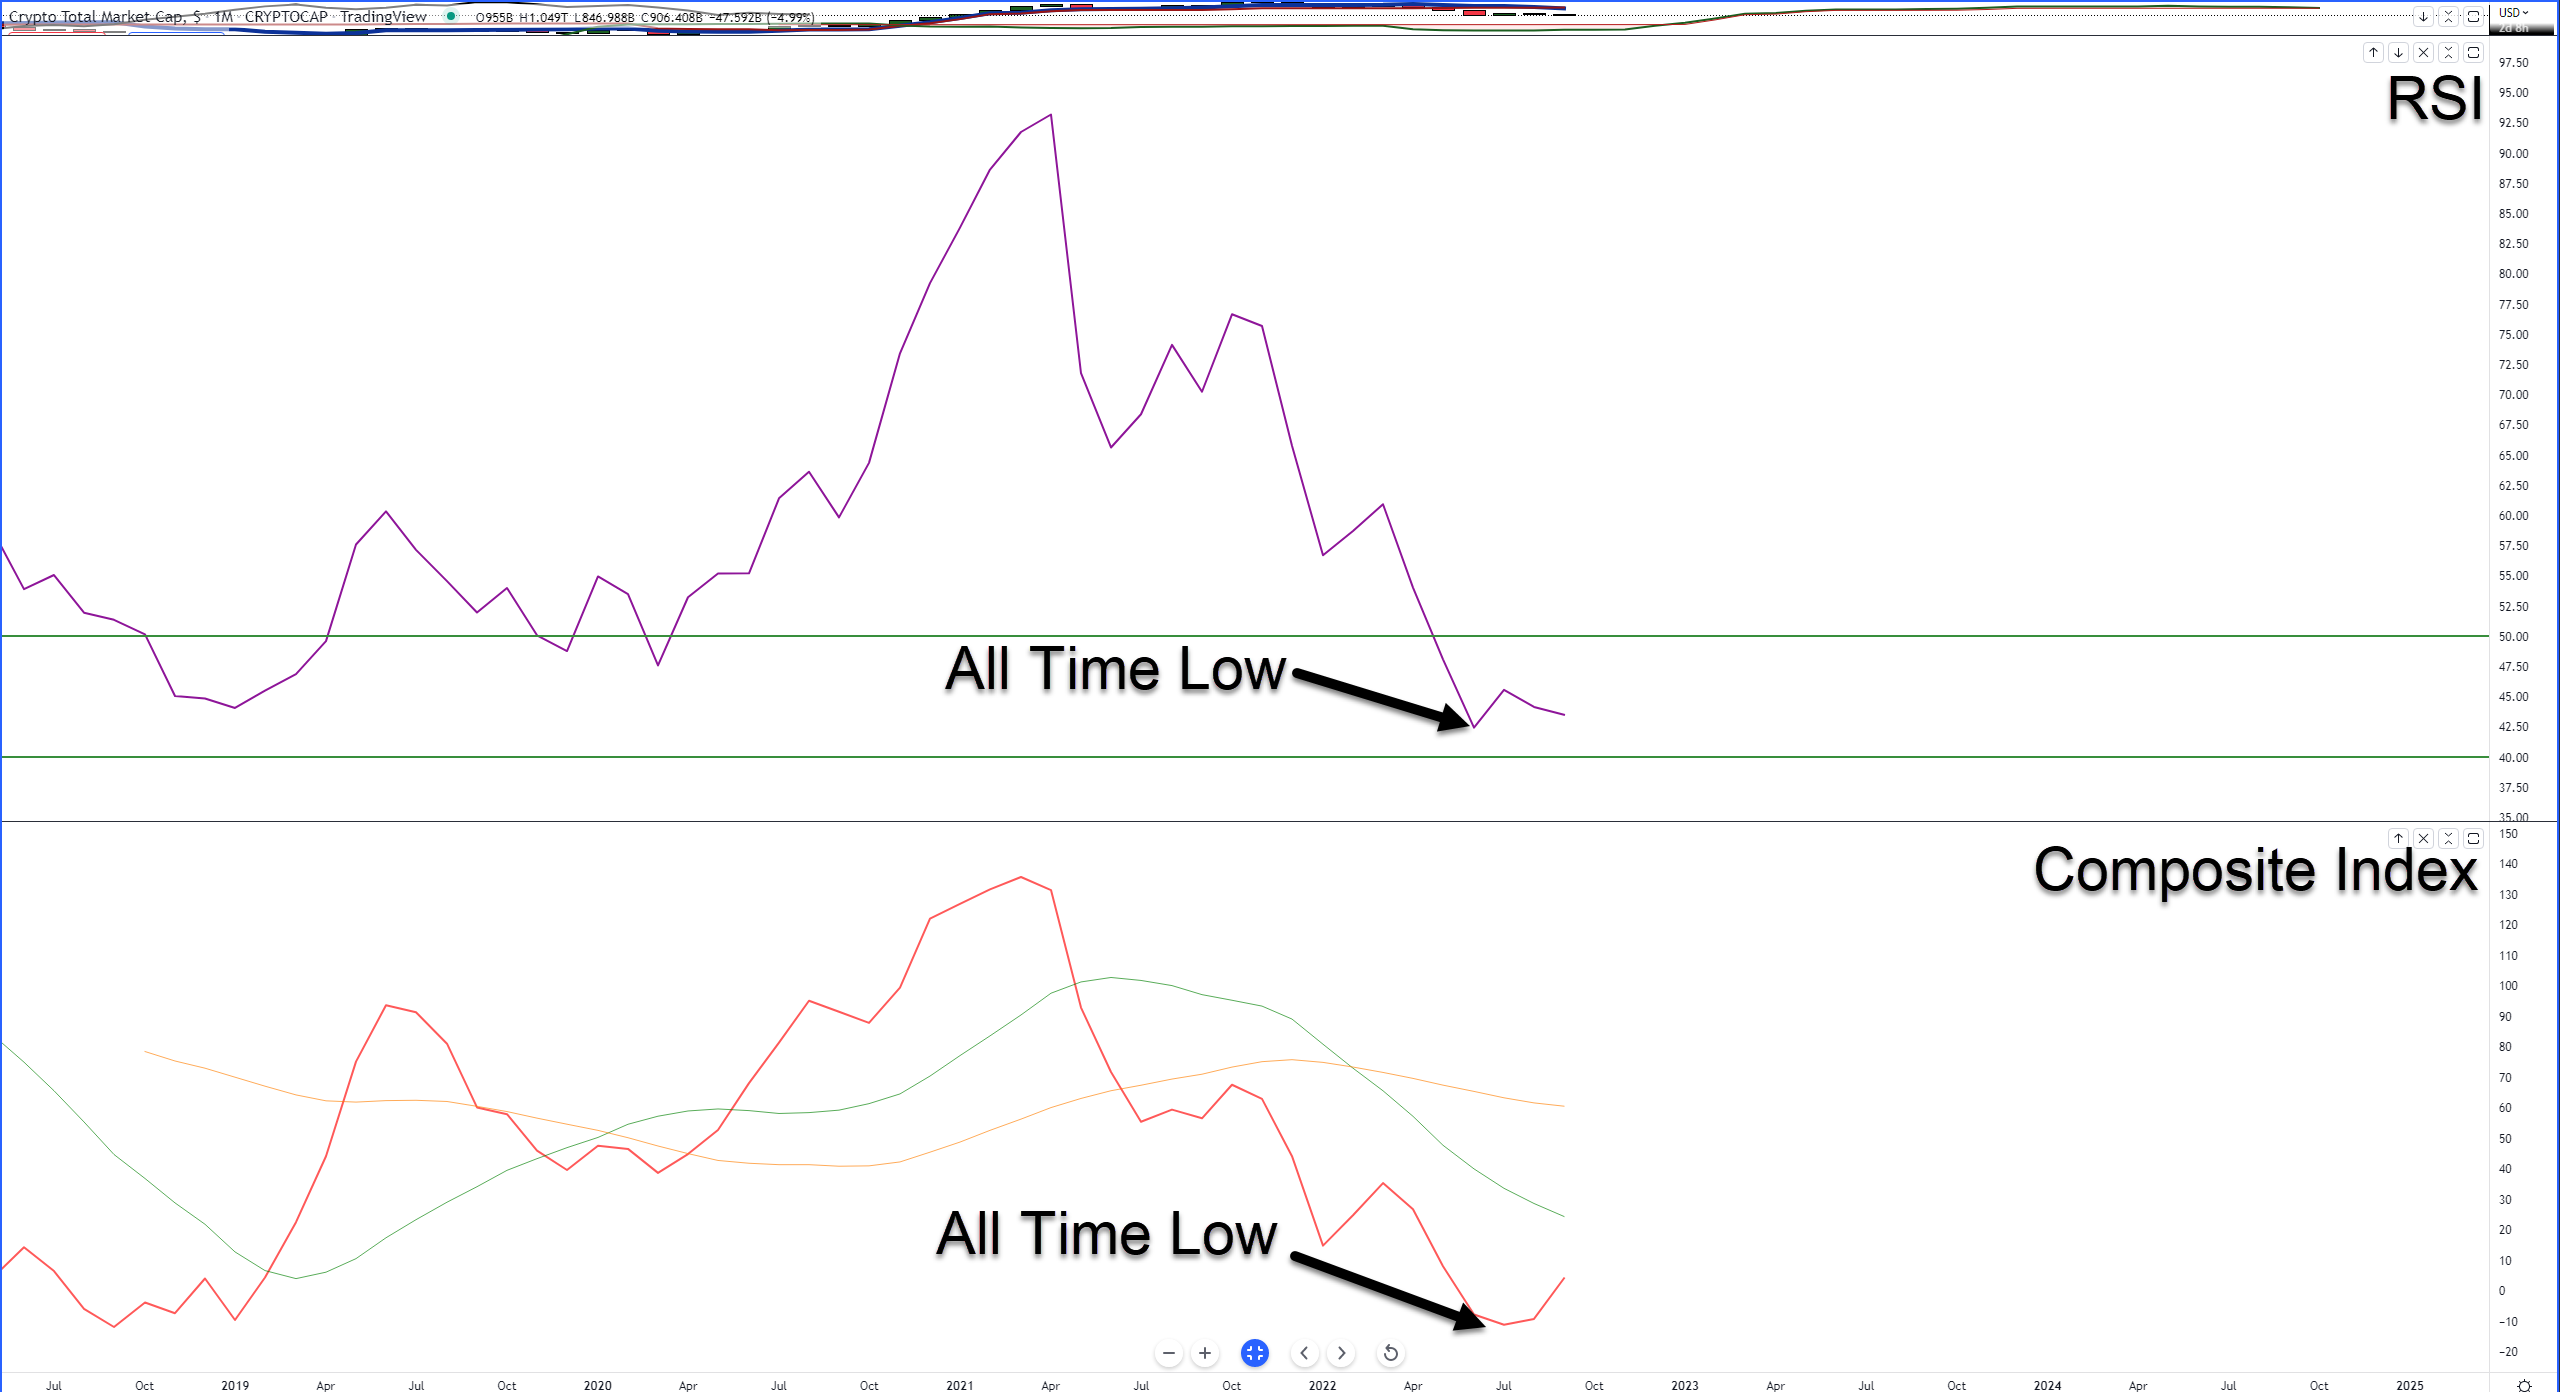
Likewise, the Composite Index is coming off of new all-time lows. The current slope is quite extreme and not far from its fast-moving average (green moving average). Connie Brown, the inventor of the Composite Index, warned that some of the strongest signals of an imminent spike are when the Composite Index crosses its fast (or slow) moving average close to the zero level – which is right where the Composite Index is currently at.
It is undoubtedly a hard read given strong reasons to be bullish and bearish. Sometimes the best thing to do is sit and wait. 🧠