There’s a TL;DR (Too Long;Didn’t Read) at the end of this article if you want to skip to the summary.
The daily chart for the Total Crypto Market cap below is a perfect example of how evil the Cloud is. The Cloud represents volatility, indecision, misery, and everything bad. It’s where trading accounts go to die.
If we look back at the past week, chop doesn’t really begin to define what a frustrating week it’s been for bulls and bears alike. But, hopefully, maybe some of that chop might end.
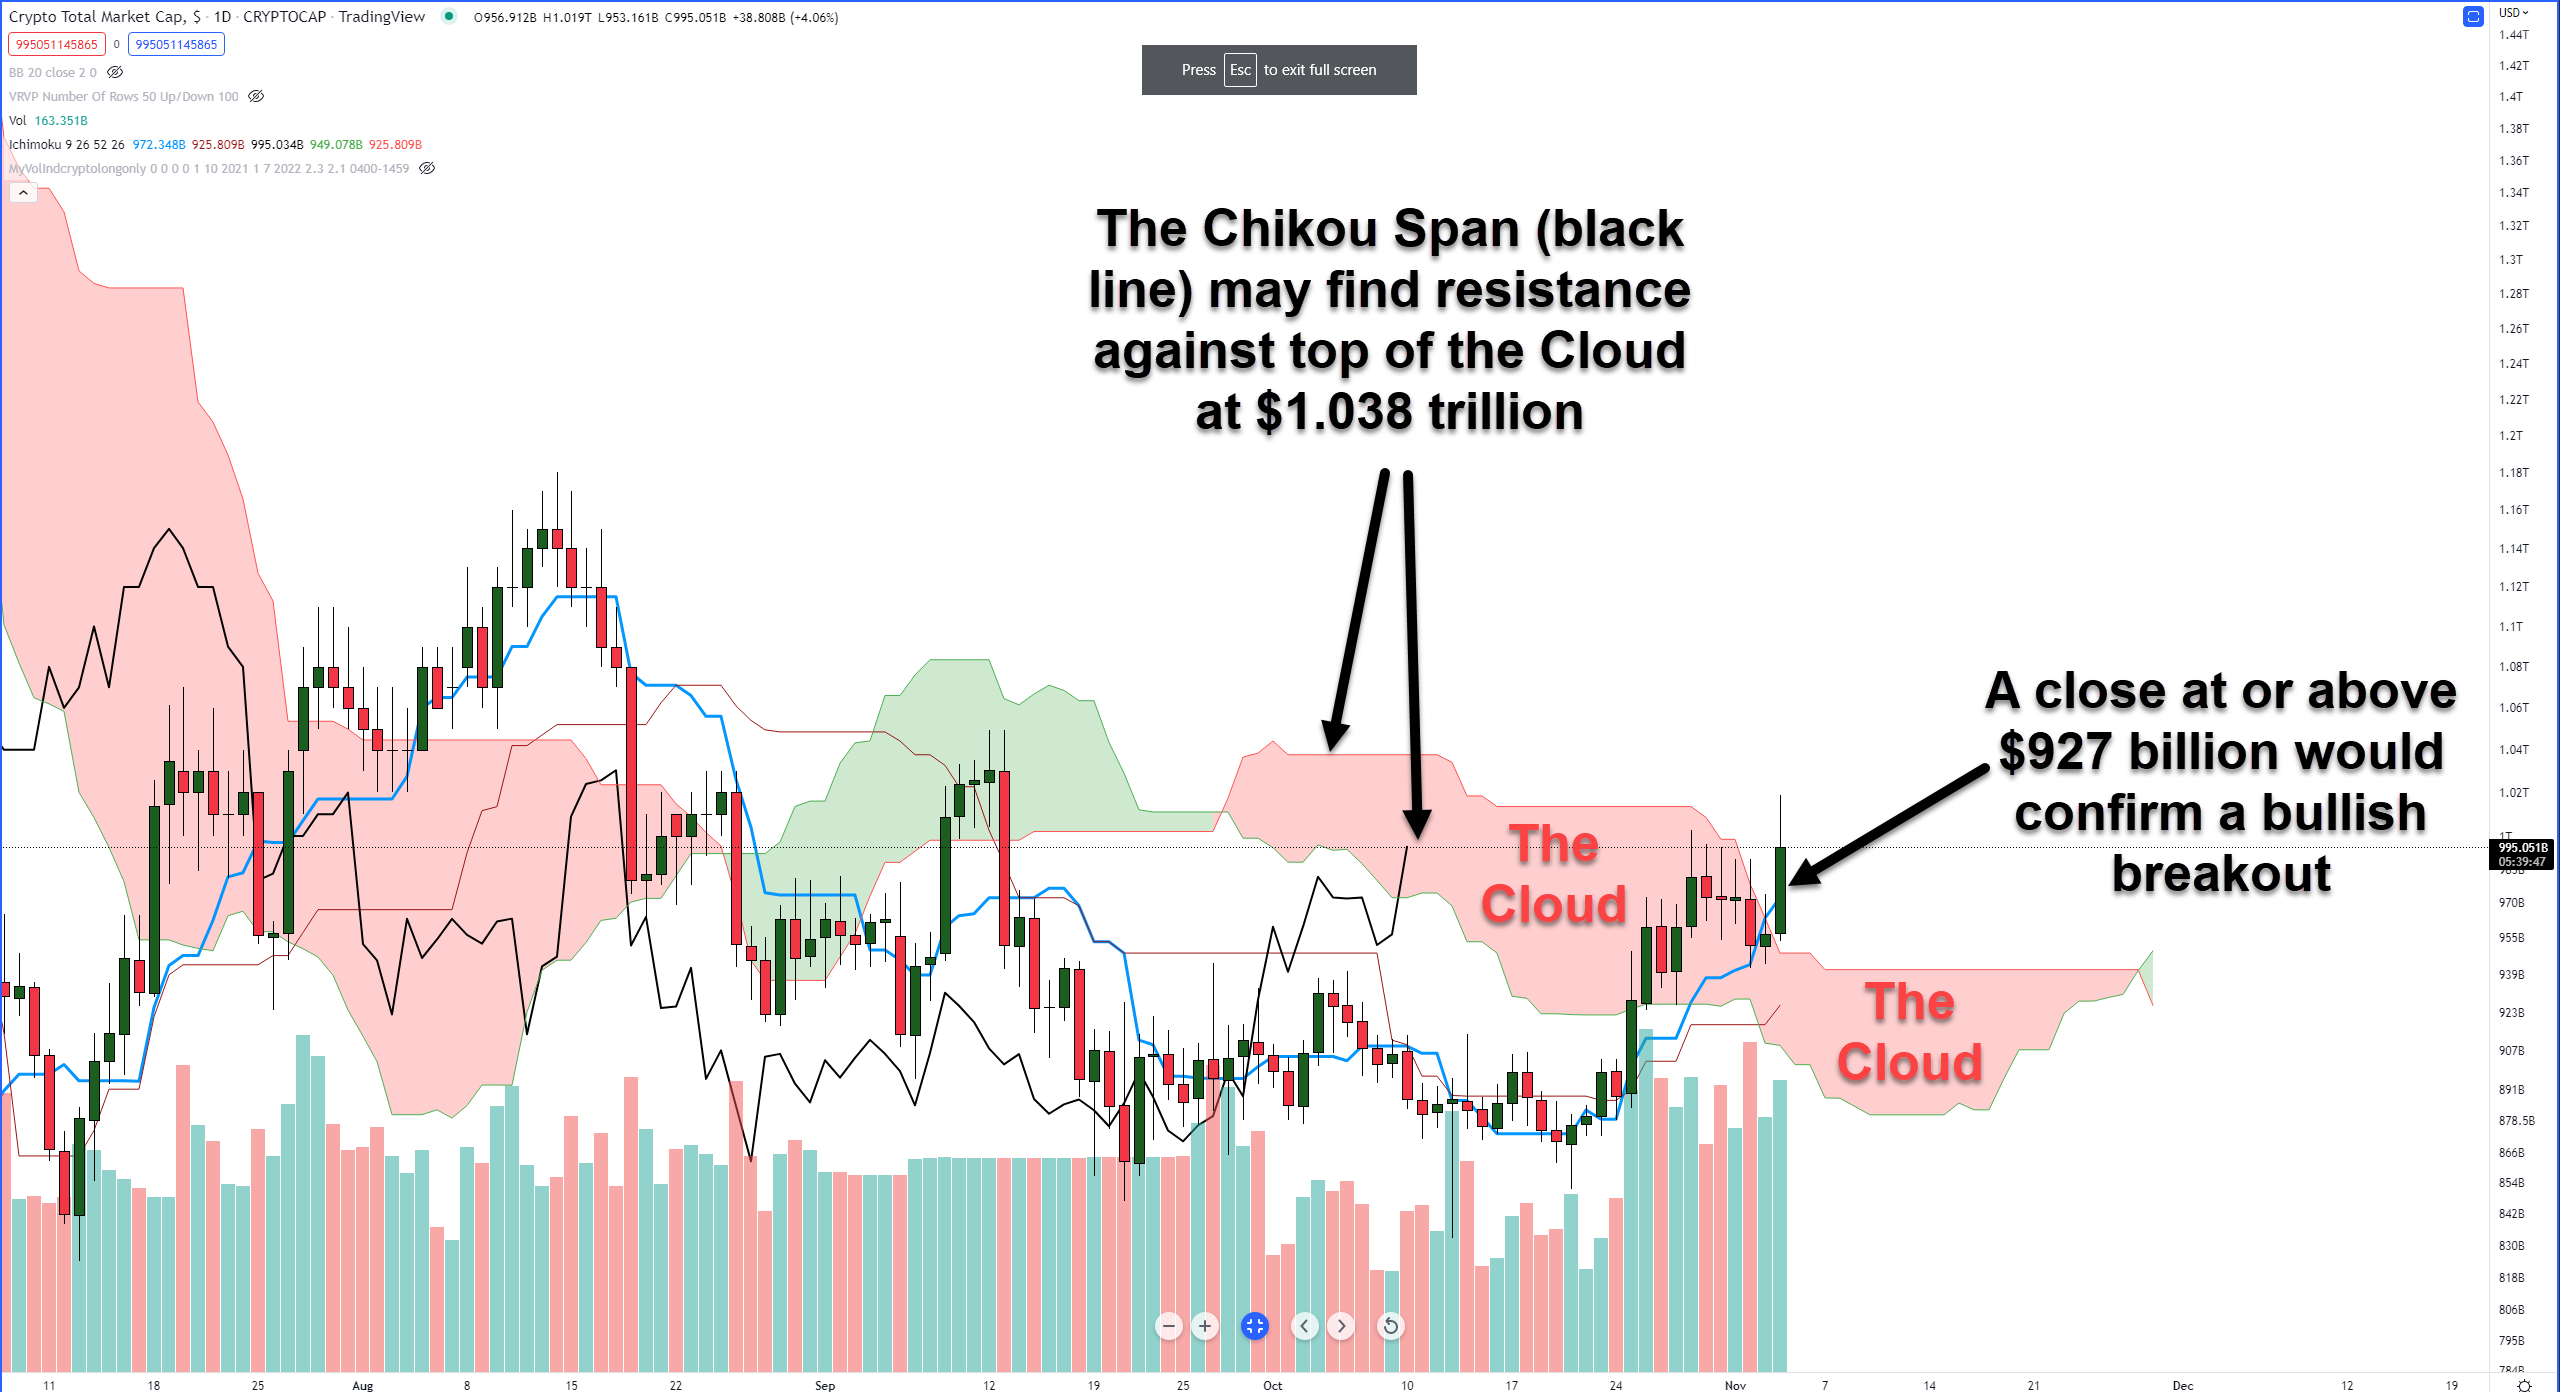
If the Total Market Cap closes above the Cloud and the Tenkan-Sen, then it will fulfill one of the most sought-after bullish conditions within the Ichimoku Kinko Hyo system, known as an Ideal Bullish Ichimoku Breakout. The Total Market Cap chart doesn’t even need to close at $1 trillion to accomplish that, it just needs to close at or above $927 billion.
If the Total Market Cap chart closes above the Cloud, it will be the first time since August 18, 2022. But does that mean moon time is coming? Don’t count your chickens. The weekend is coming up, and weekends are notorious for killing any gains made in the week – Sundays in particular; that’s why they’re called Sell-Off Sundays, Slaughter Sundays, or Bloody Sundays.
Bulls might have a tricky time moving higher over the weekend because of where the Chikou Span is (black line). The Chikou Span reacts to the same support and resistance levels as price, and the top of the Ichimoku Cloud (Senkou Span B) is just above it at $1.038 trillion.
So, the Total Market Cap could move lower, but the strongest level of support/resistance in the Ichimoku system, Senkou Span B, is just below. And when Senkou Span B is flat, it represents strength. And the longer Senkou Span B is flat, the stronger it’s perceived to be.
That means sellers may have some problems keeping the Total Market Cap below $942 billion.
TL;DR
Weekends are dangerous and often generate massive volatility. Primary resistance ahead for the Total Market Cap is near the $1.038 trillion value area. Support is at $942 billion.