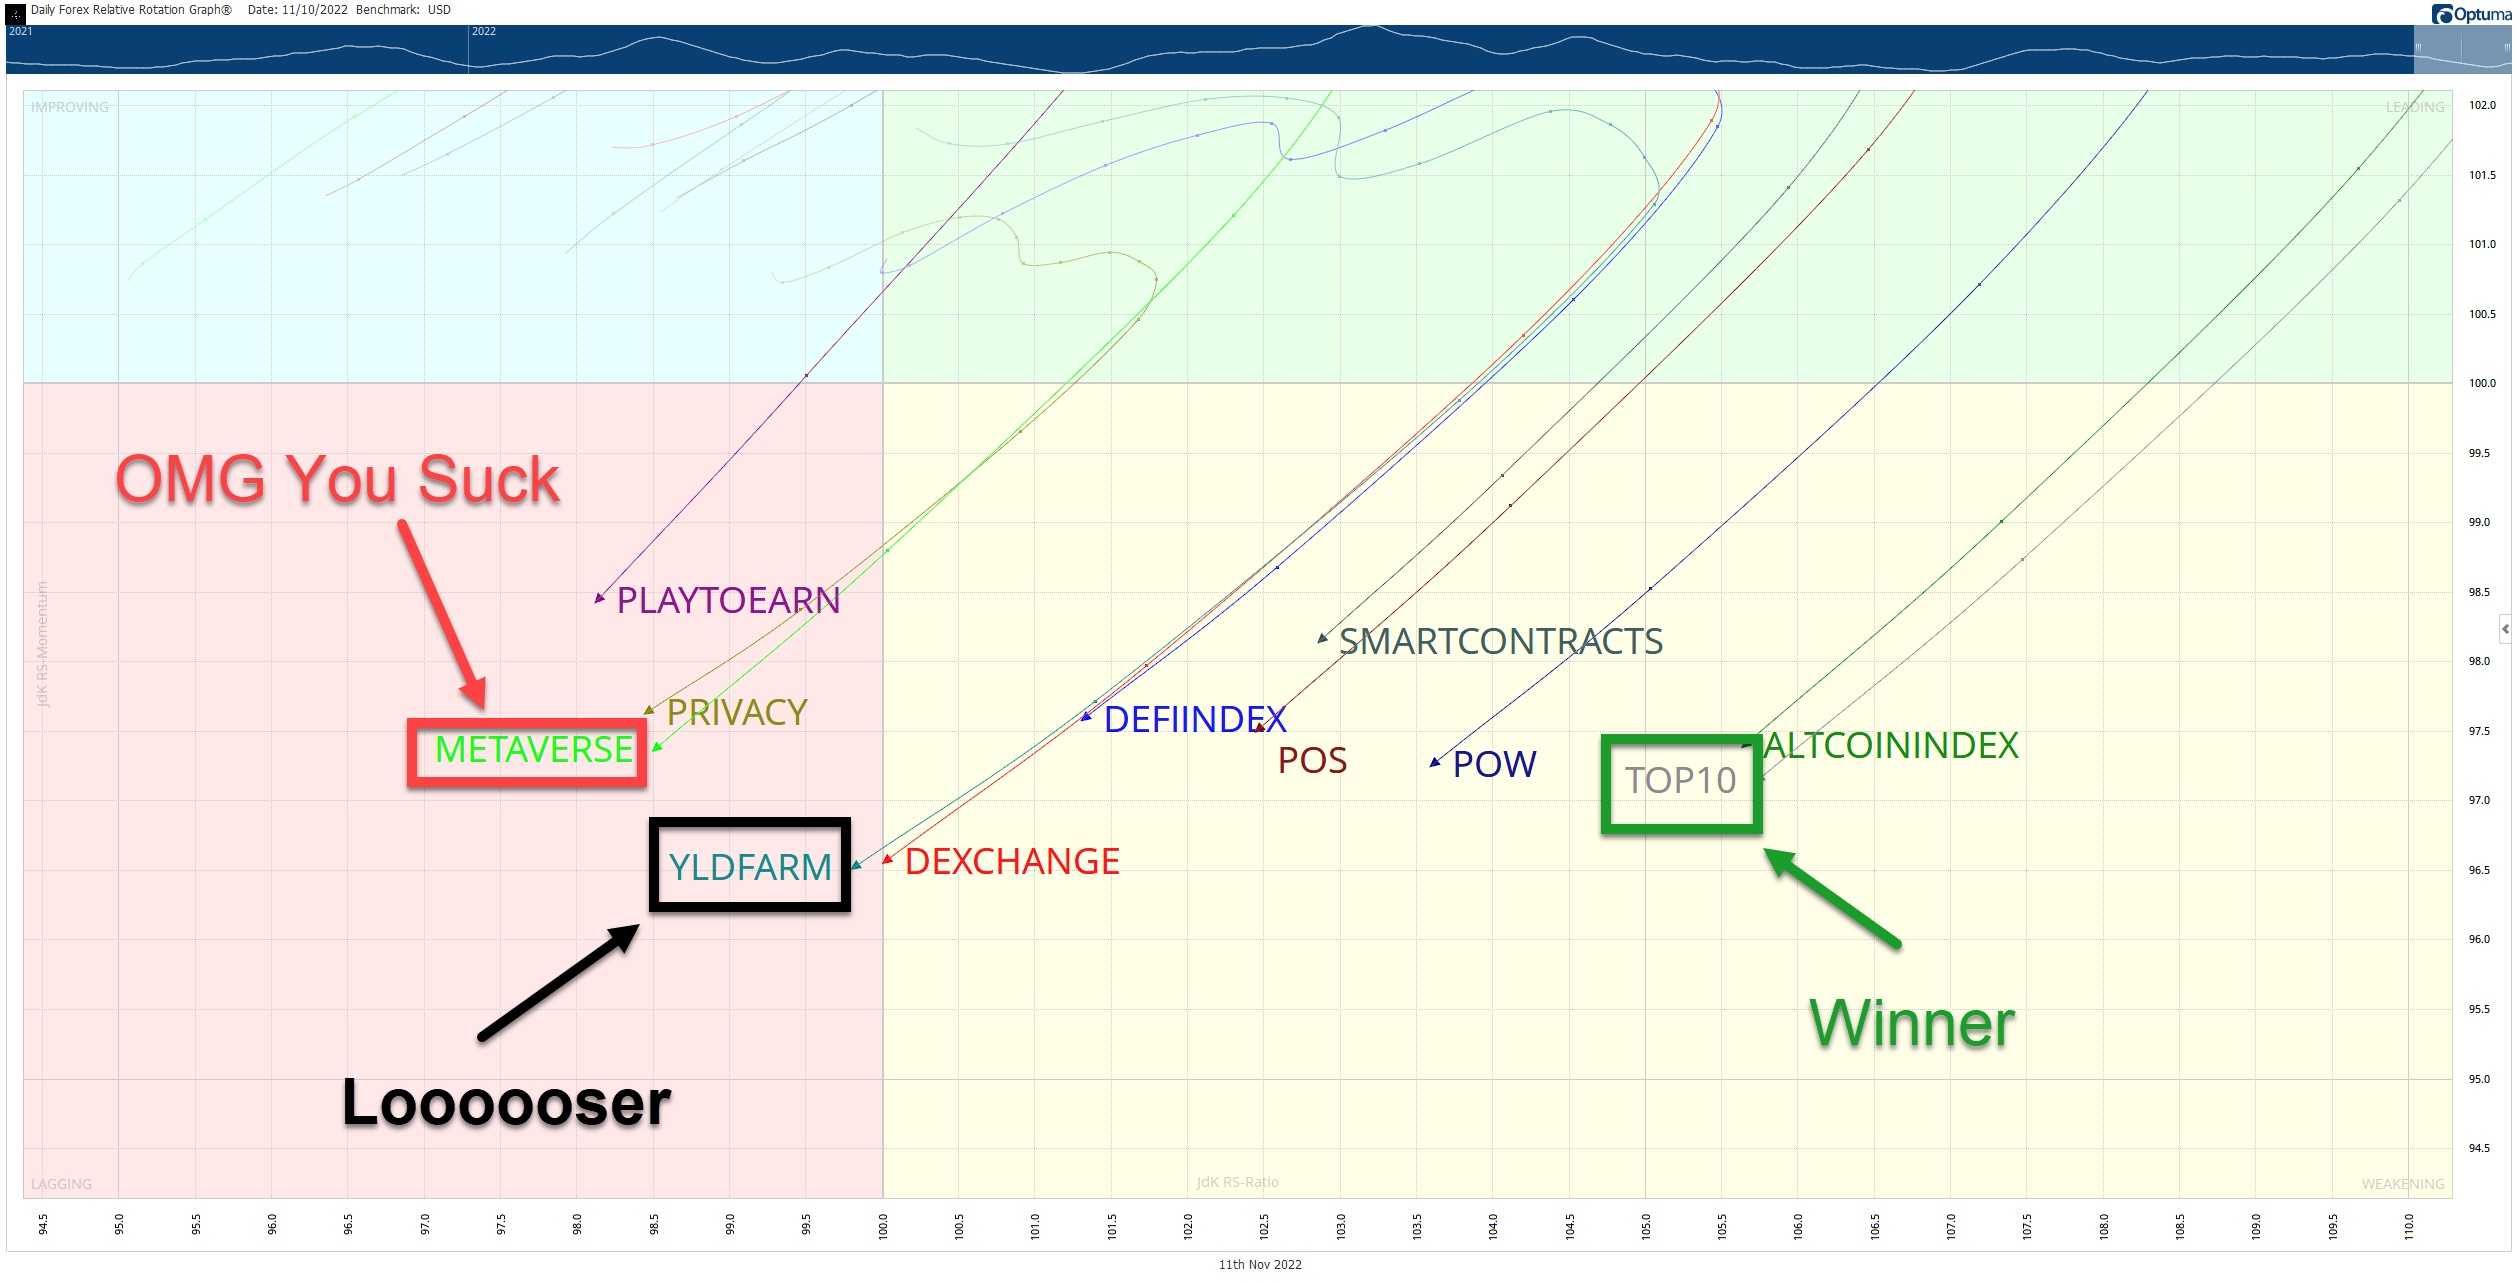
Relative Rotation Graphs (RRG) are useful visual tools to identify how an instrument or a sector performs against a benchmark. The RRG image below shows eleven customized crypto indices. Each contains the top ten by market cap (excluding stablecoins and some exchange-based tokens).
The indices are Altcoins, DeFi, Decentralized Exchanges, Metaverse, Play-To-Earn, Proof-Of-Work, Privacy, Smart Contracts, Top 10 Market Cap, and Yield Farming.
 Without going into the nitty-gritty details, the four colored sectors can be thought of like this, so imagine you’re in a race:
- Leading Quadrant (green) – You are in 1st, 2nd, or 3rd place. You are leading the pack. You’re going to medal. Anthems will be sung, tears will fall, and you may or may not pass a doping test.
- Weakening Quadrant (yellow) – You’re losing your momentum; you’re out of breath. You just realized that your spouse or your mom didn’t show up to watch you, sapping your enthusiasm. You’re falling back and in the middle of the pack.
- Lagging Quadrant (red) – You pulled a hamstring. You pulled a Michael Scott and ate five pounds of fettuccine alfredo an hour before your race. You fell down. You’re dead last. No anthems will be sung, but tears will fall, and no one will remember your name.
- Improving Quadrant (blue) – You see your spouse or your mom in the stands. The crowd starts to see you get up. Emotional music begins, and the camera pans to the crowd standing in slow motion. You’re back on your feet and back in the middle of the pack, gaining on the leaders.
So, who sucks, who is losing and who is winning? Let’s look.
Winner – Top 10 Index
Top 10 Index examples: Bitcoin ($BTC.X), Ethereum ($ETH.X), and Polygon ($MATIC.X)
Not a huge surprise here. The Top 10 Index continues to take the lead – but barely. The Altcoin Index is close behind, and really, it’s a toss-up between the two.
OMG You Suck – Metaverse Index
Metaverse Index examples: ApeCoin ($APE.X), Zilliqa ($ZIL.X), and WAX ($WAX.X)
Just like Meta ($META), the Metaverse Index is the big laggard and has fallen the fastest with the momentum that suggests it may continue to nose dive.
Loooooser – Yield Farming Index
Yield Farming Index examples: AAVE ($AAVE.X), Compound ($COMP.X), and Uniswap ($UNI.X)
The Yield Farming Index is the biggest laggard and worst performer. However, its fall wasn’t dramatic it mostly just slid into the biggest loser category as opposed to flopping into it as the Metaverse Index did. 🏎️