A look at $BTC.X‘s price chart only shows part of a picture that describes how beaten down it is. Other perspectives show how really beaten down it is.
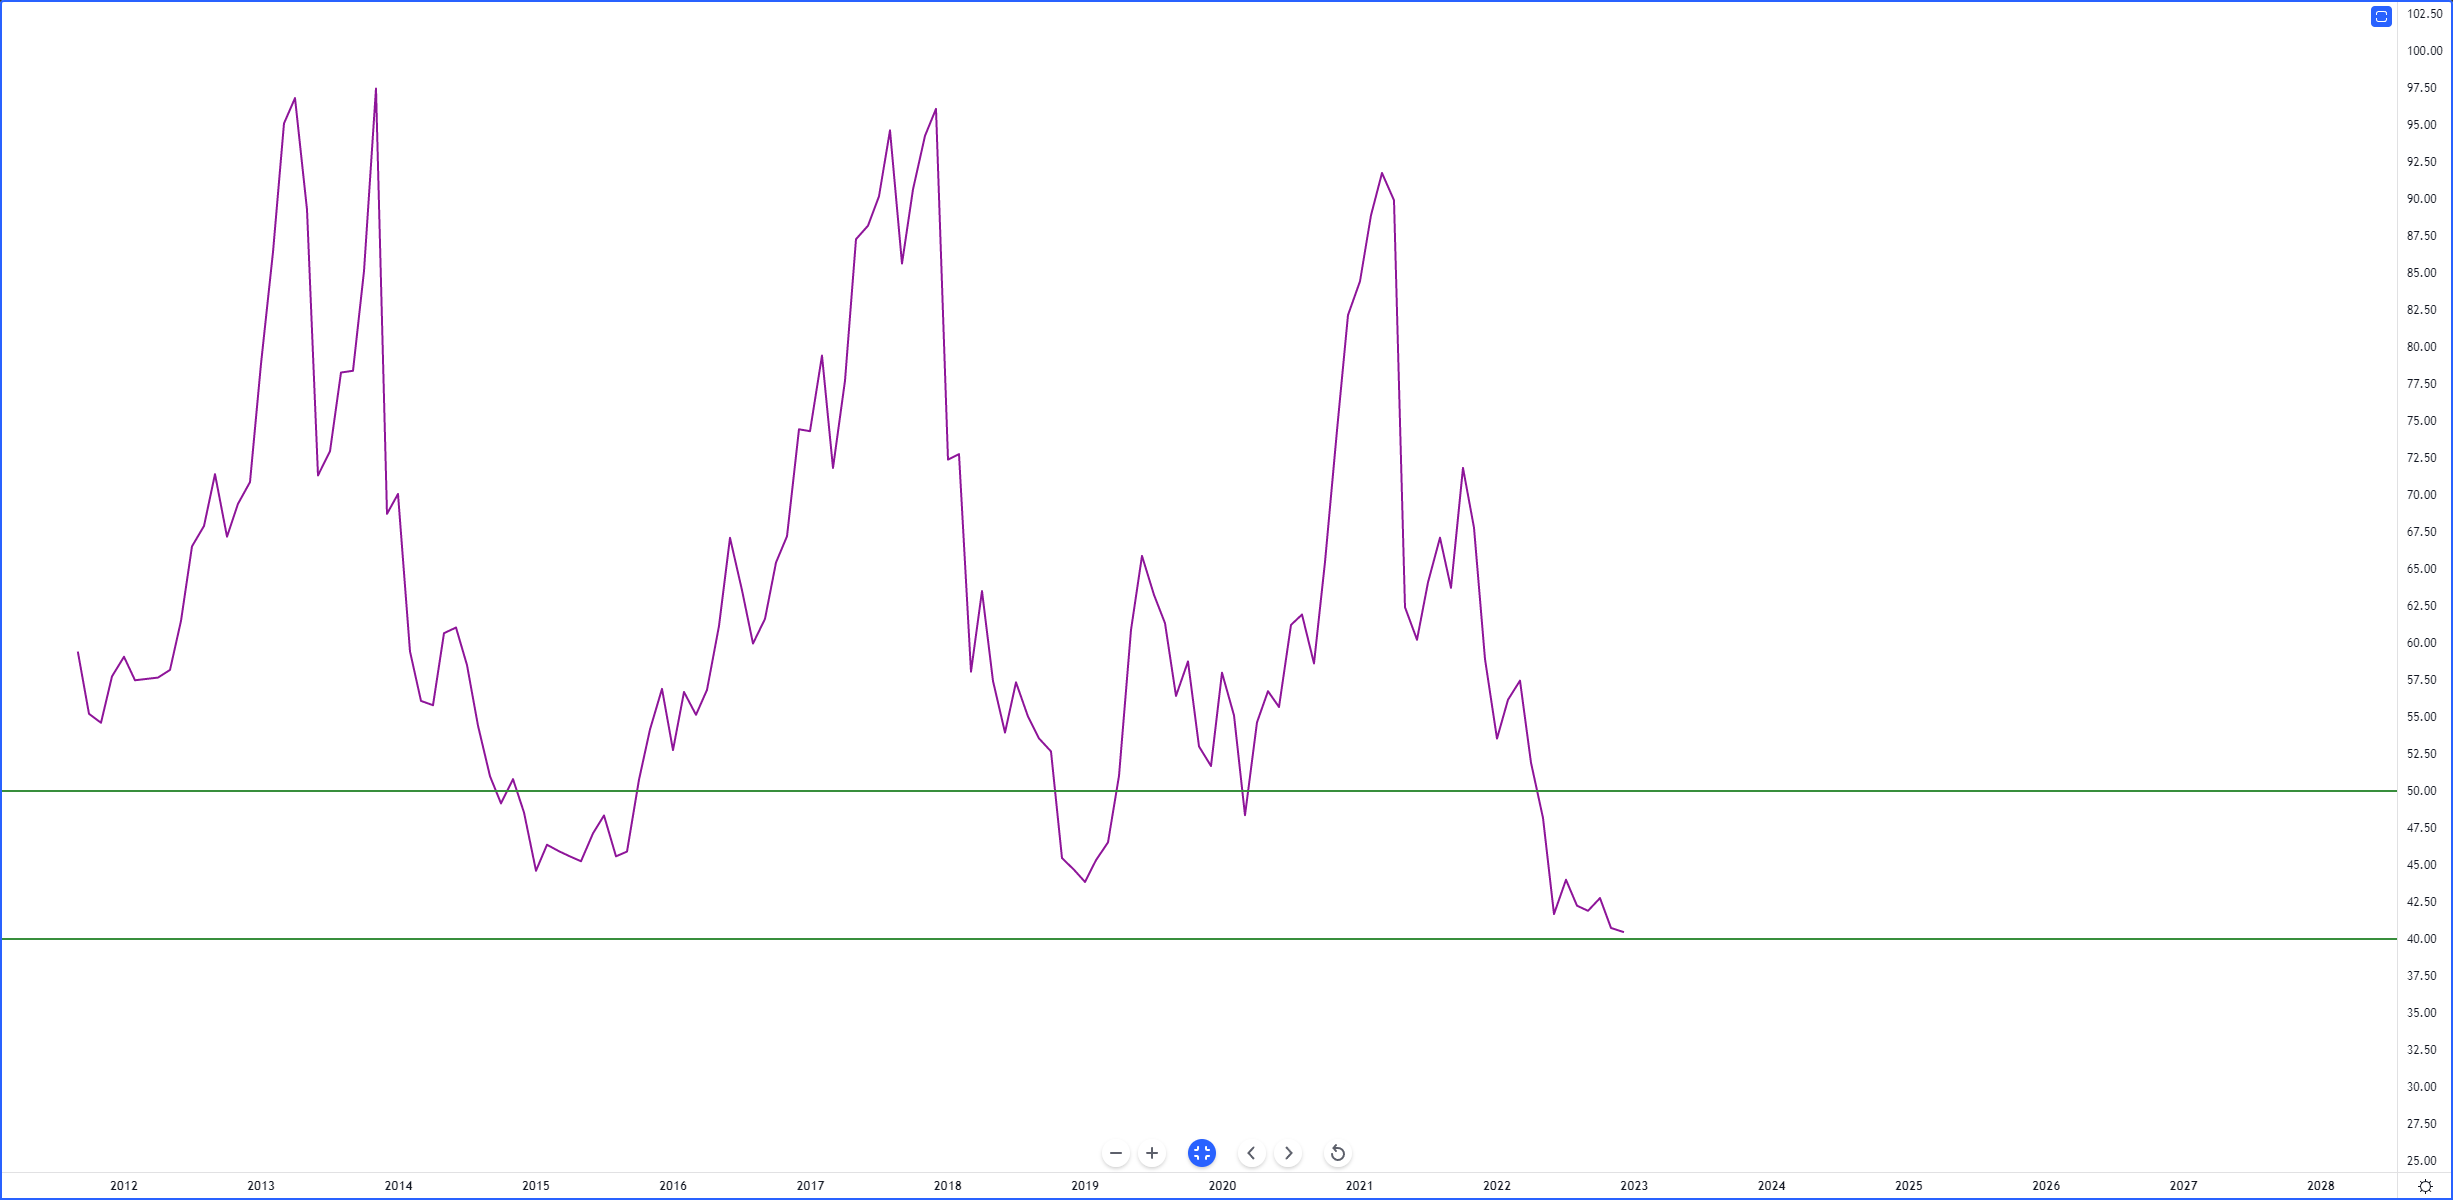
Monthly Relative Strength Index (RSI)
In a nutshell, the RSI is a momentum indicator used by analysts and traders to interpret how over-bought or over-sold an instrument is.
On Bitcoin’s monthly chart, the RSI value isn’t as important as what the current monthly RSI value represents: an all-time low. This is the lowest Bitcoin’s monthly RSI has ever been.
Big Gaps
In the image below, the only thing you need to focus on is the space between the bodies of the candlesticks and the Tenkan-Sen. A gray/black blob represents the space to focus on.
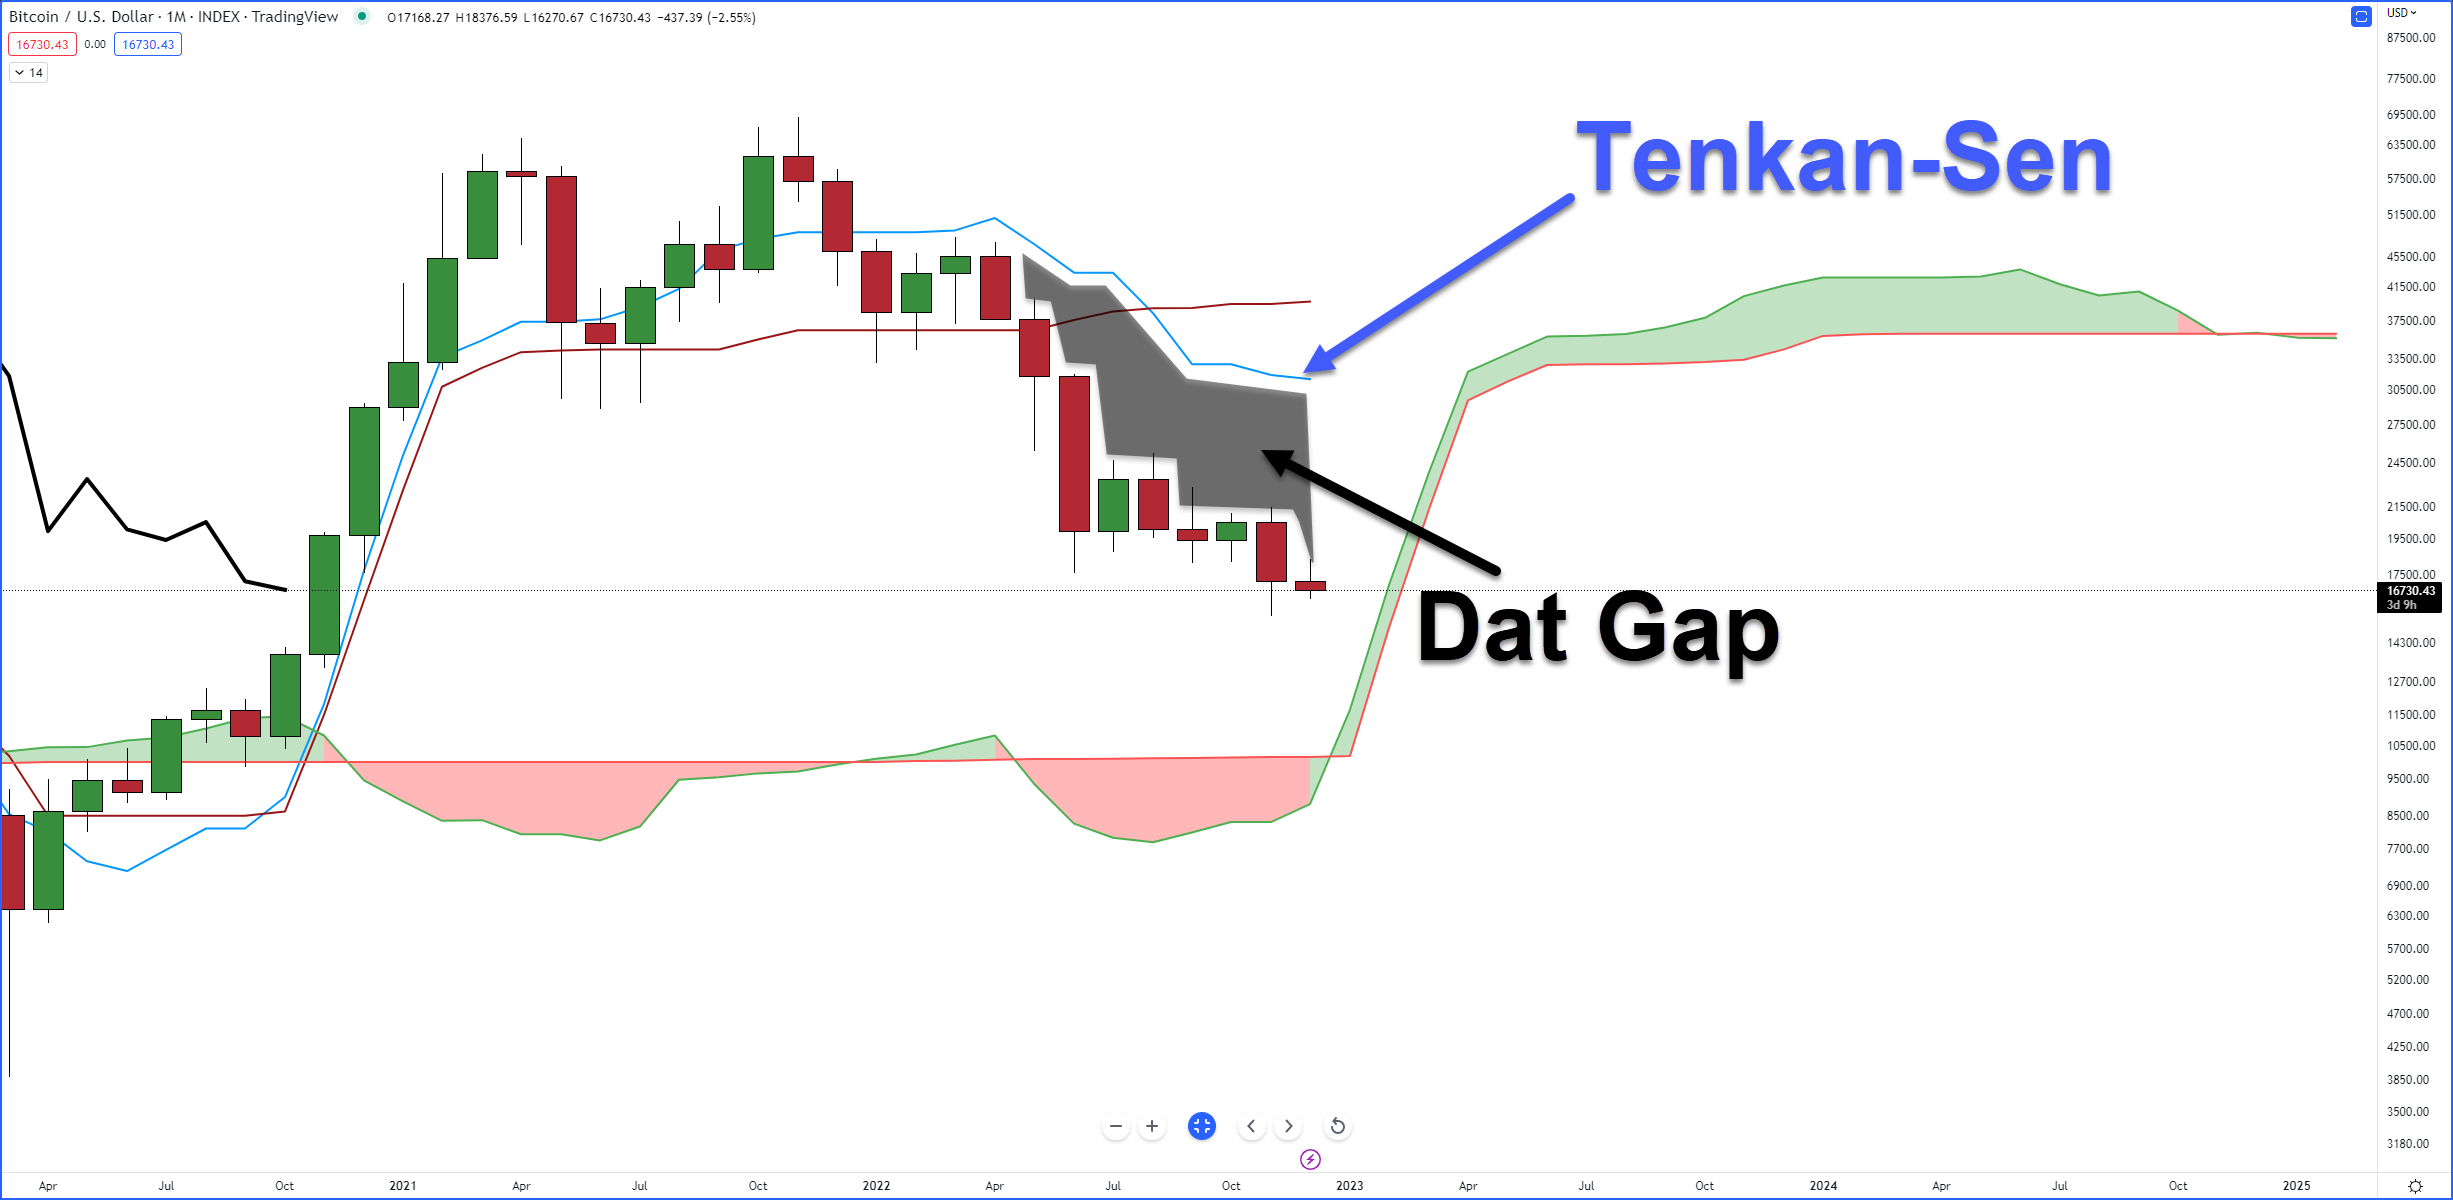
Gaps between the bodies of candlesticks and the Tenkan-Sen don’t last long and often correct within four to five periods.
The current stretch of seven candlesticks of significant gaps is a record for Bitcoin. 🤯