How many of you were freaking out about yesterday’s day of red? Probably everyone. 😱
Spend any time in a bear market, and you get suspicious of any pump and view every dump as the end of the world.
But looking at the charts shows a lot of support and bouncing has been happening.
Altcoin Market Cap
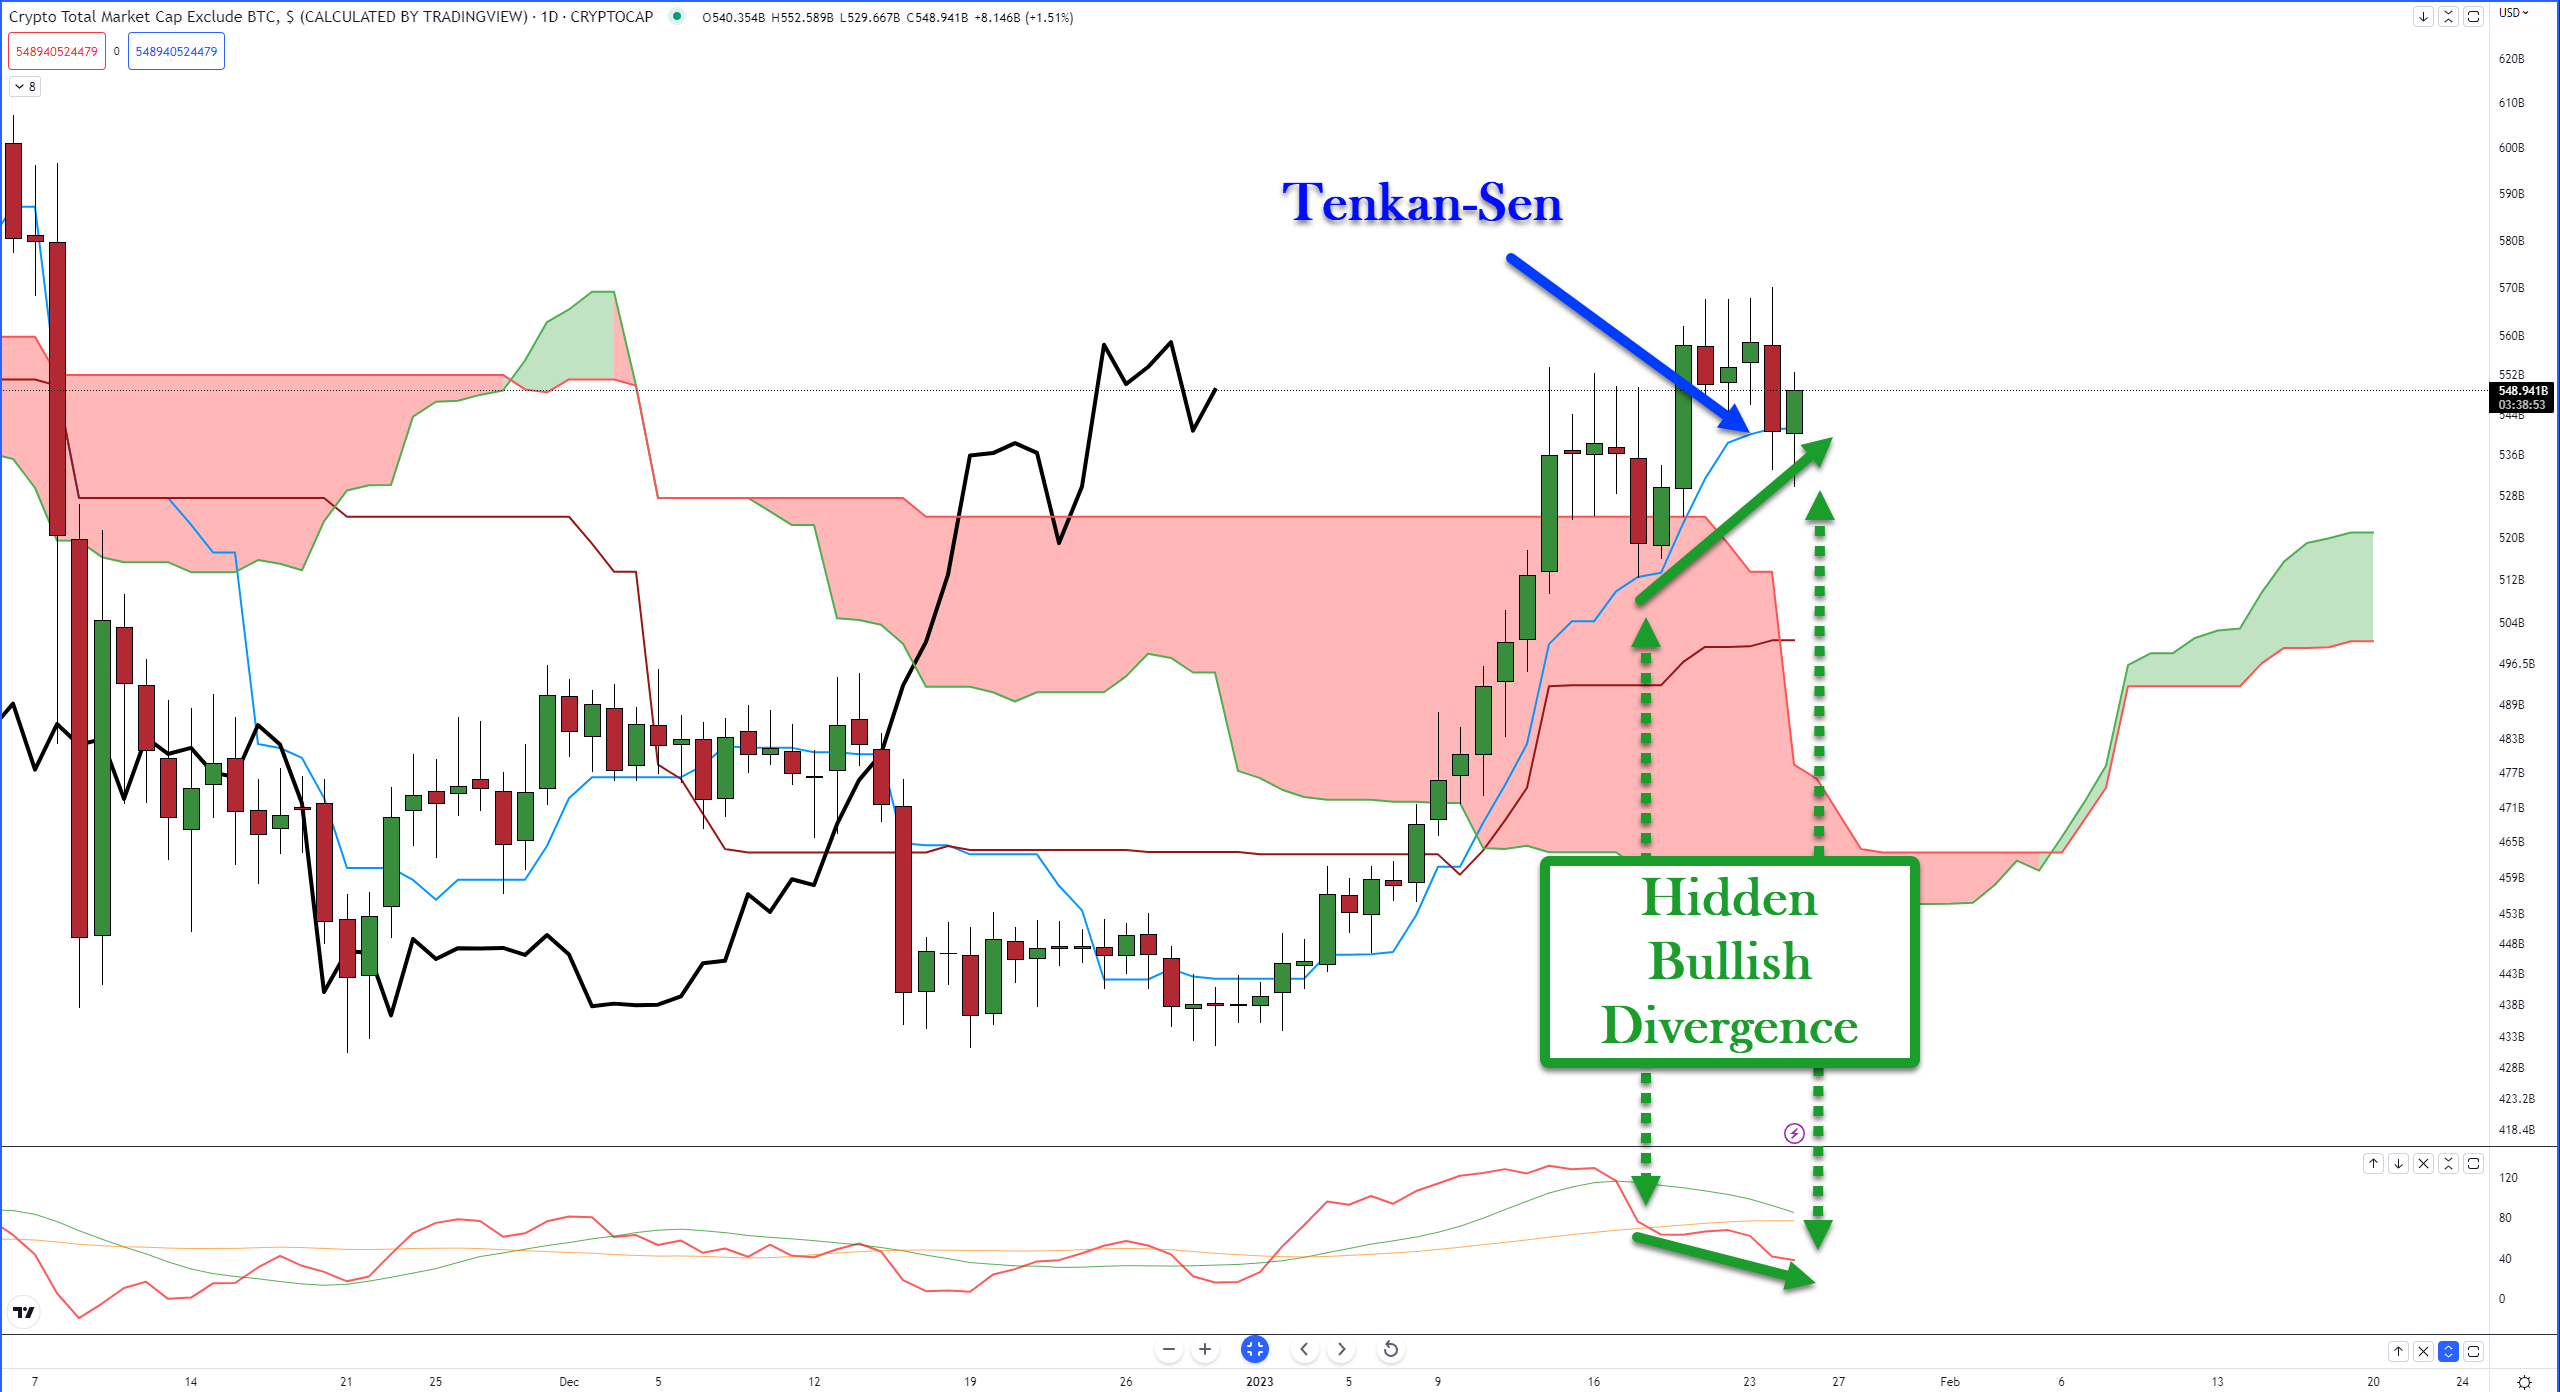
The first chart showing a bounce is the Total Altcoin Market Cap chart. Yesterday’s close was right on top of the Tenkan-Sen, but today it opened below that same level.
After pushing lower during the intraday session and hitting a new six-day low, bulls came back and have kept the Altcoin Market Cap above the Tenkan-Sen – so far.
The hidden bullish divergence between the candlestick chart and the Composite Index certainly has given bulls some hope – but they’ll have to show some follow-through, or the bears may easily take over.
Cosmos
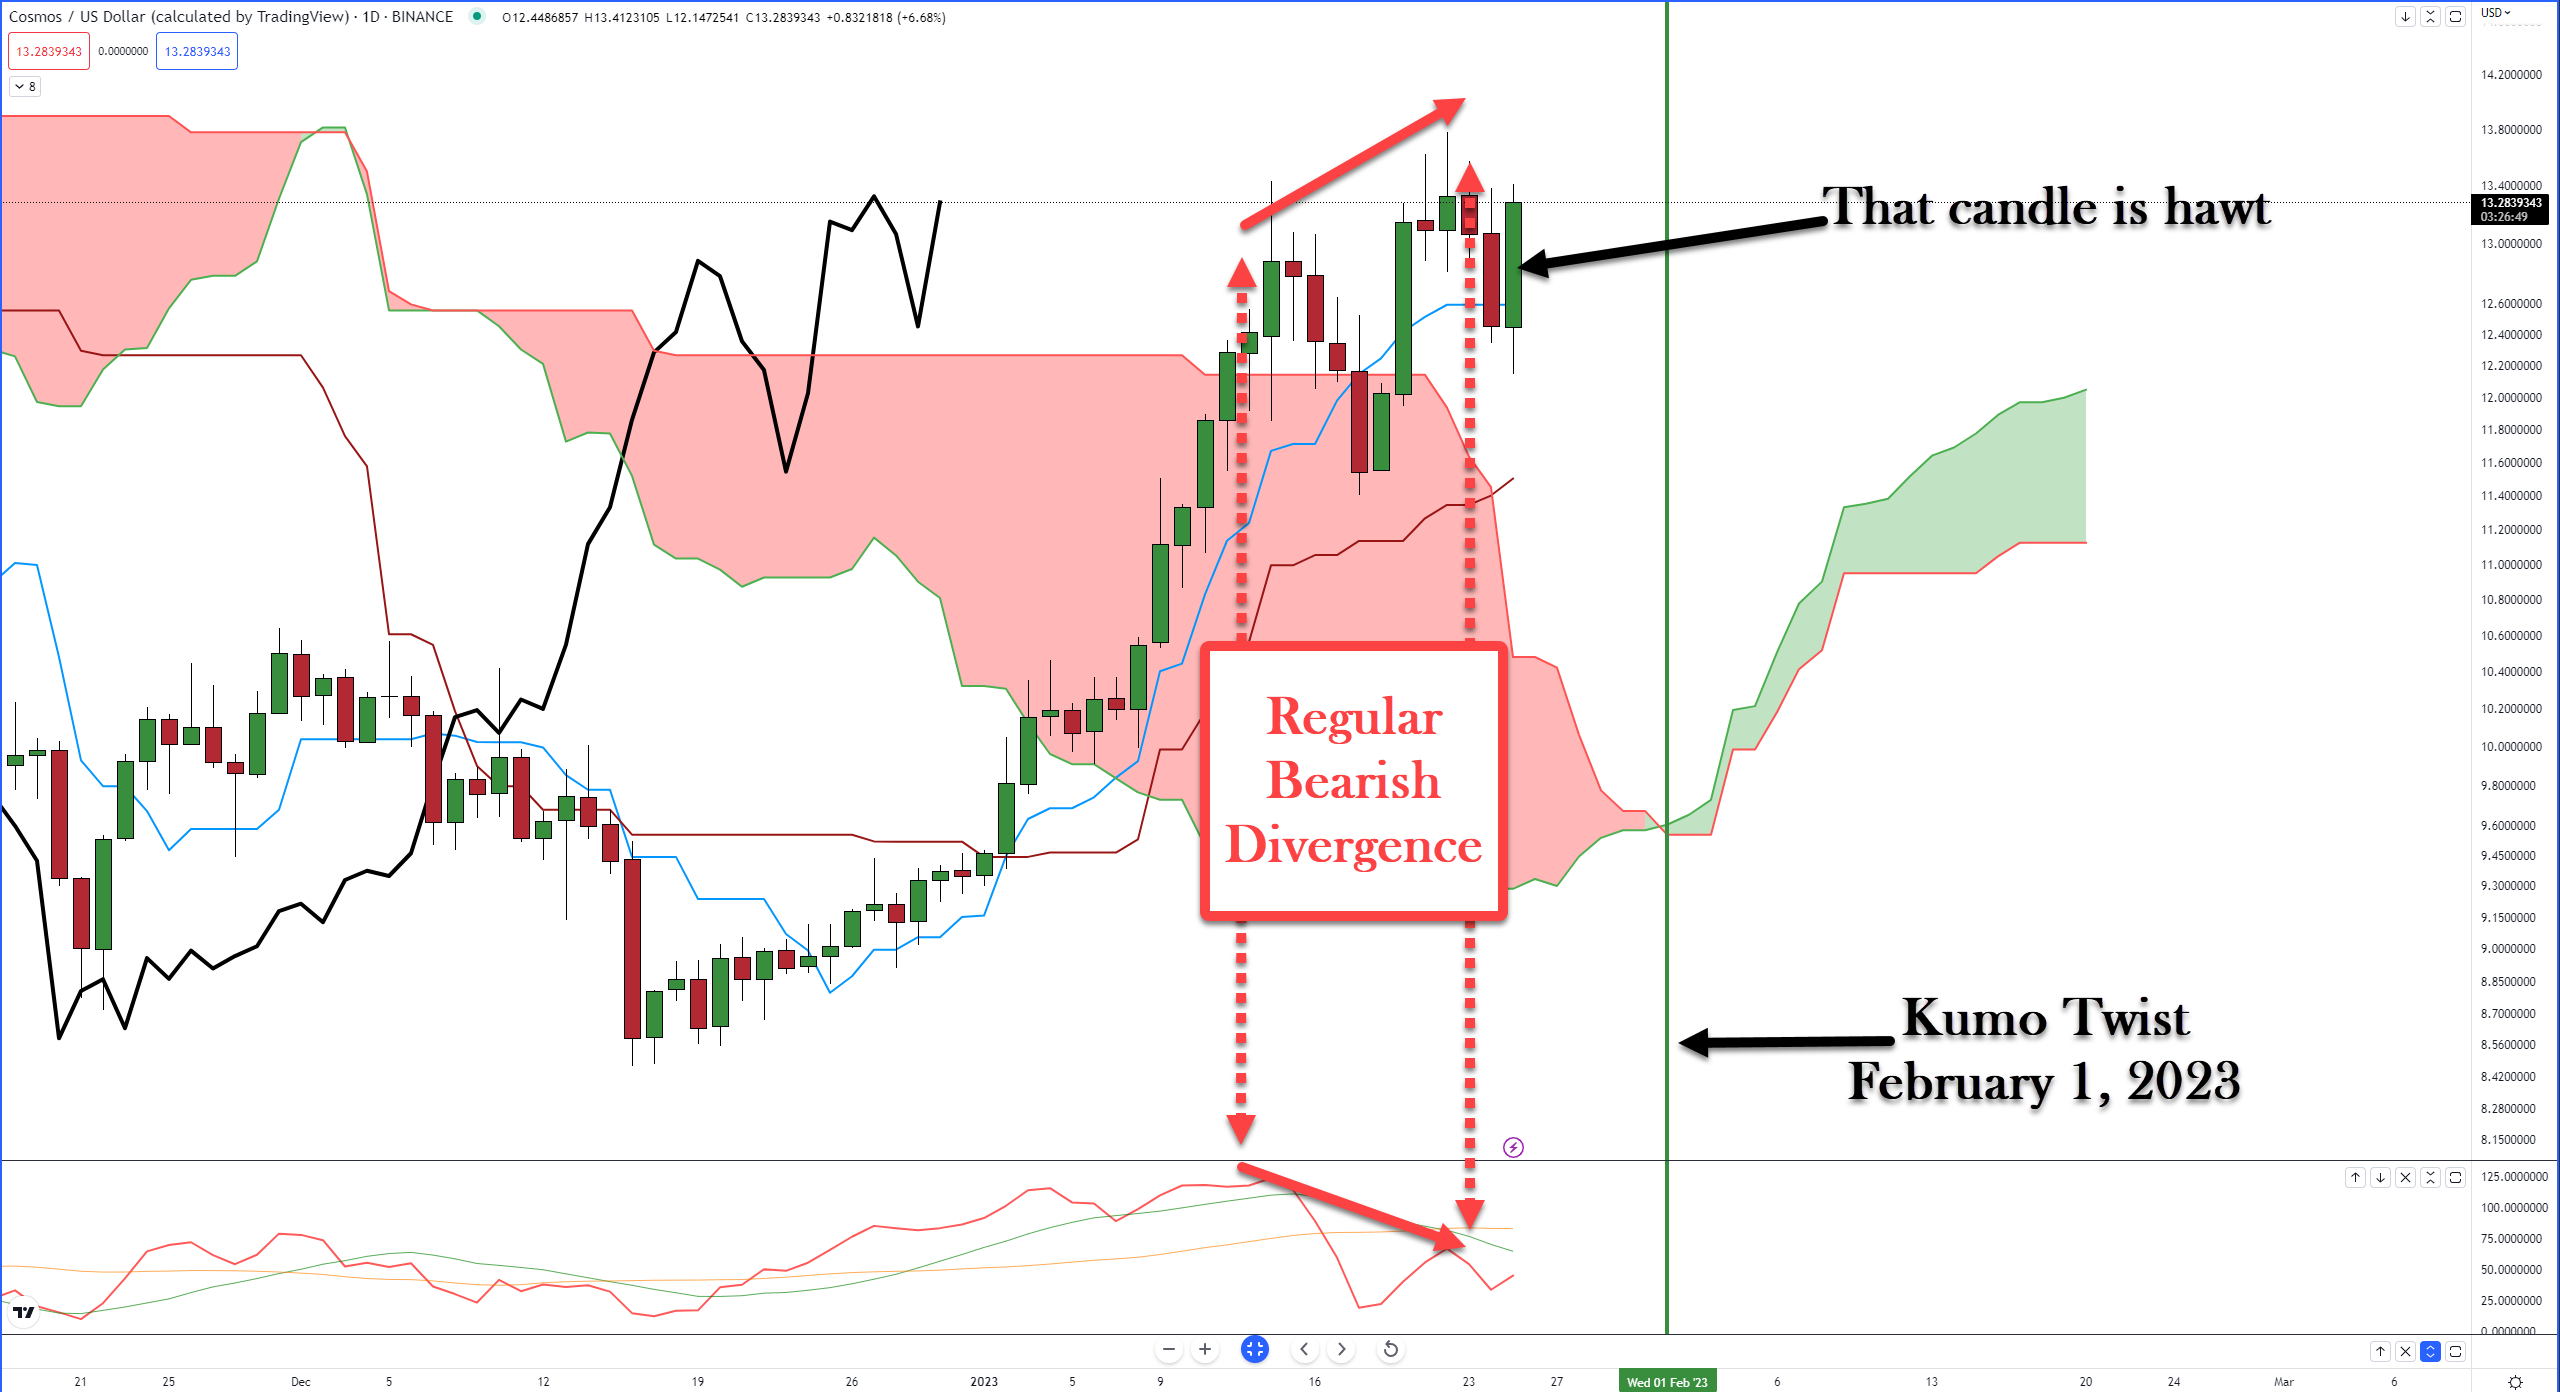
Yesterday’s price action could have been one nasty bear trap for anyone shorting $ATOM.X.
The close below the Tenkan-Sen yesterday, in combination with the regular bearish divergence between the candlestick chart and the Composite Index, no doubt looked like a great opportunity to either take profit or go short, according to analysts.
However, a look at today’s price action is the equivalent of a bitch slap to any bear. Bullish analysts and traders see the current daily candlestick developing into one of the hawt-est bullish candlestick patterns there is: the bullish engulfing candlestick.
If bulls keep the momentum up and the bullish engulfing candle is confirmed, analysts see continued movement higher for Cosmos.
Hedera Hashgraph
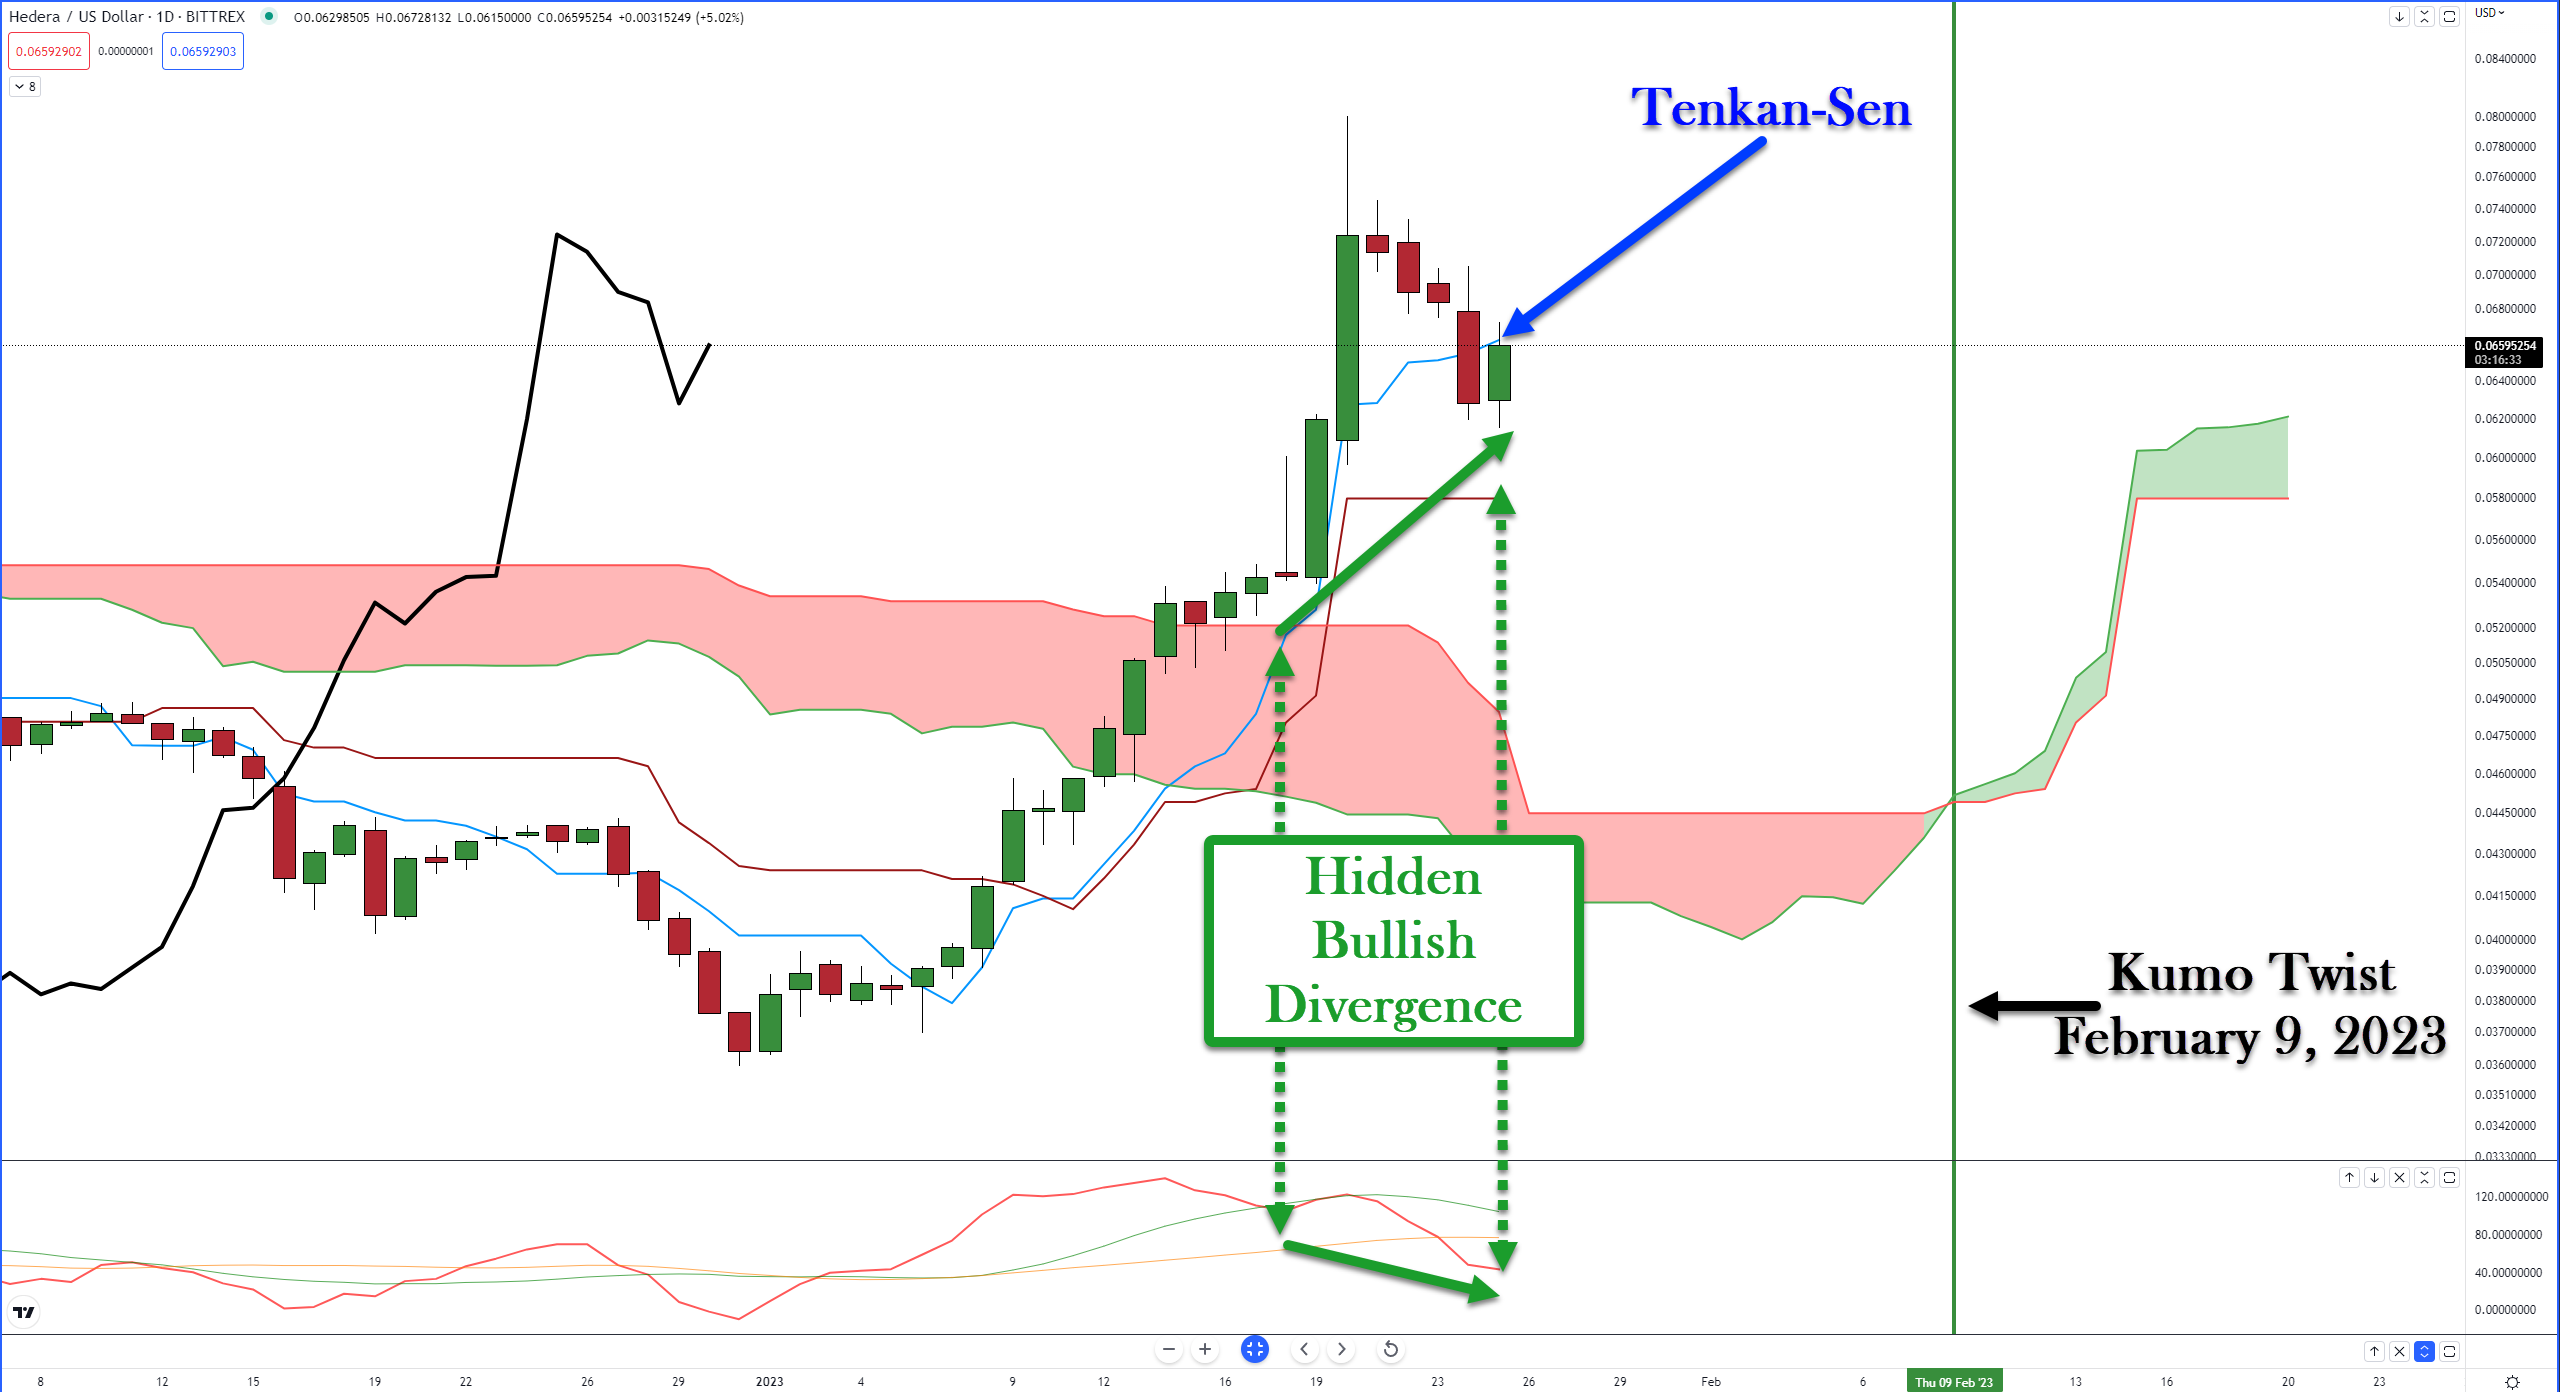
While the Altcoin Market Cap and Cosmos charts look bullish, $HBAR.X falls into the ‘iffy’ category.
Hedera’s chart is iffy because it’s still below the Tenkan-Sen. And many altcoins today look like Hedera’s: off of its daily lows but showing clear signs of struggling to move above the Tenkan-Sen.
Algorand
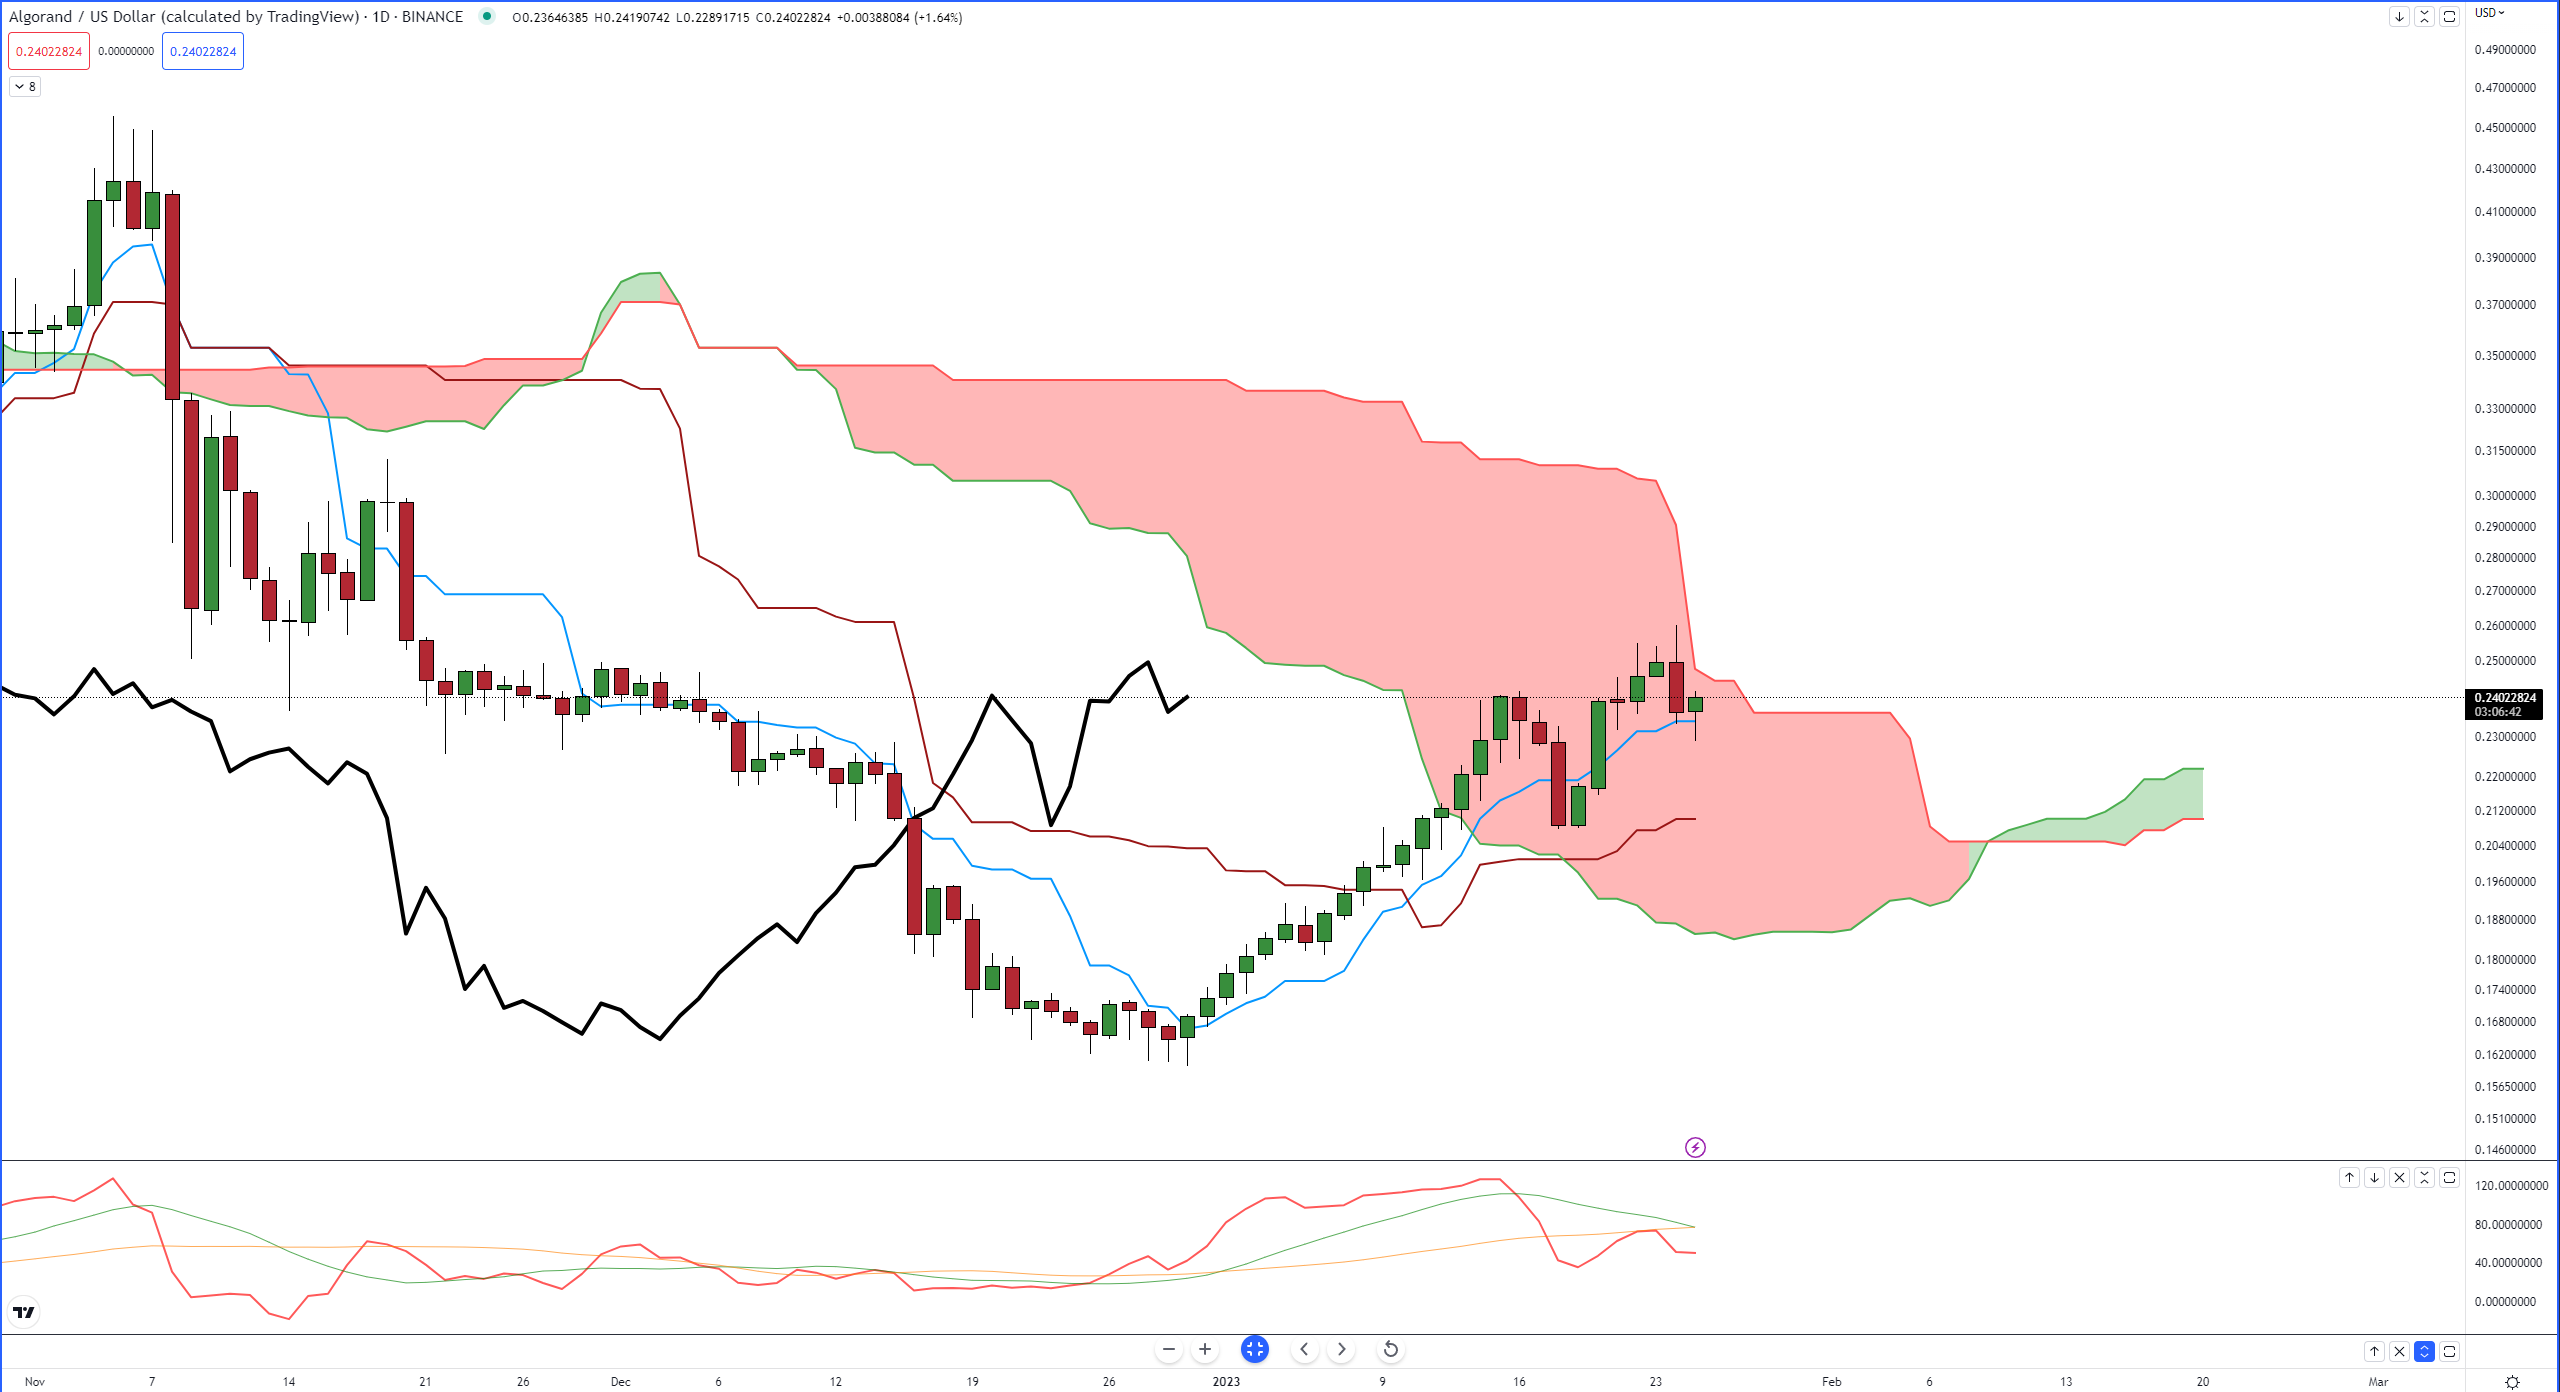
If one chunk of the crypto market’s daily chart looks like Cosmos’s and another chunk looks like Hedera’s, there’s another smaller chunk that looks like $ALGO.X‘s.
What’s the key takeaway from Algorand’s daily chart above?
It’s stuck inside the Cloud – the place where trading accounts go to die.
A good amount of the altcoin market has yet to break out above their respective Cloud.
Putting It All Together
If the crypto market behaves the same as it has in past corrective moves or trend changes, then it’s normal to see instruments like $BTC.X, $ETH.X, and Cosmos ping-pong around if they broke out above the Cloud first.
It’s like they’re waiting for the rest of the market for instruments like Algorand to play catchup before any further big moves occur.
Let’s see what happens! 👍