January 2023 was the best month for Bitcoin (and the broader crypto market) in over 15 months. 👍
How have previous Januarys faired?
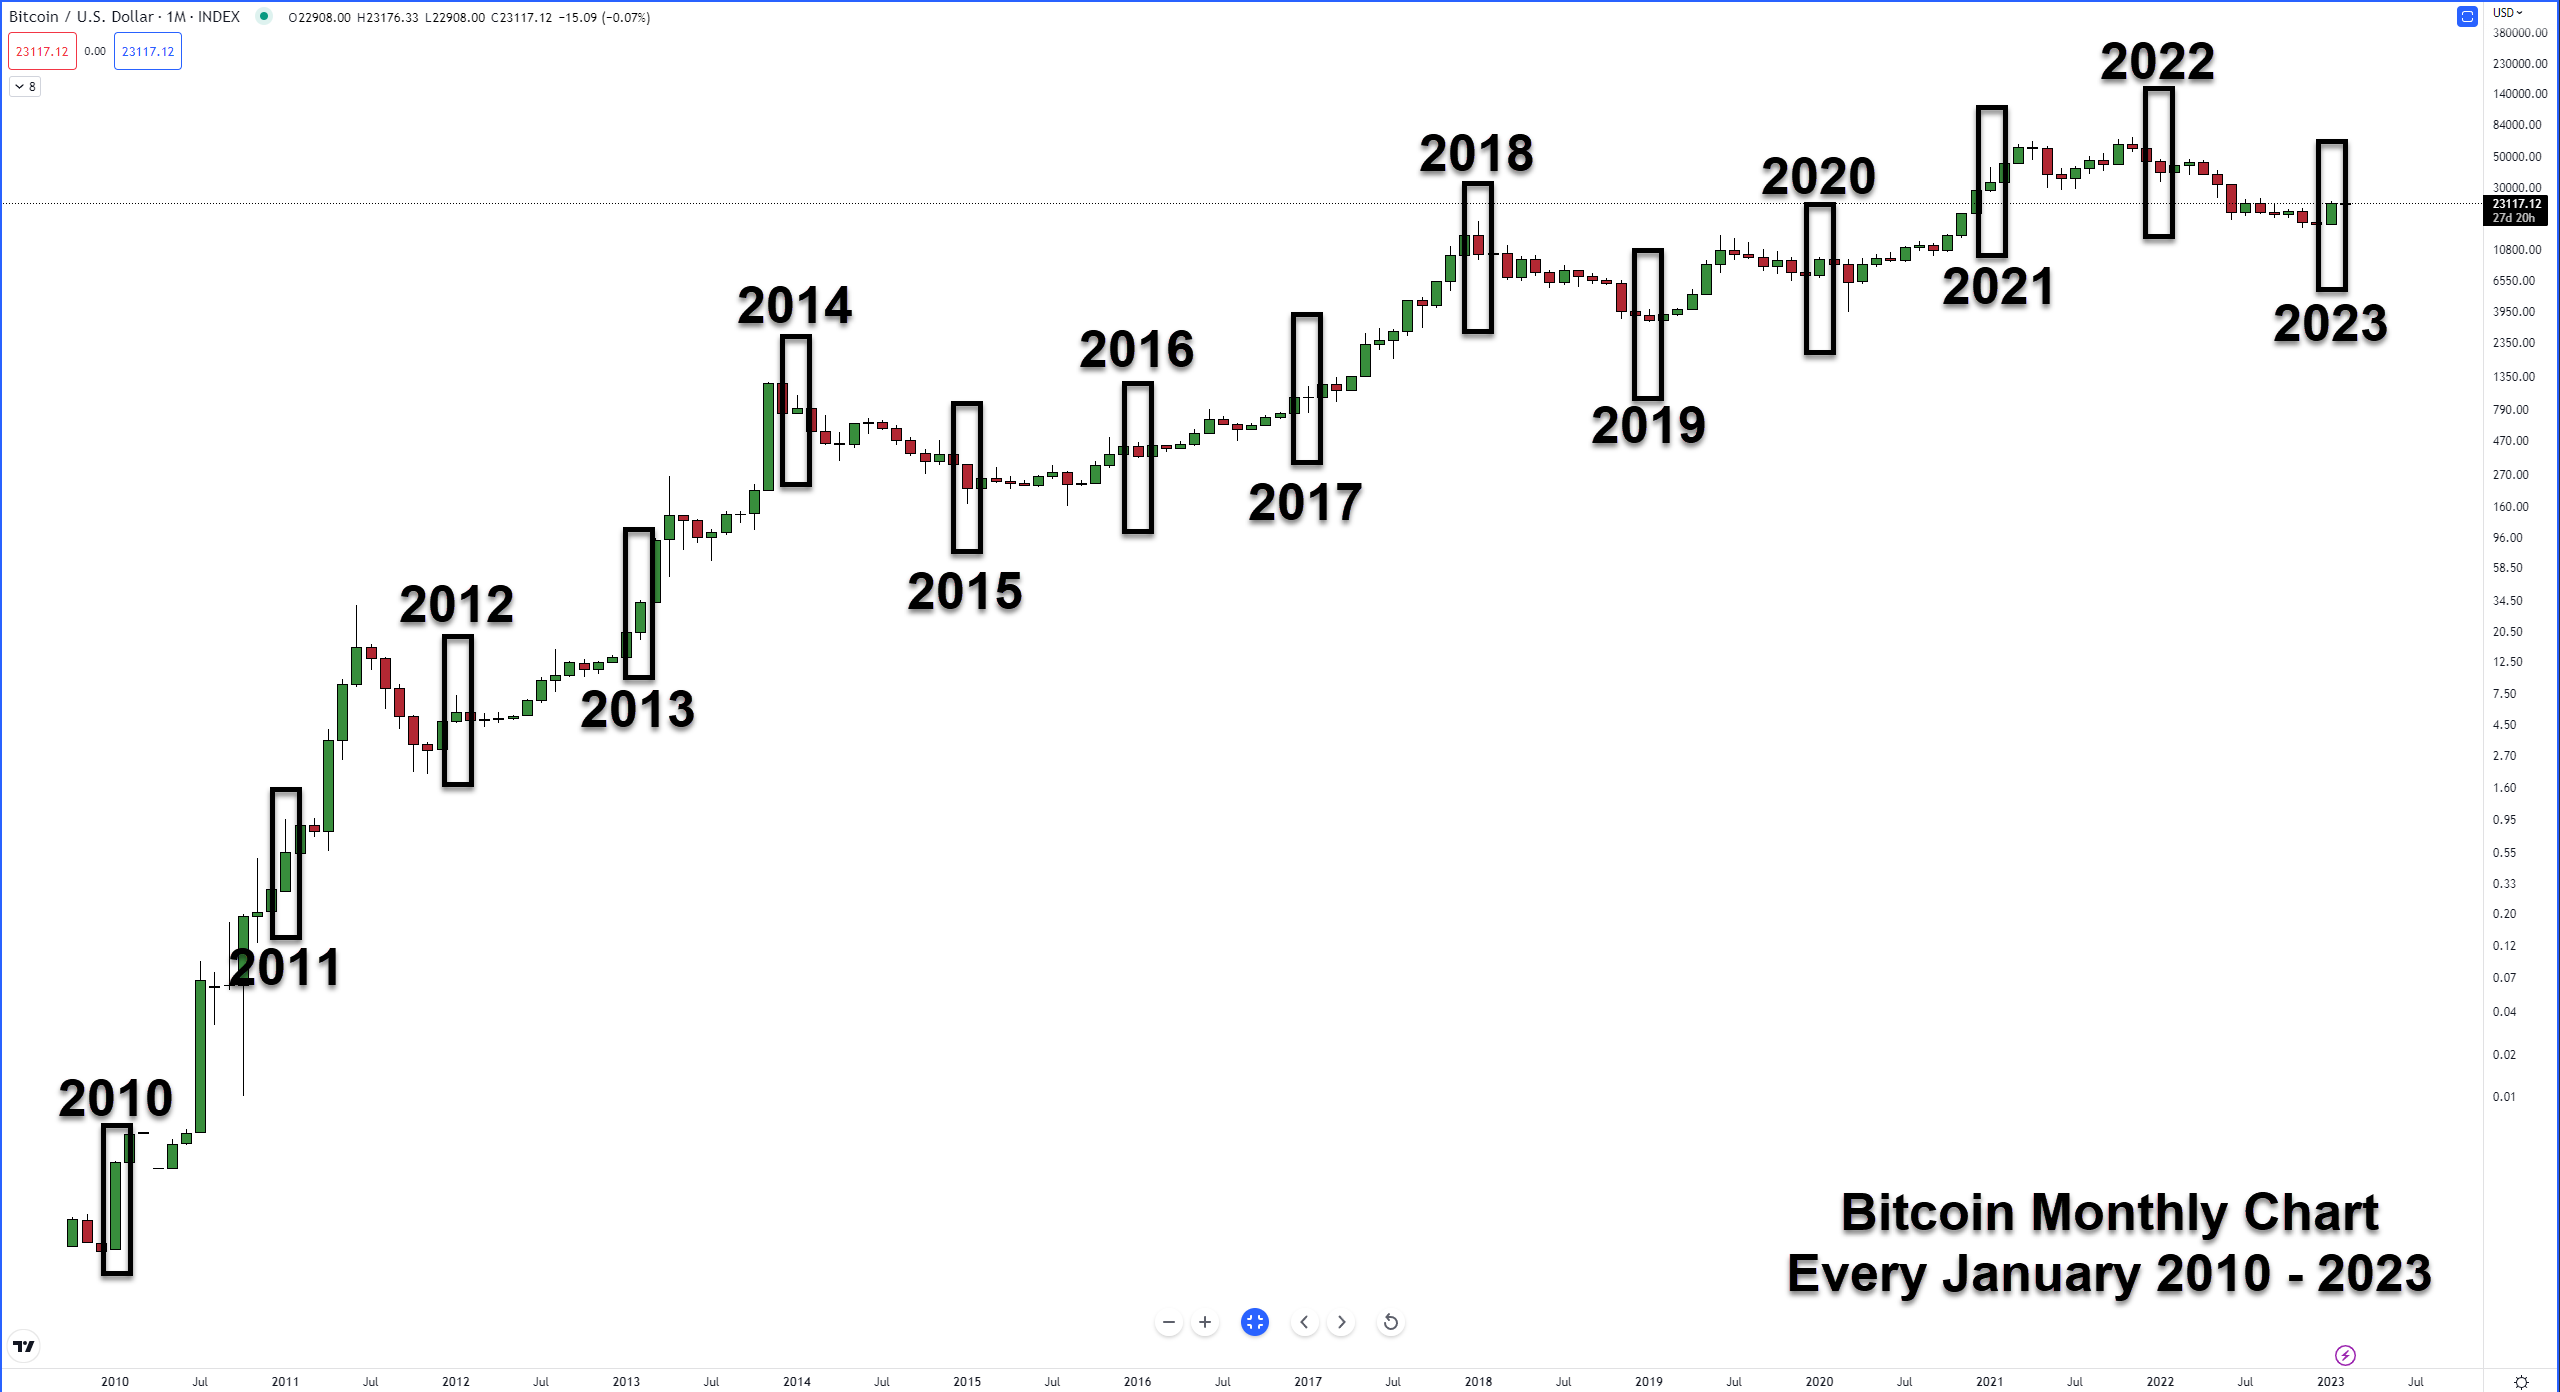
Let’s take a look at all of the Januarys Bitcoin has traded in going back to 2010:
- Jan 2010 +378.85%
- Jan 2011 +83.33%
- Jan 2012 +16.13%
- Jan 2013 +7.52%
- Jan 2014 +8.92%
- Jan 2015 -33.04%
- Jan 2016 -14.80%
- Jan 2017 -0.17%
- Jan 2018 -27.16%
- Jan 2019 +11.16%
- Jan 2020 +30.22%
- Jan 2021 +14.35%
- Jan 2022 -16.66%
- Jan 2023 +39.95%
Some key takeaways:
- 9 out of 14 January months closed in the green (64%) vs. 5 out of 14 (36%).
- Excluding January 2010, January 2023 was the second-best-performing January ever.
- January 2023’s close was the highest monthly close in 6 months.
- January 2023 was the best-performing month since October 2021. 😲
As January Goes, So Goes Stonks… And Maybe Bitcoin?
You may or may not have heard of some beliefs/theories from the stock market related to January: the January Effect and the January Barometer.
The January Effect is a belief that January is often one of the best performing for stonks (especially for small caps) – in both absolute and risk-adjusted returns, but the past 15-ish years may point to a change in that theory.
“As goes January, so goes the year.” That stock market phrase comes from a theory known as the January Barometer. 🌡️
The January Barometer is a belief that if the S&P 500 ends in the green for January, then the year will end in the green. From the 1950s to the 1980s, there was a roughly 70% correlation between a green January ending with a year in the green. After the 1980s, though, it’s now around 50-ish percent.
There are a metric crap ton of opinions on what January ‘means’ for stocks, bullish or bearish. Still, the above explanation should give you a little idea of how January is sometimes perceived in the stonk market.
Bitcoin’s existence isn’t even a blink of an eye compared to how long the stock market has existed – but have past Januaries for Bitcoin been an indicator of how the year will go? Let’s see:
- 2010 – Green January, Green Year
- 2011 – Green January, Green Year
- 2012 – Green January, Green Year
- 2013 – Green January, Green Year
- 2014 – Green January, Red Year
- 2015 – Red January, Green Year
- 2016 – Red January, Green Year
- 2017 – Red January, Green Year
- 2018 – Red January, Red Year
- 2019 – Green January, Green Year
- 2020 – Green January, Green Year
- 2021 – Green January, Green Year
- 2022 – Red January, Red Year
- A green January coincided with a green year 7 out of 8 times.
- A red January coincided with a red year 2 out of 5 times.
The limited data suggest a strong probability of a green January coinciding with a green year.
But there are two keywords in the sentence above: limited-data. Not a lot of history to go off of.
It’s anybody’s guess where crypto will end up in 2023. 🤷♂️