In the February 14, 2023, Litepaper, there was a Technically Speaking article highlighting some critical price action levels analysts were looking at.
Let’s see what’s happening after roughly two weeks have gone by. The image below is the screenshot of $ETH‘s weekly chart from February 14:
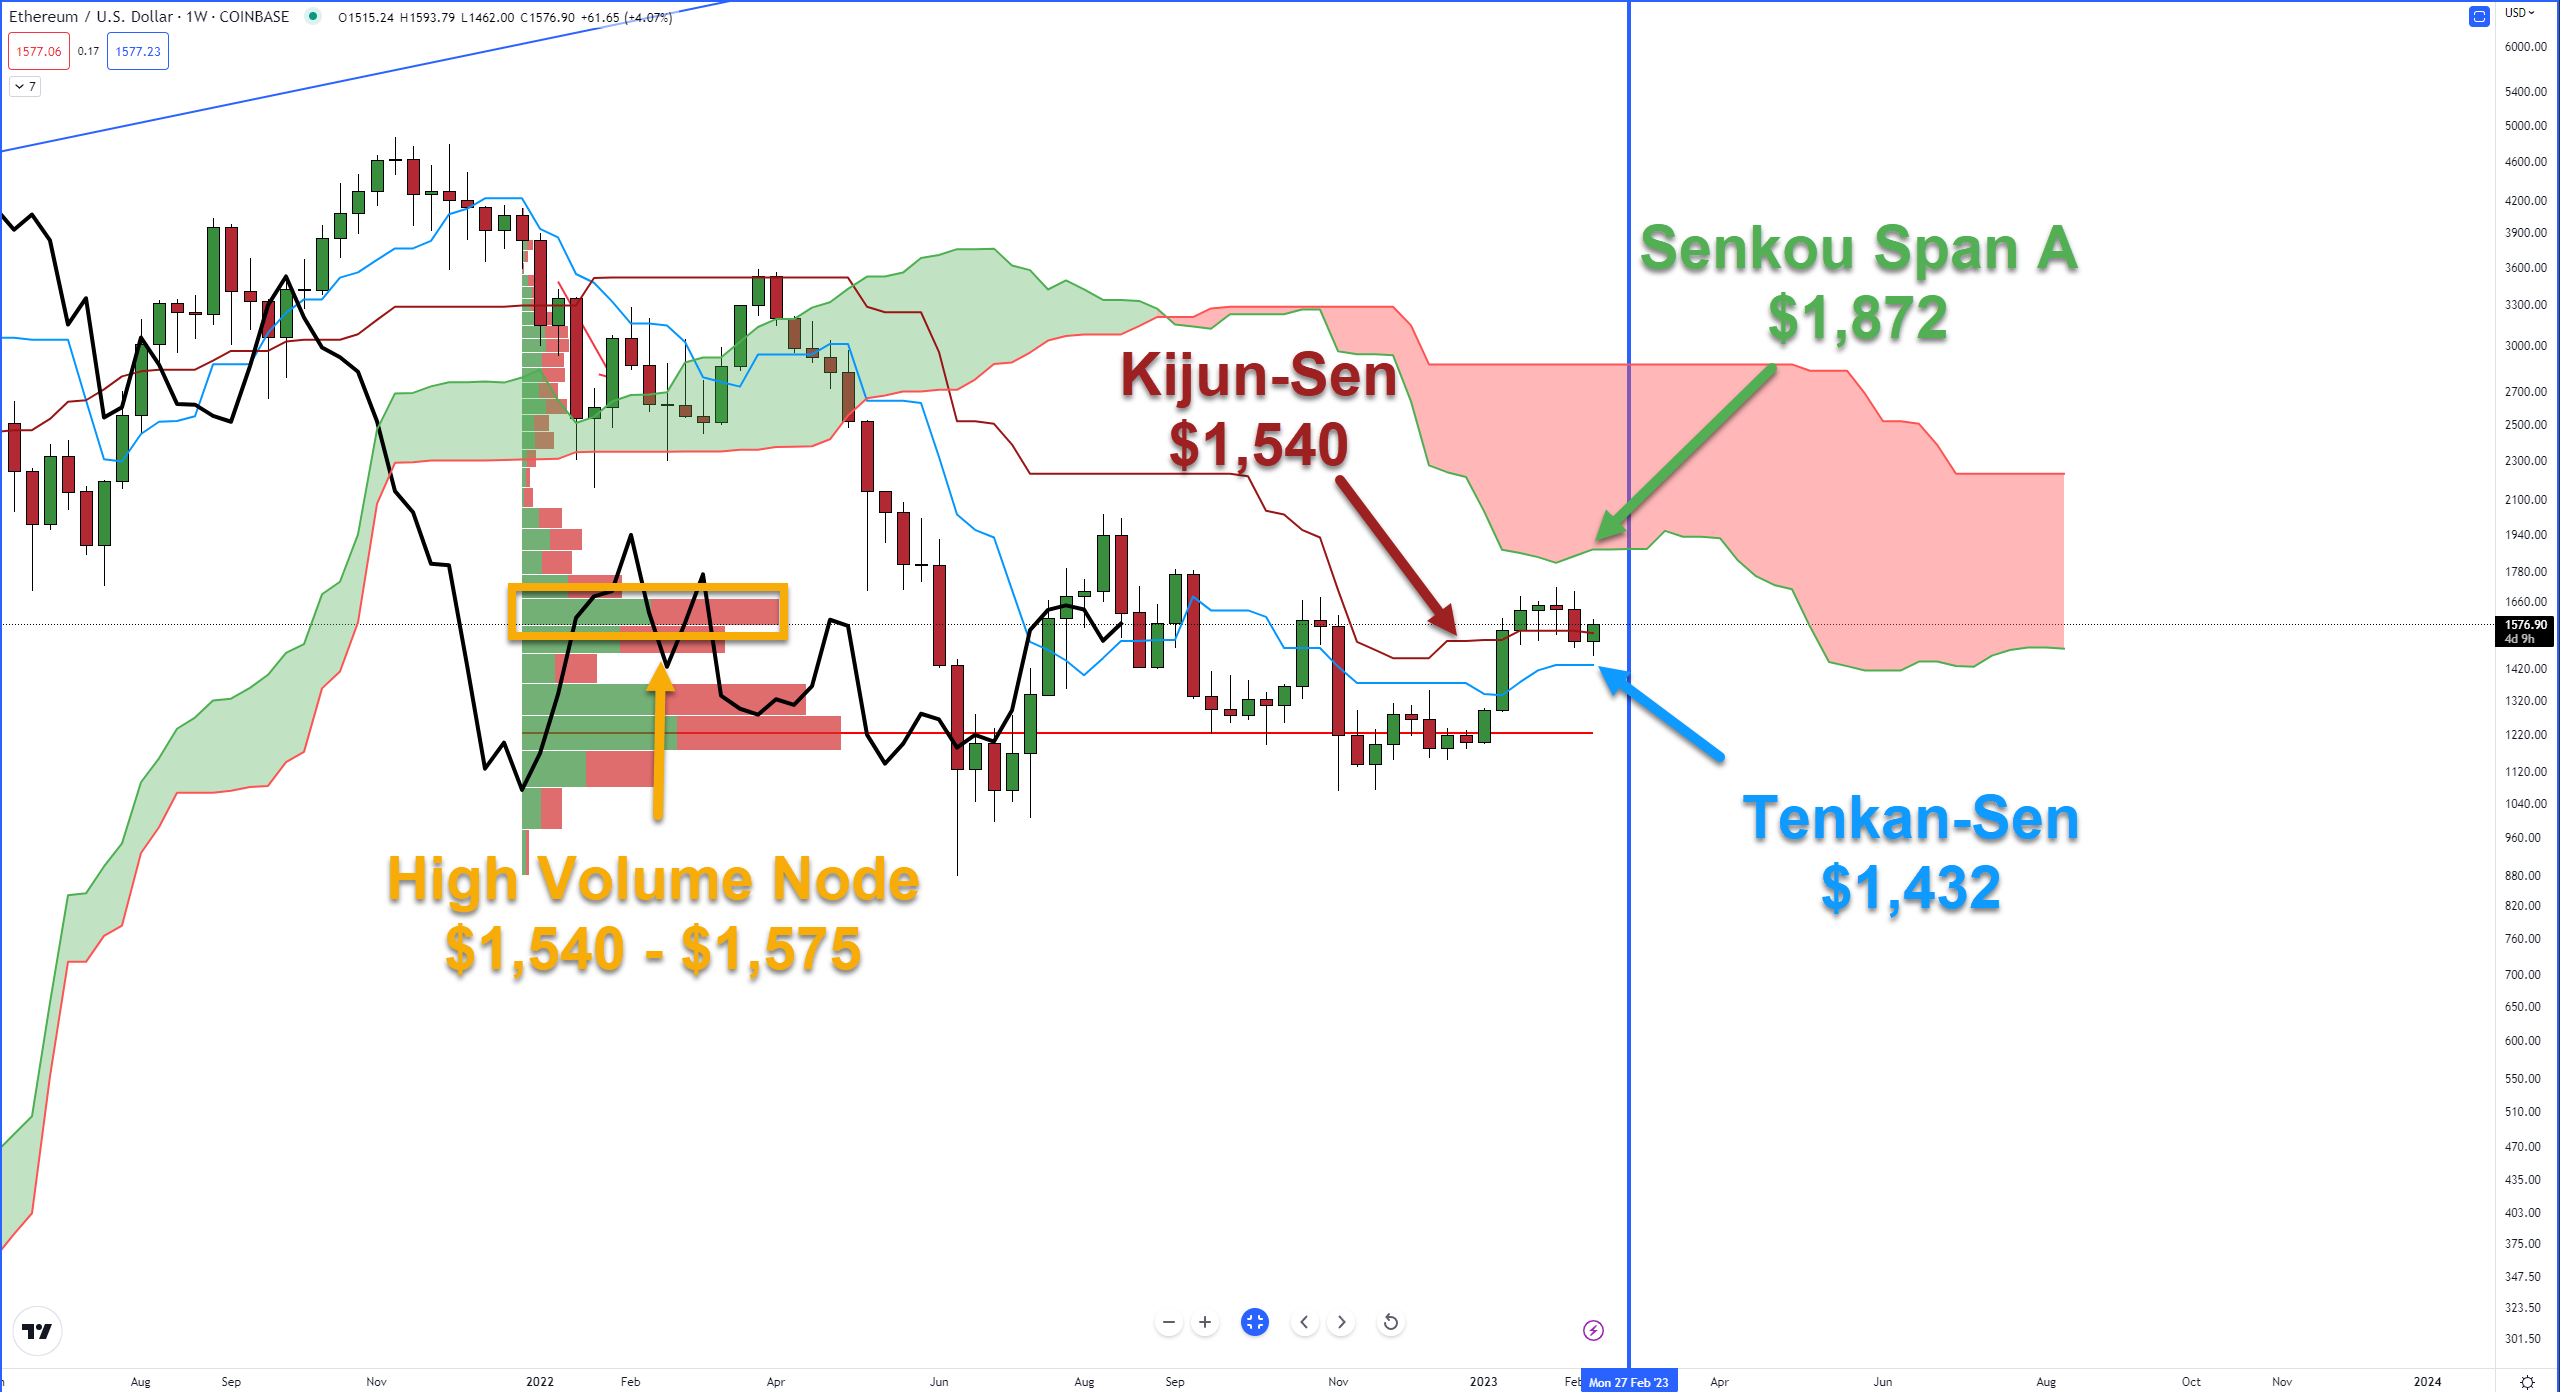
The difficulty ahead for the bulls was highlighted on February 14.
From a technical level, the challenges for bulls include a price confluence zone that includes the Kijun-Sen and a high-volume node in the volume profile between $1,540 and $1,575.
How does Ethereum look two weeks later?
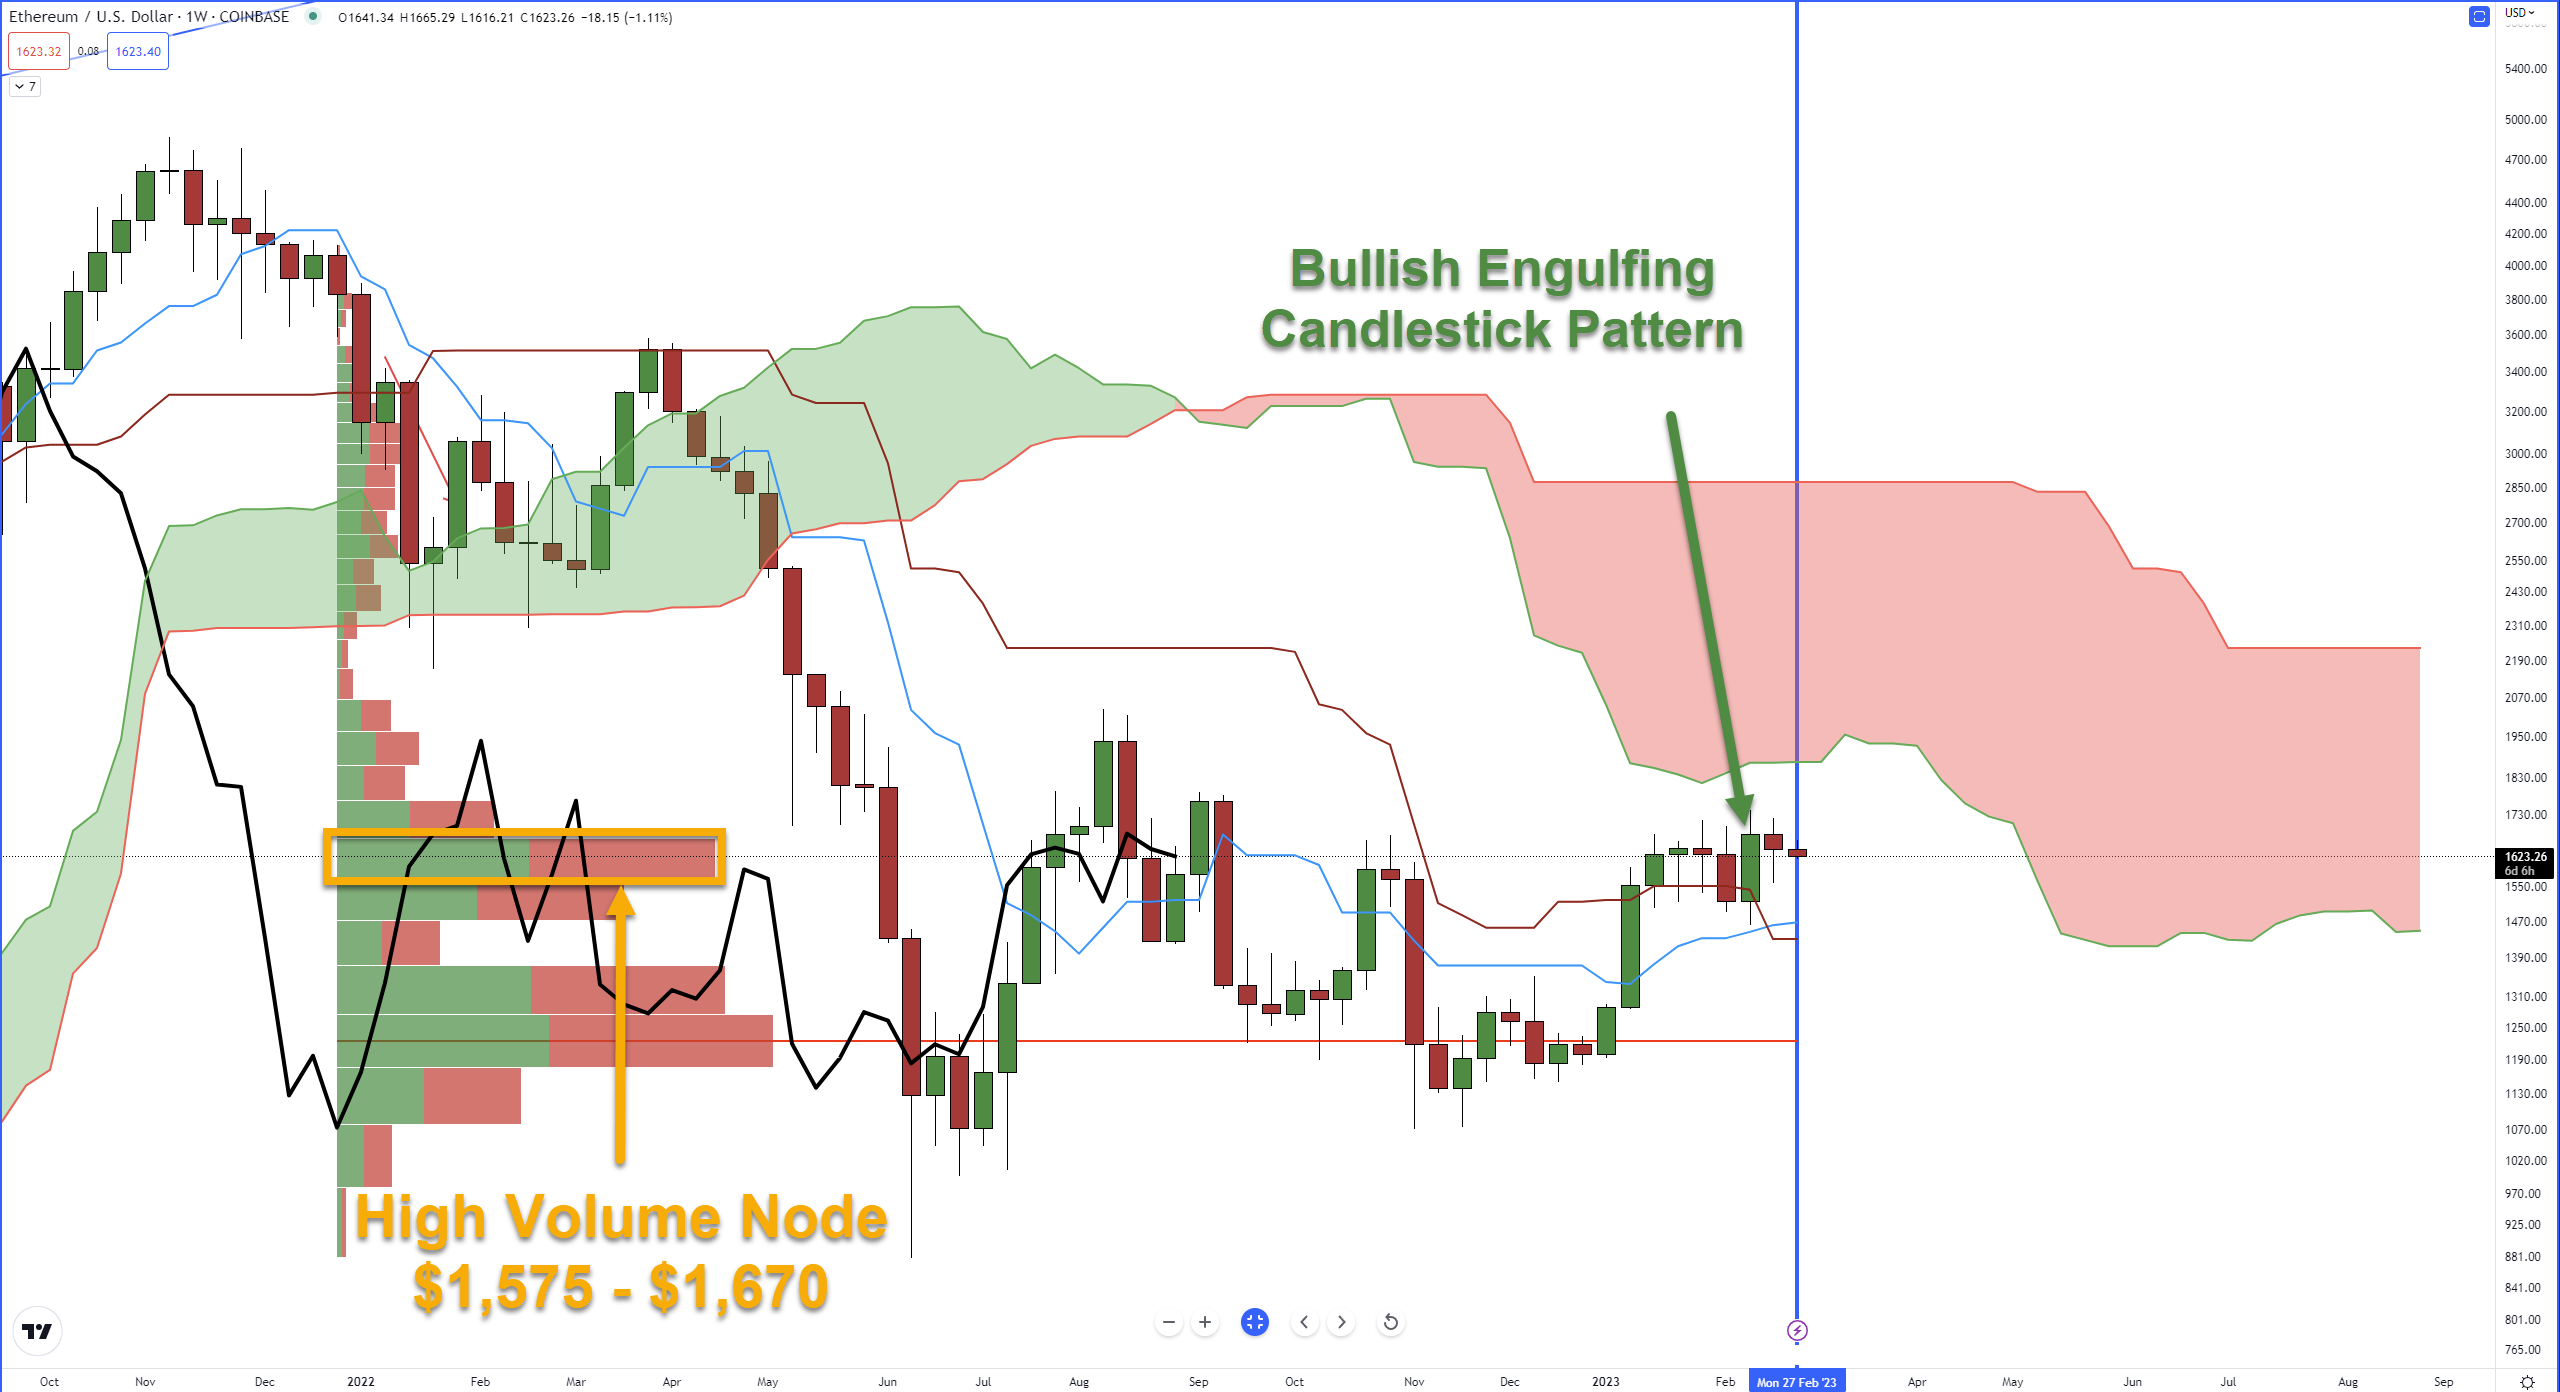
First, there was a Bullish Engulfing Candlestick Pattern on the weekly chart, which resulted in the highest weekly close since September 12, 2022 (24 weeks).
Additionally, the weekly Tenkan-Sen crossed above the Kijun-Sen, an event that has not occurred since the week of September 20, 2021 (75 weeks).
Also, note the high volume node in the Volume Profile now and the February 14 screenshot: it’s moved from $1,540 – $1575 to $1,575 – $1,670.
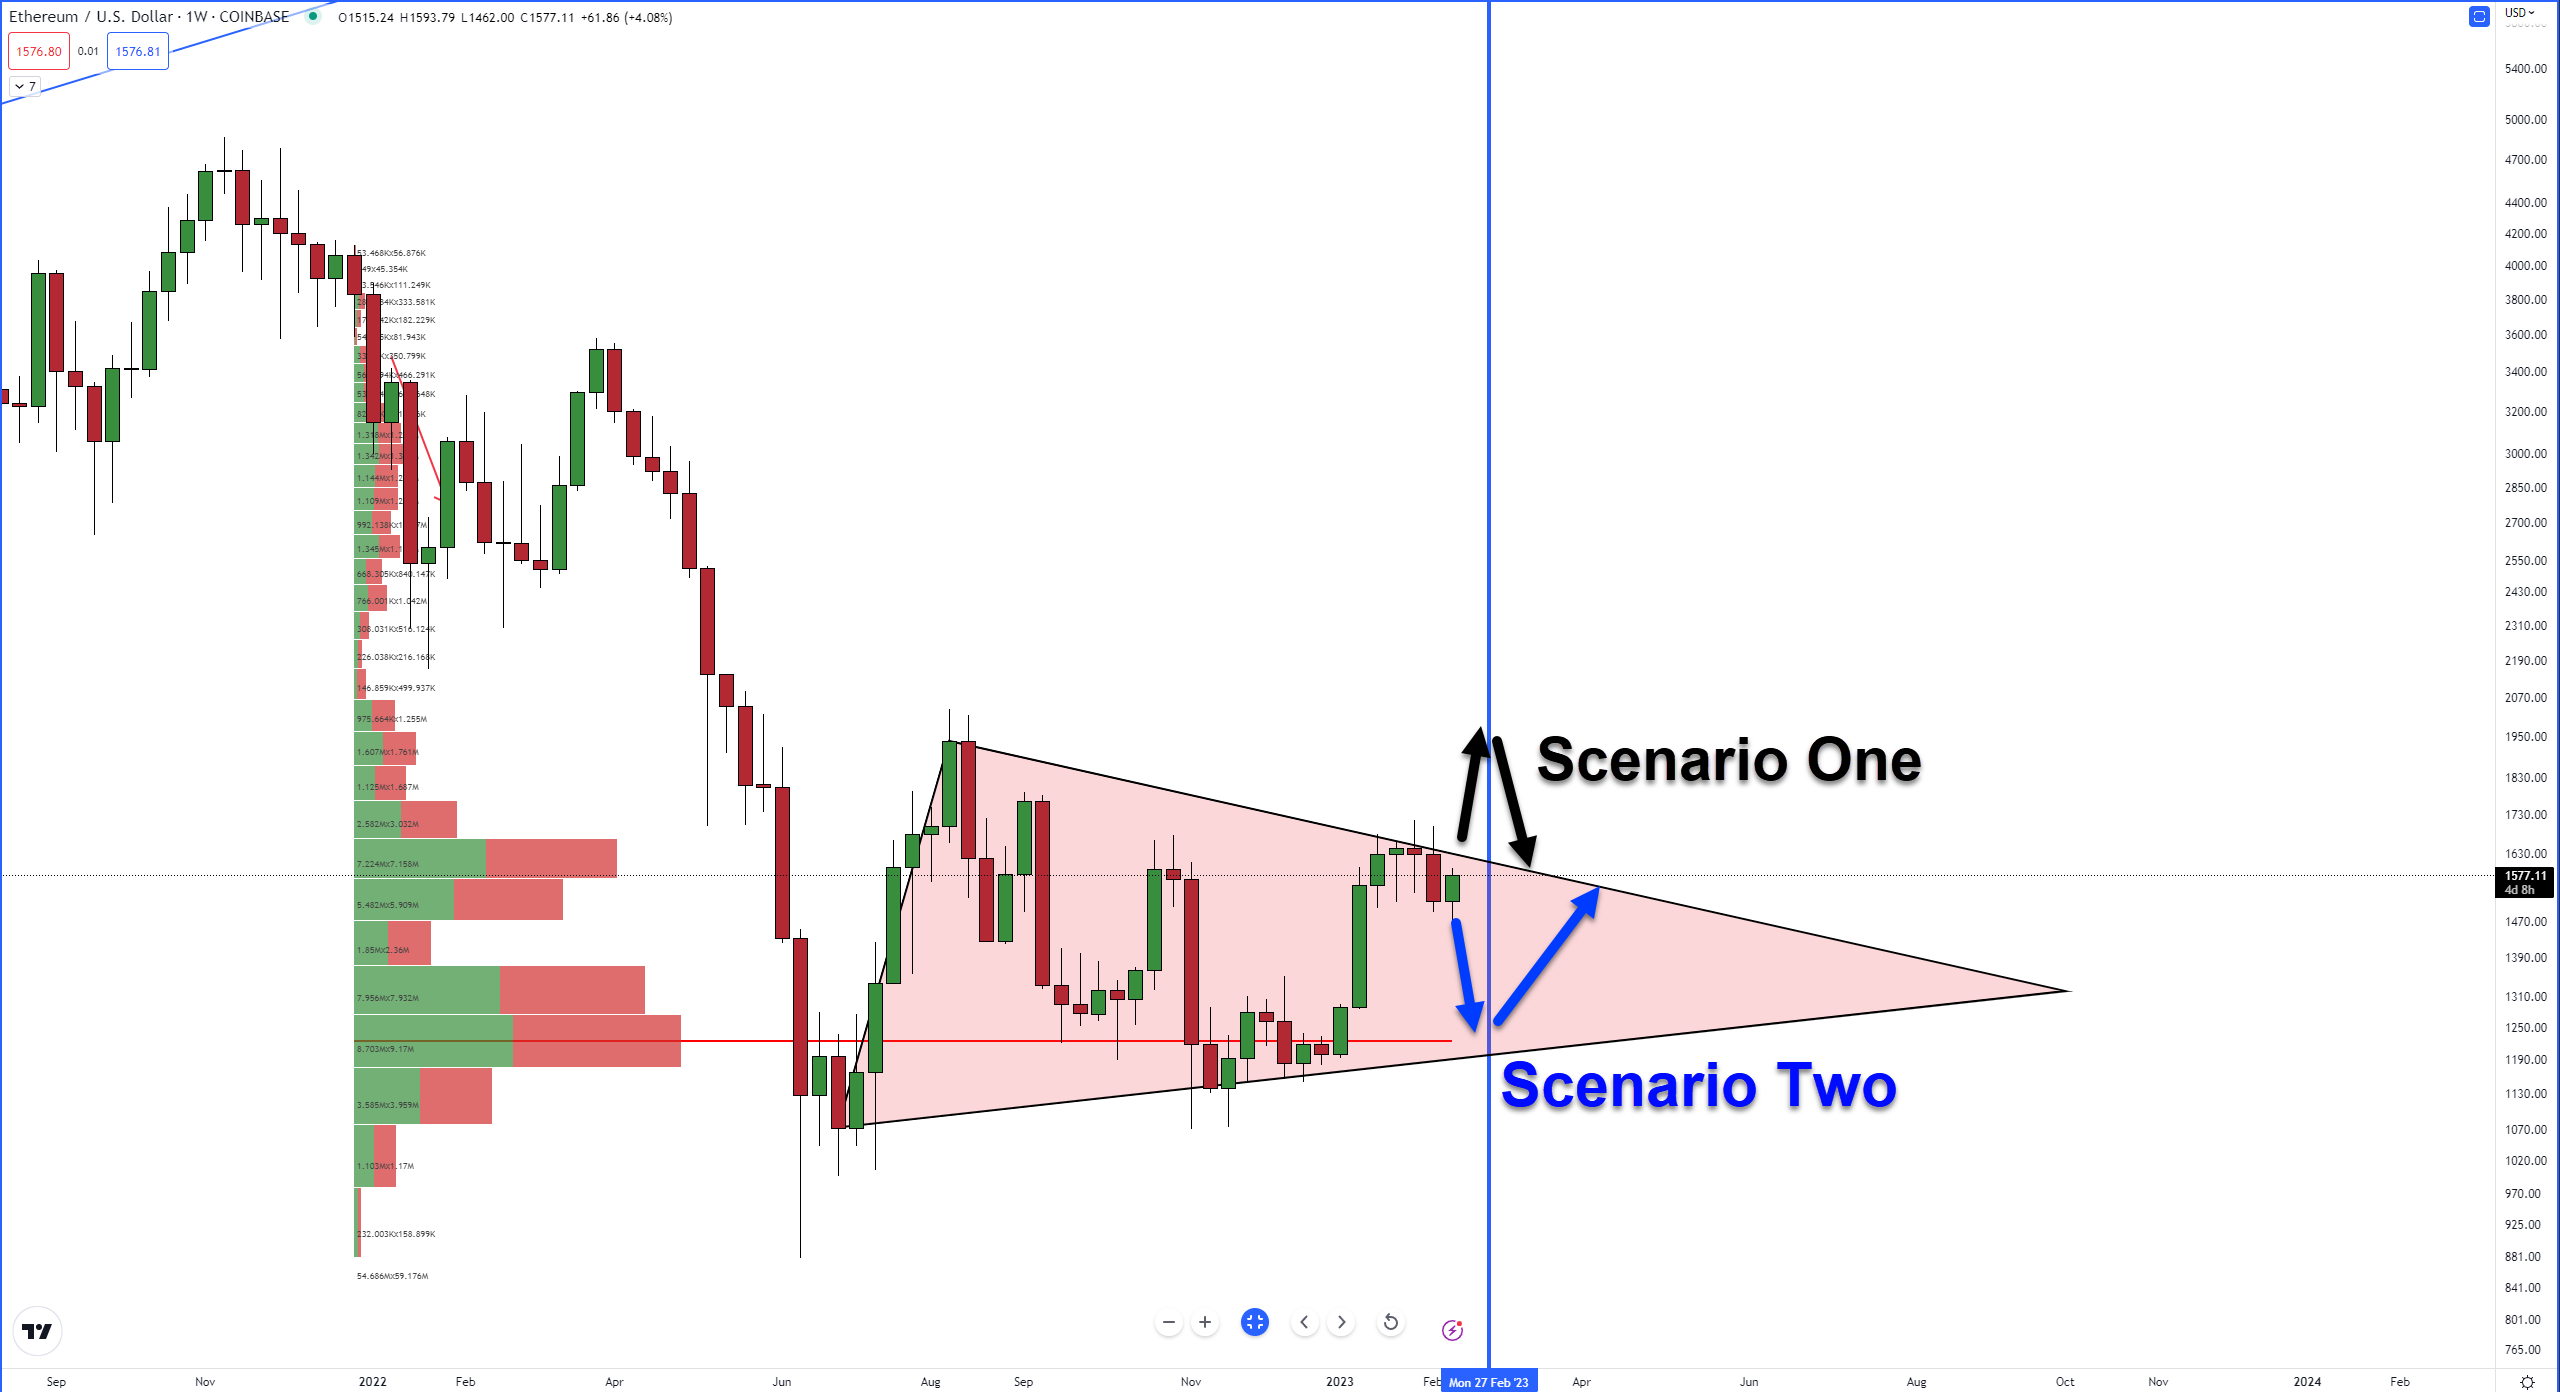
The second weekly chart image from February 14 was the bearish pennant:
And here’s how Ethereum has traded since then:
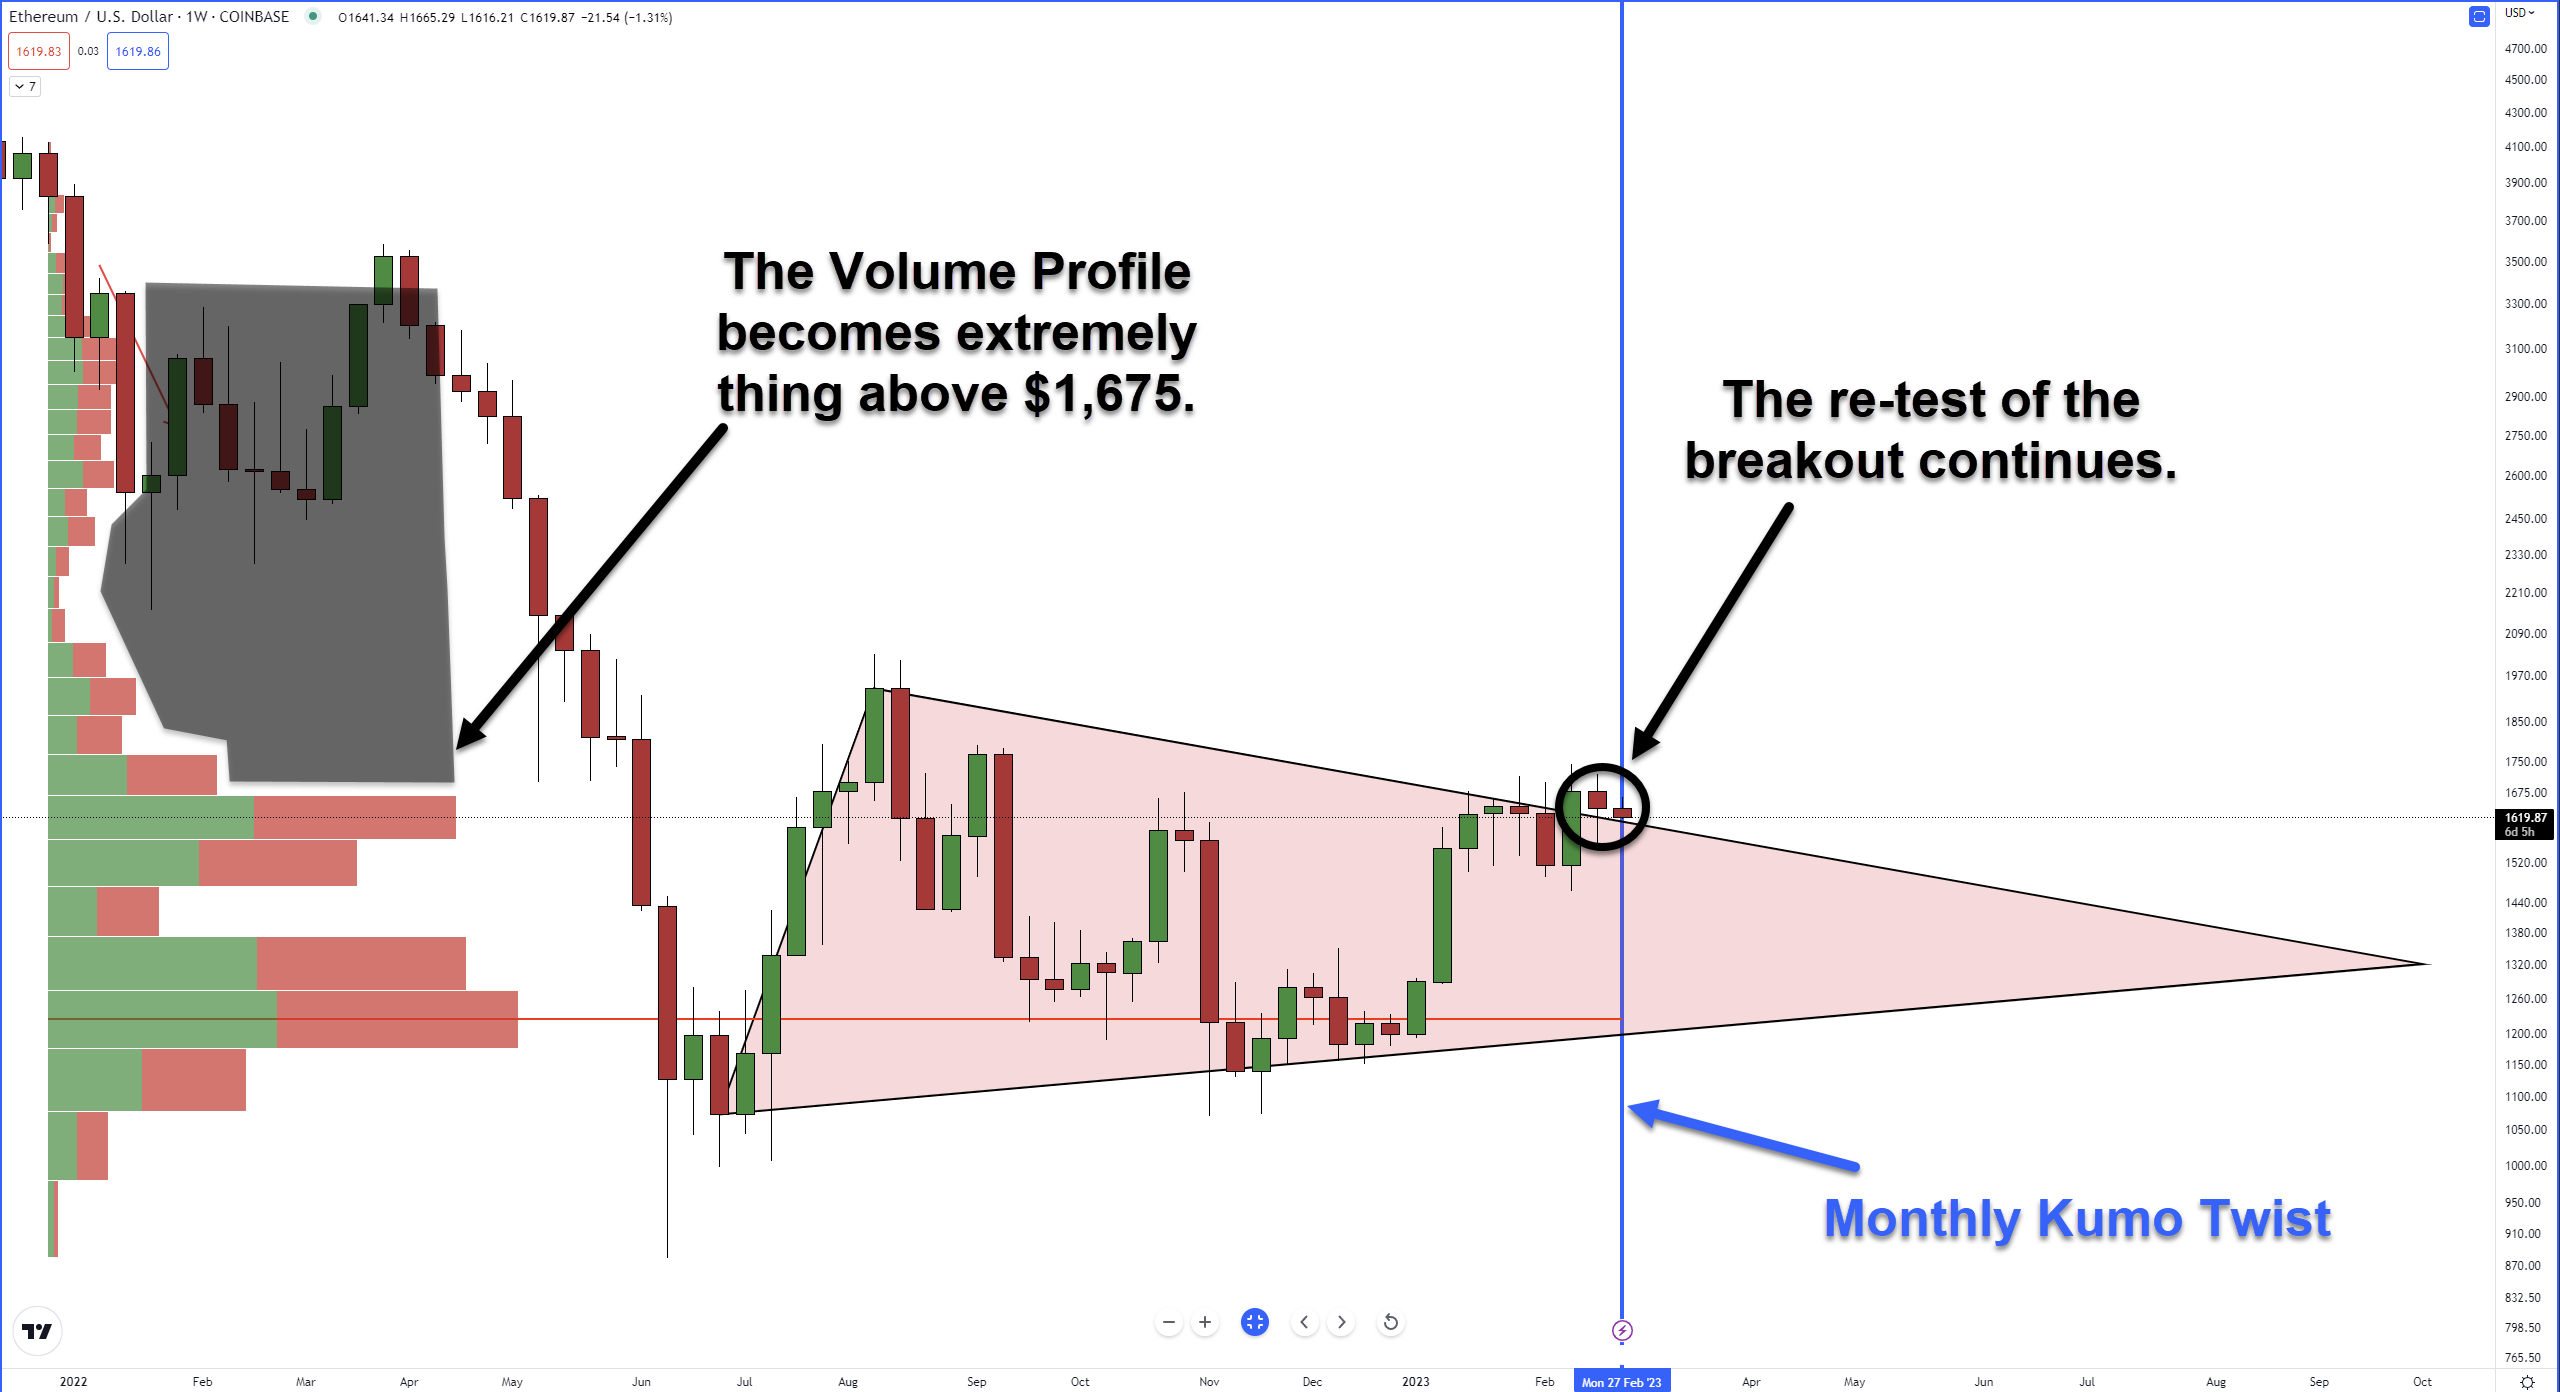
Notice that Ethereum did break out above the bearish pennant, tested it last week, and continues to test the breakout this week.
Also, note the Volume Profile above $1,675 (shaded black/gray area) – it’s extremely thin, which means that (theoretically) prices have an easier time moving up than down.
Is there a bearish case here? Absolutely, but what the bearish analysts and traders see is for Wednesday’s Litepaper. First, let’s see what happens at the end of February and March’s open.