Most of the top 25 cryptocurrencies by market cap are close to approaching a Kumo Twist on the daily chart, and most are at swing lows. 🌋
What are Kumo Twists? Take a look at Cardano’s chart below:
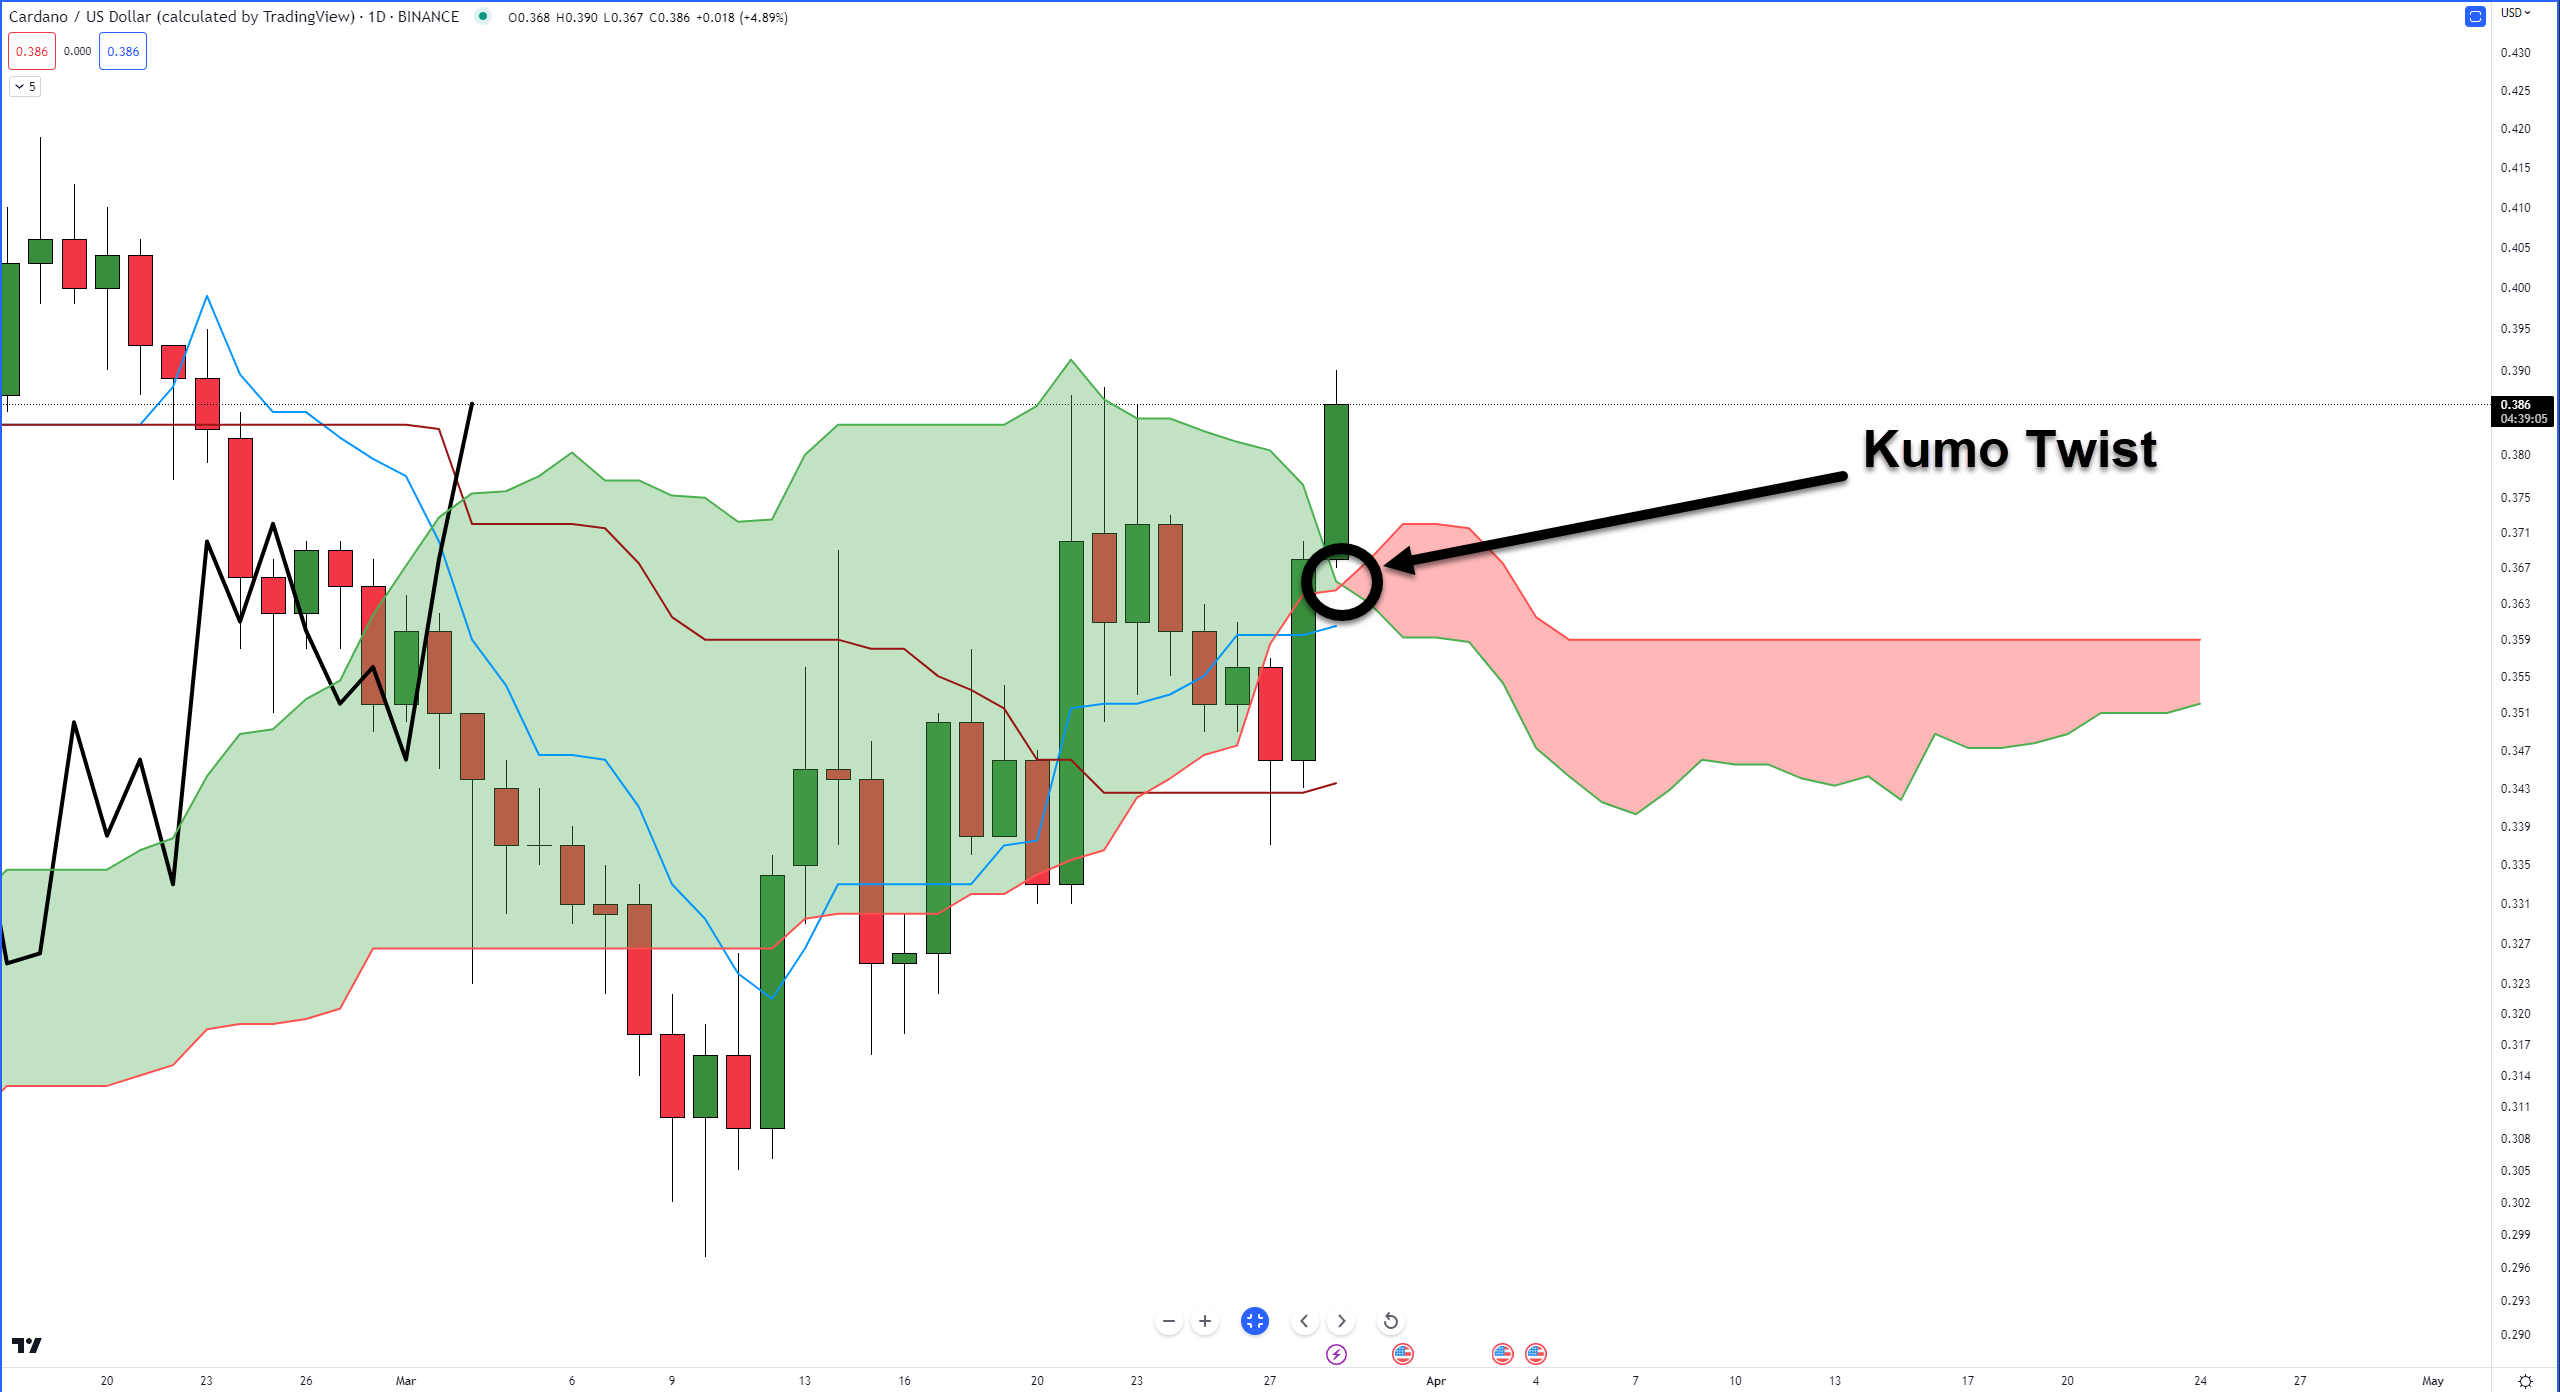
Kumo Twists are when Senkou Span A crosses Senkou Span B and can indicate likely changes in trend. Sometimes a Kumo Twist is the most immediately visible sign of a trend change.
In other words, if something is trending strong up or down and it approaches a Kumo Twist, that market can have a high probability of finding a major/minor swing/high that results in a major trend change or a correction.
What makes Cardano’s chart interesting from an Ichimoku perspective is how the current daily candlestick seemingly shot through the Cloud. It’s a phenomenon within the Ichimoku Kinko Hyo system.
When price is near the point of Senkou Span A crossing Senkou Span B, instead of expecting resistance, it almost acts as an accelerant for price to move through, like hitting a speed buff in F Zero or Mario Cart. 🏎️
Like Cardano, many altcoins are at or near a Kumo Twist on their daily charts.
The cryptos with (above) indicate that they are above the Cloud; everything else is below the Cloud.
- $ADA – March 30
- $ATOM – March 29
- $AVAX – March 30
- $AXS – March 28
- $BNB – March 29 (above)
- $BTC – April 4 (above)
- $COTI – March 28
- $DOGE – March 28
- $DOT – April 1
- $ETH – April 4 (above)
- $FTM – April 1
- $LINK – March 31
- $LTC – April 1
- $SHIB – April 1
- $SOL – April 2
- $XLM – March 31 (above)
- $XTZ – April 2
Using Cardano’s chart again as a reference, the majority of cryptocurrencies are at or near the end of one of the most important time cycles in Gann Analysis: the 90-day cycle.
The 90-Day cycle is one the most important in Gann’s Cycles of the Inner Year. Gann wrote this about the 90 Day Cycle:
- Most powerful division of the one-year cycle.
- High probability of support or resistance being found.
- 90 days up or down will usually start a countertrend movement or reverse the trend.
- 90 days from all significant highs or lows must be watched for trend changes.
- Against extreme momentum and/or pitch, it can go 99 days.
Does this mean things are about to get uber-bearish? No. Historically, when a new bull run begins after a bear market, $BTC moves higher for 4+ months – but that’s something we’ll visit next week.
According to analysts, the likely bullish scenario(s) for the next two weeks is for cryptos above the Ichimoku Cloud to pull back a little or consolidate while the rest of the altcoin market responds to the swing lows and plays catchup with everyone else.
For the bears, their ideal scenario is a violent continuation move south, with the Kumo Twist and 90-day Gann cycle acting as a source of resistance in time to the trend in force.