Let’s walk down memory lane in $BTC‘s monthly chart. We’re going to start this journey all the way back to August 2022. 🗓️
In the Technically Speaking article from August 2022, Elliot Wave Theory was used to project how low Bitcoin could go to complete Wave 5.
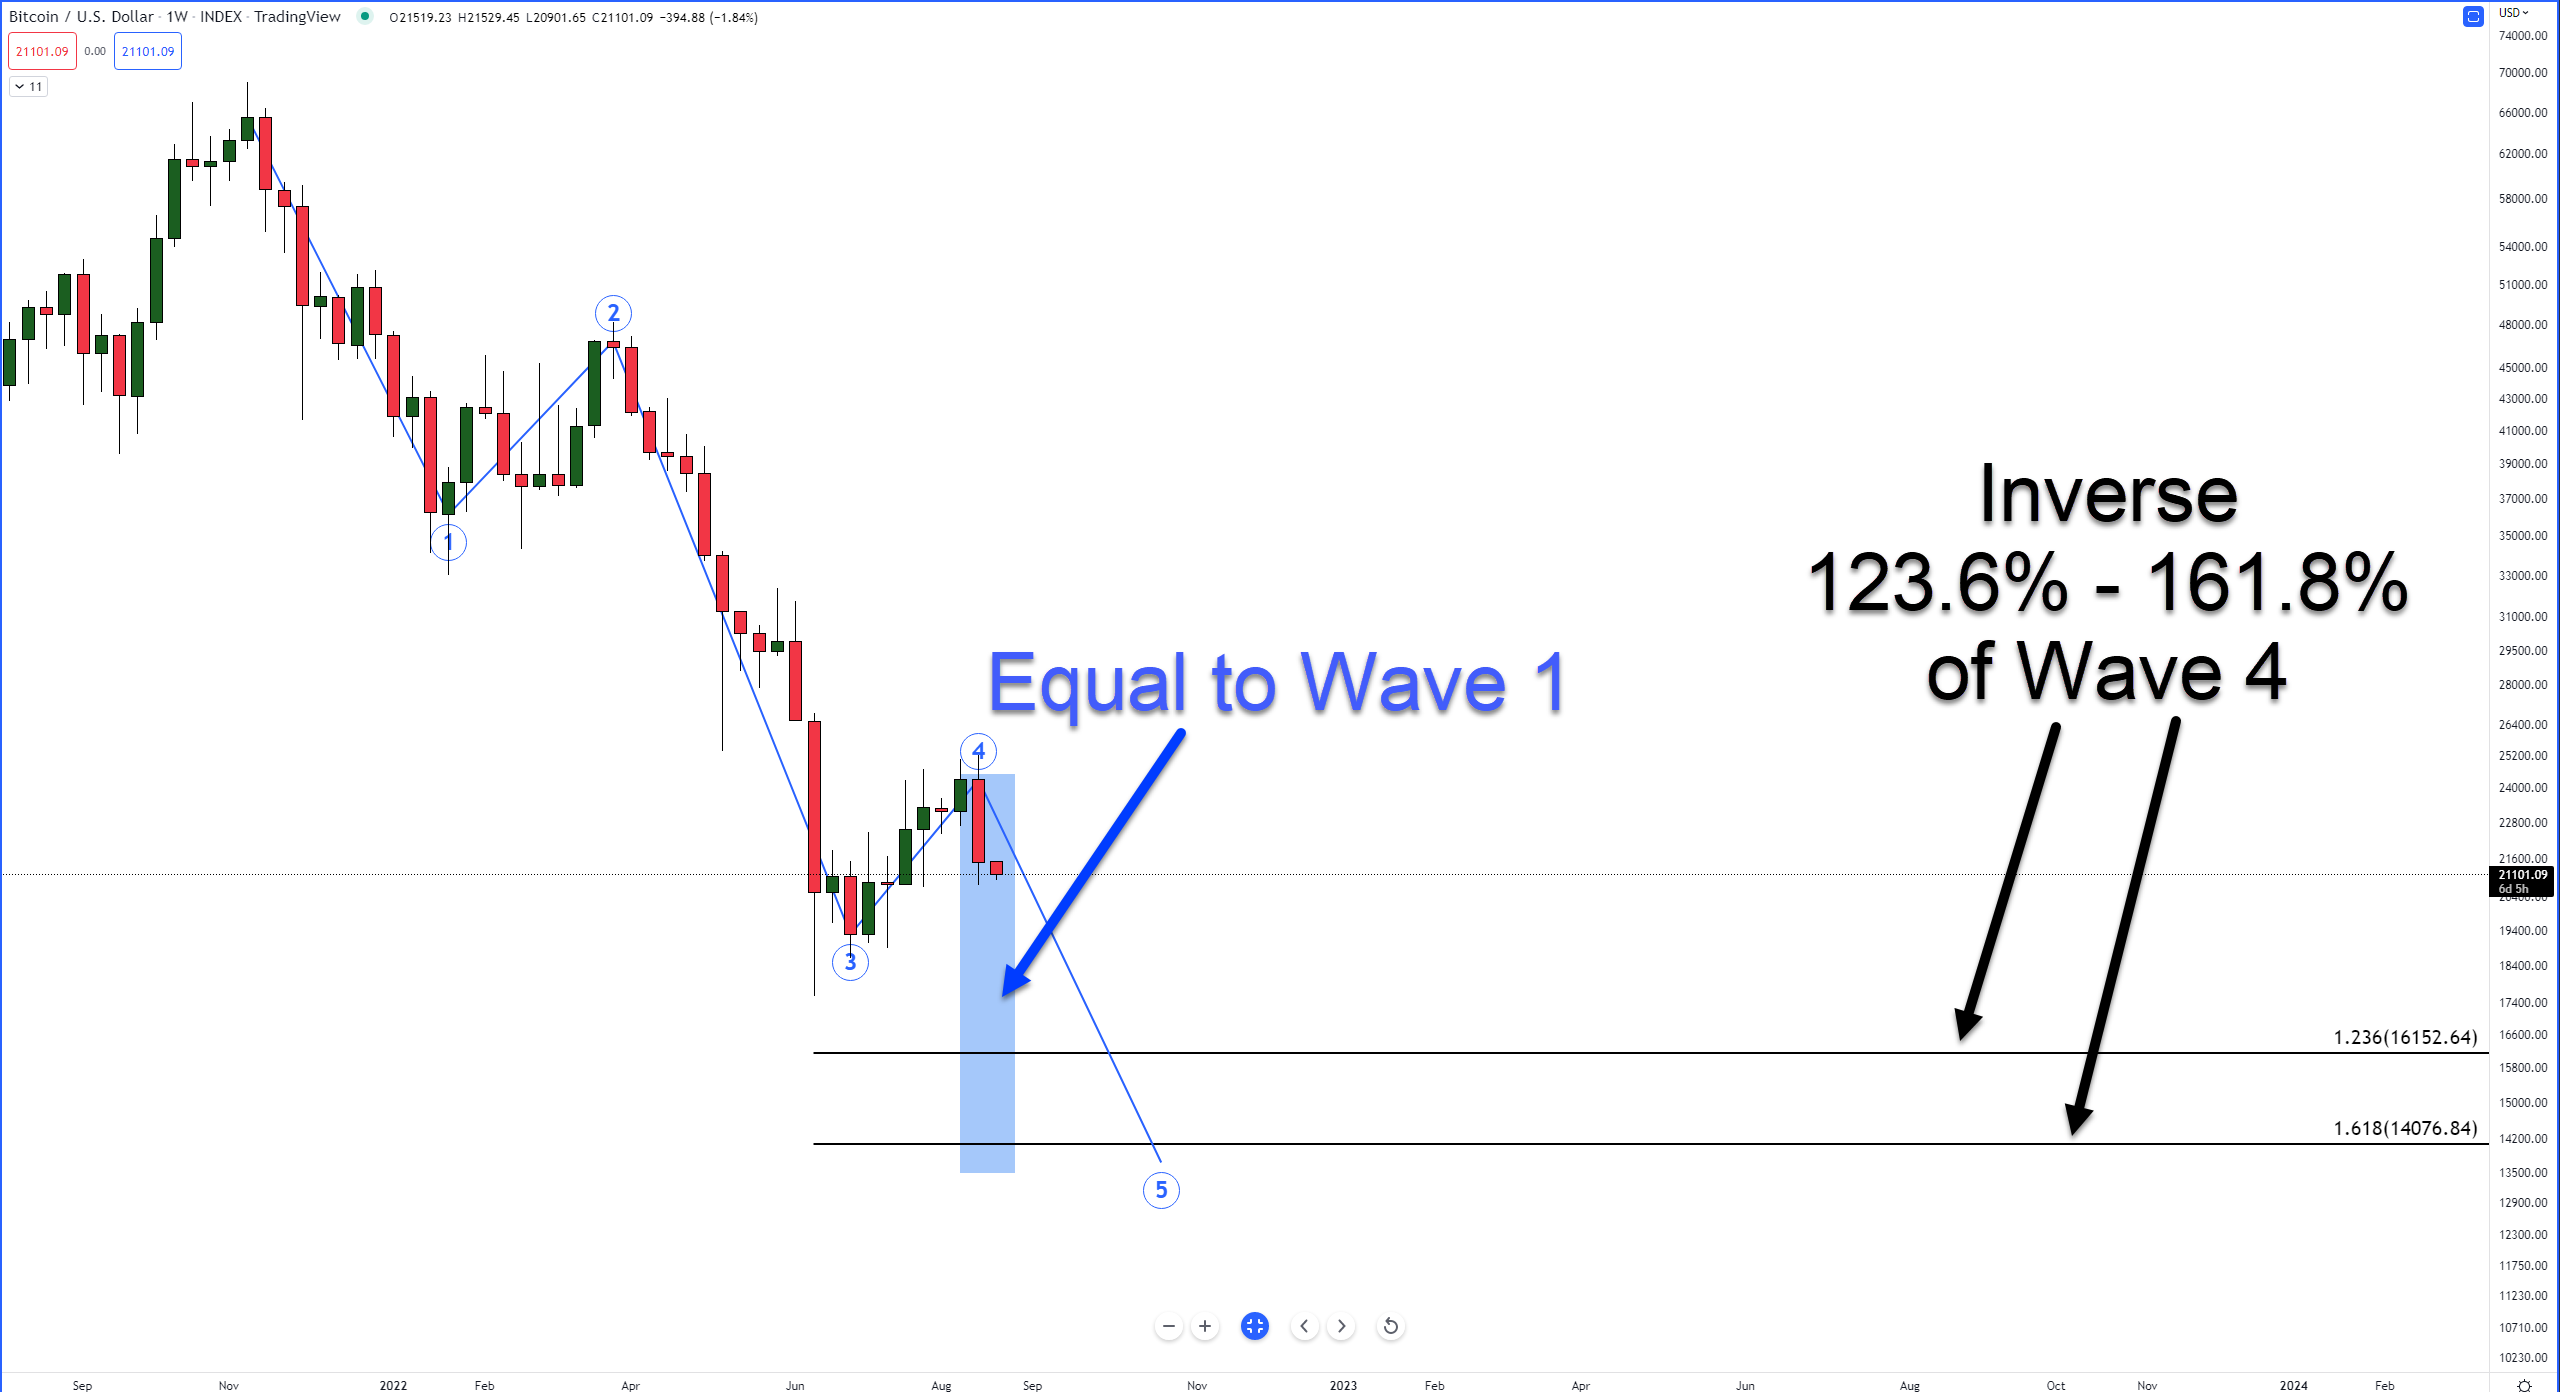
Based on the Elliot Wave analysis, it was hypothesized that the potential reversal zone for Bitcoin lay between $13,500 and $16,000 value areas.
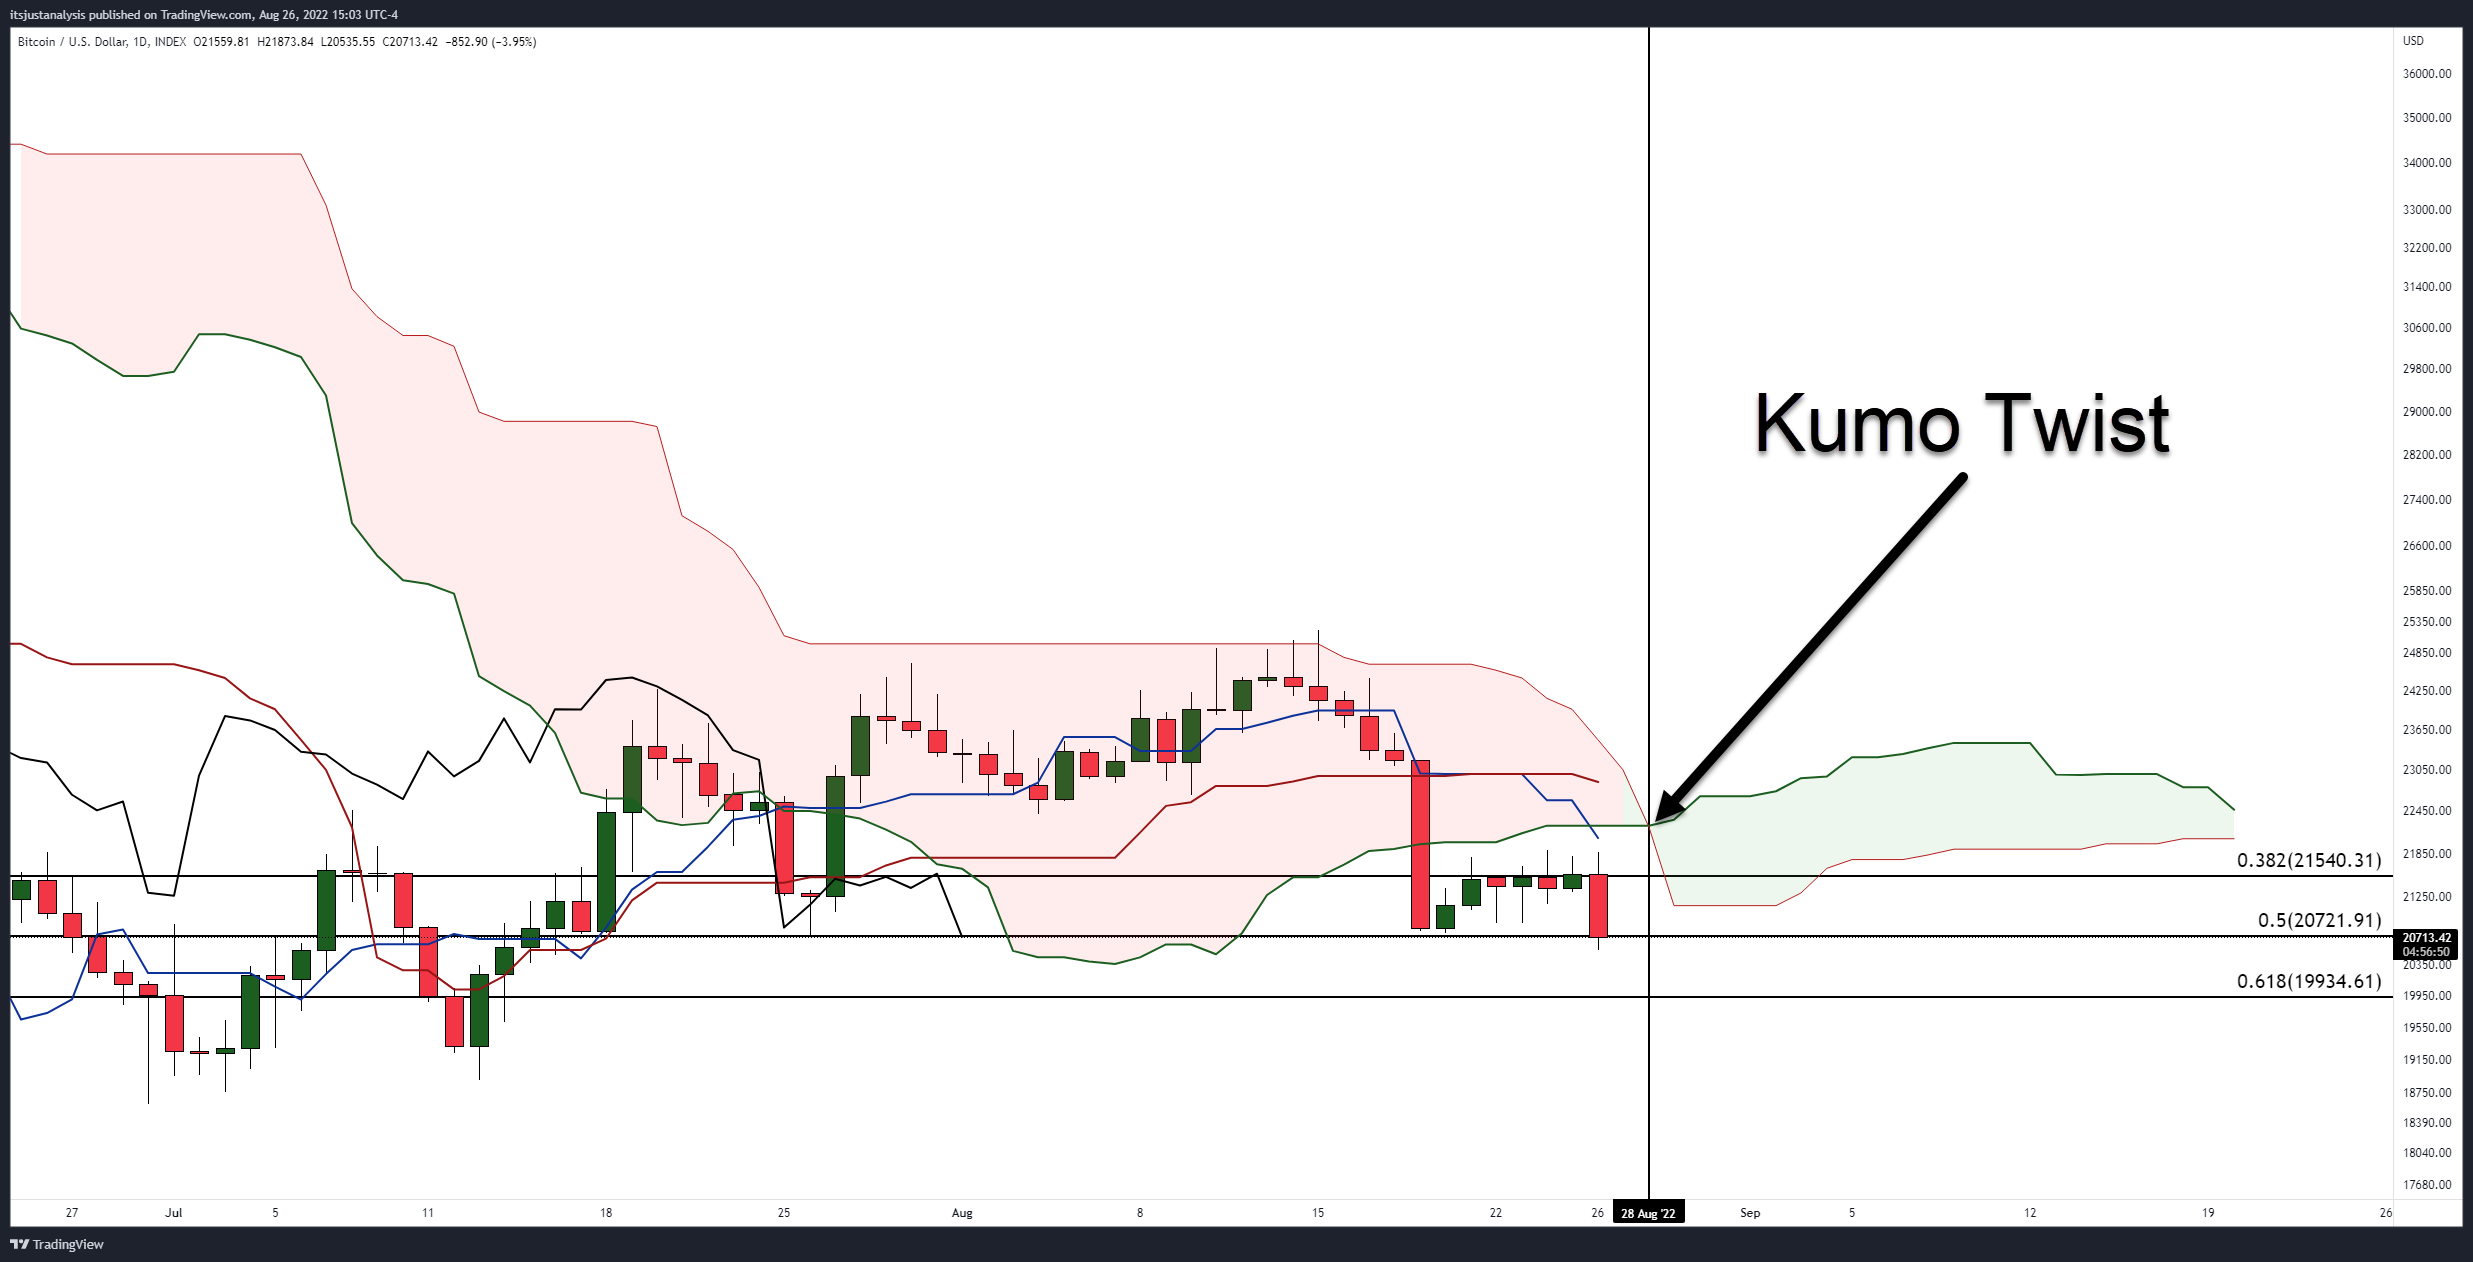
Additionally, the August 26 Technically Speaking highlighted the Kumo Twist, which warned of a bearish continuation and complimented the August 22 analysis.
Now we move to the Technically Speaking article on September 2, 2022, Litepaper; which warned that Bitcoin needed to remain above the monthly Cloud to sustain a clear and strong bullish trend well into 2023. ⚖️
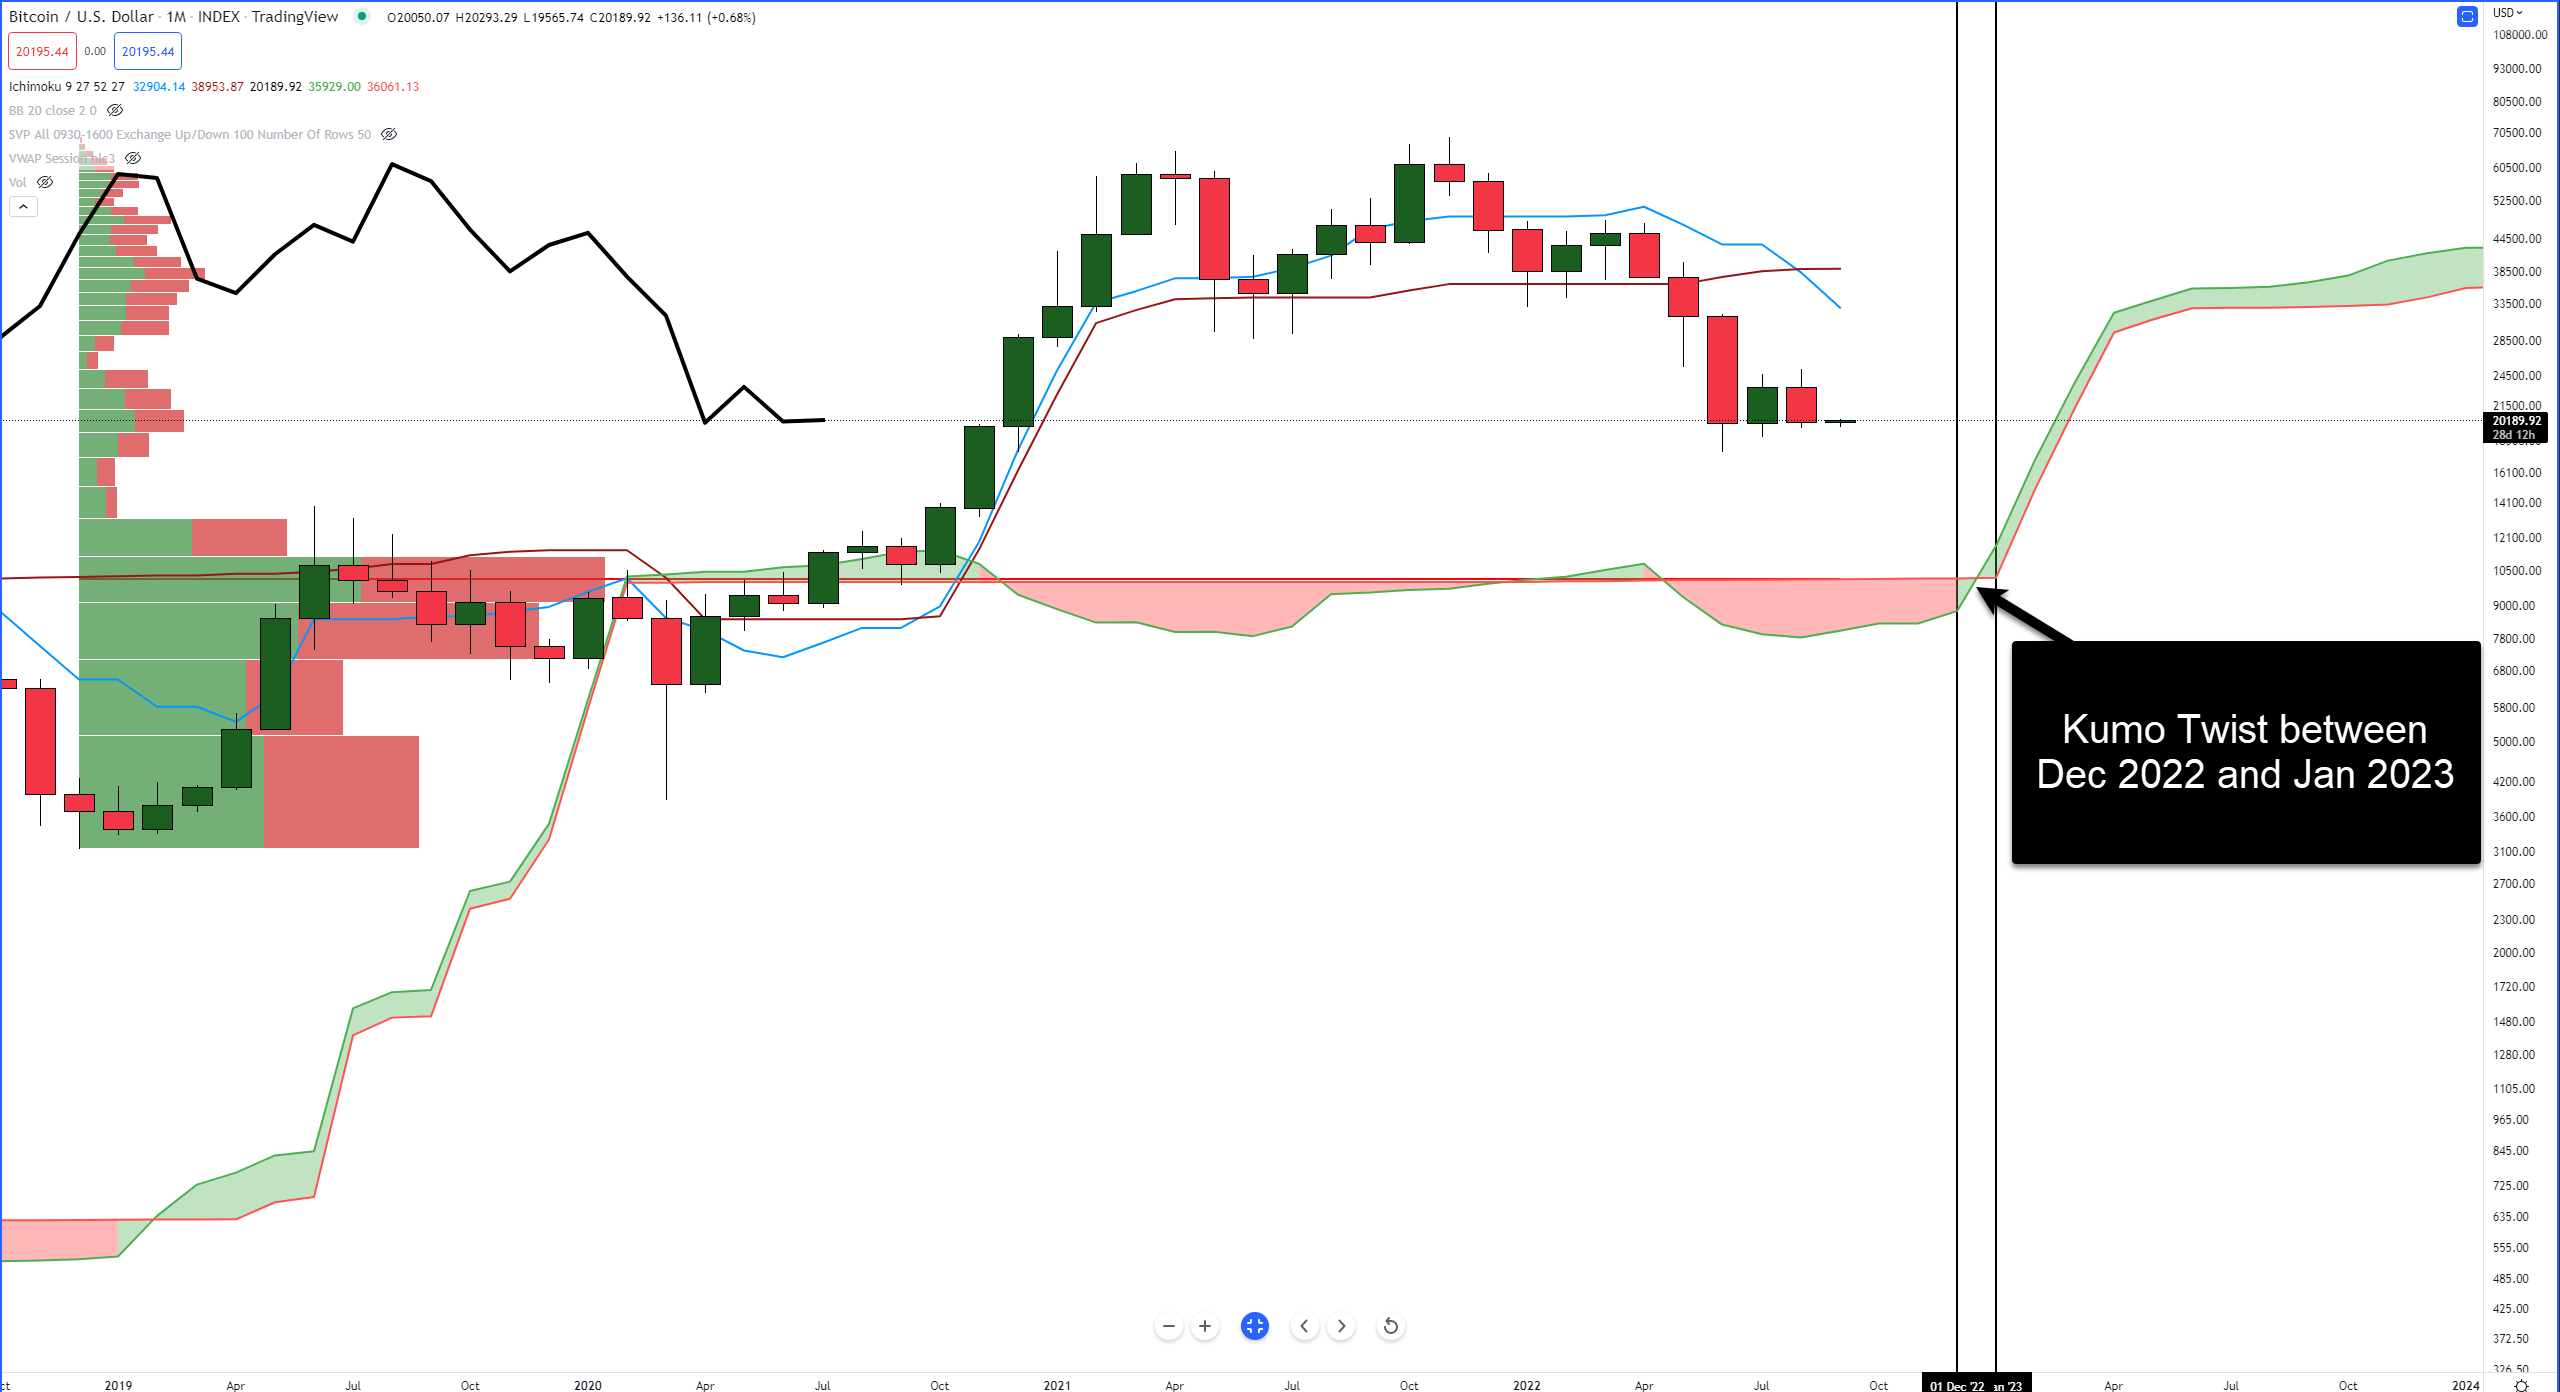
The top of Cloud began at $10,000 and gradually moved up to $33,000 in June 2023, finally increasing towards the $34,400 level in December 2023.
Next stop, January 4, 2023. 
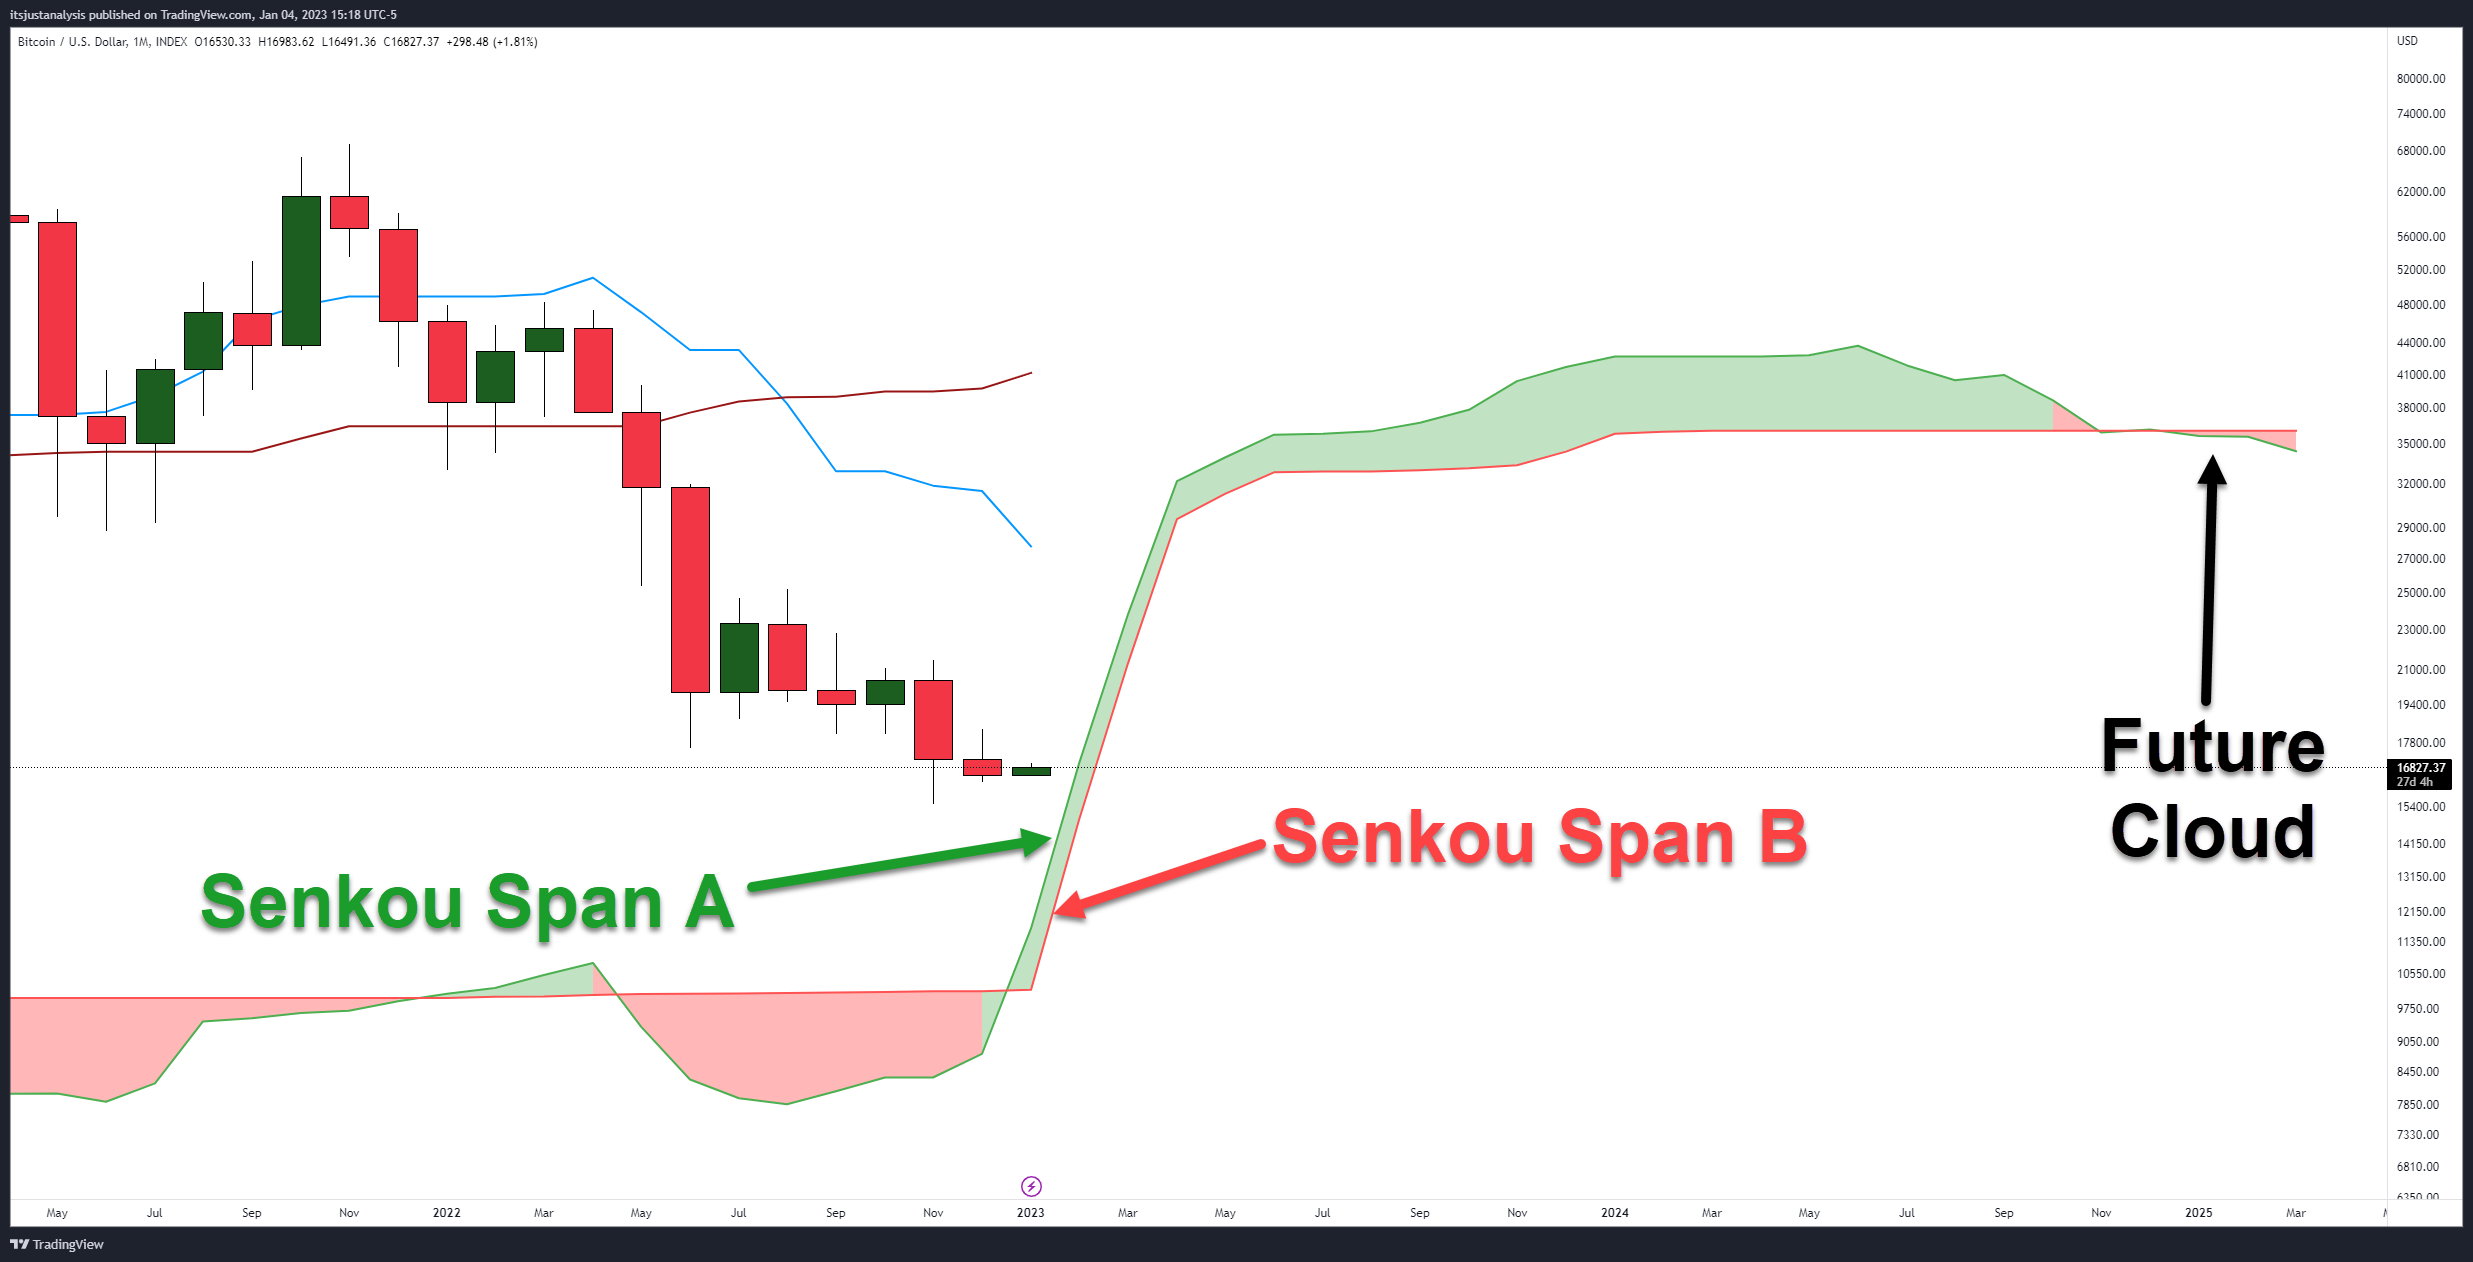
The Technically Speaking article on January 4 again called attention to the Kumo Twist first looked at in August 2022, but the primary focus was a very rare condition on Bitcoin’s monthly chart: Patel’s Two Clouds Theory
The theory observed this behavior: When a major trend change occurs, the Future Cloud is thin, with both the current Senkou Span A and Senou Span B pointing in the direction of the Cloud.
Now let’s look at how March 2023 ended up in relation to the monthly Ichimoku Cloud:
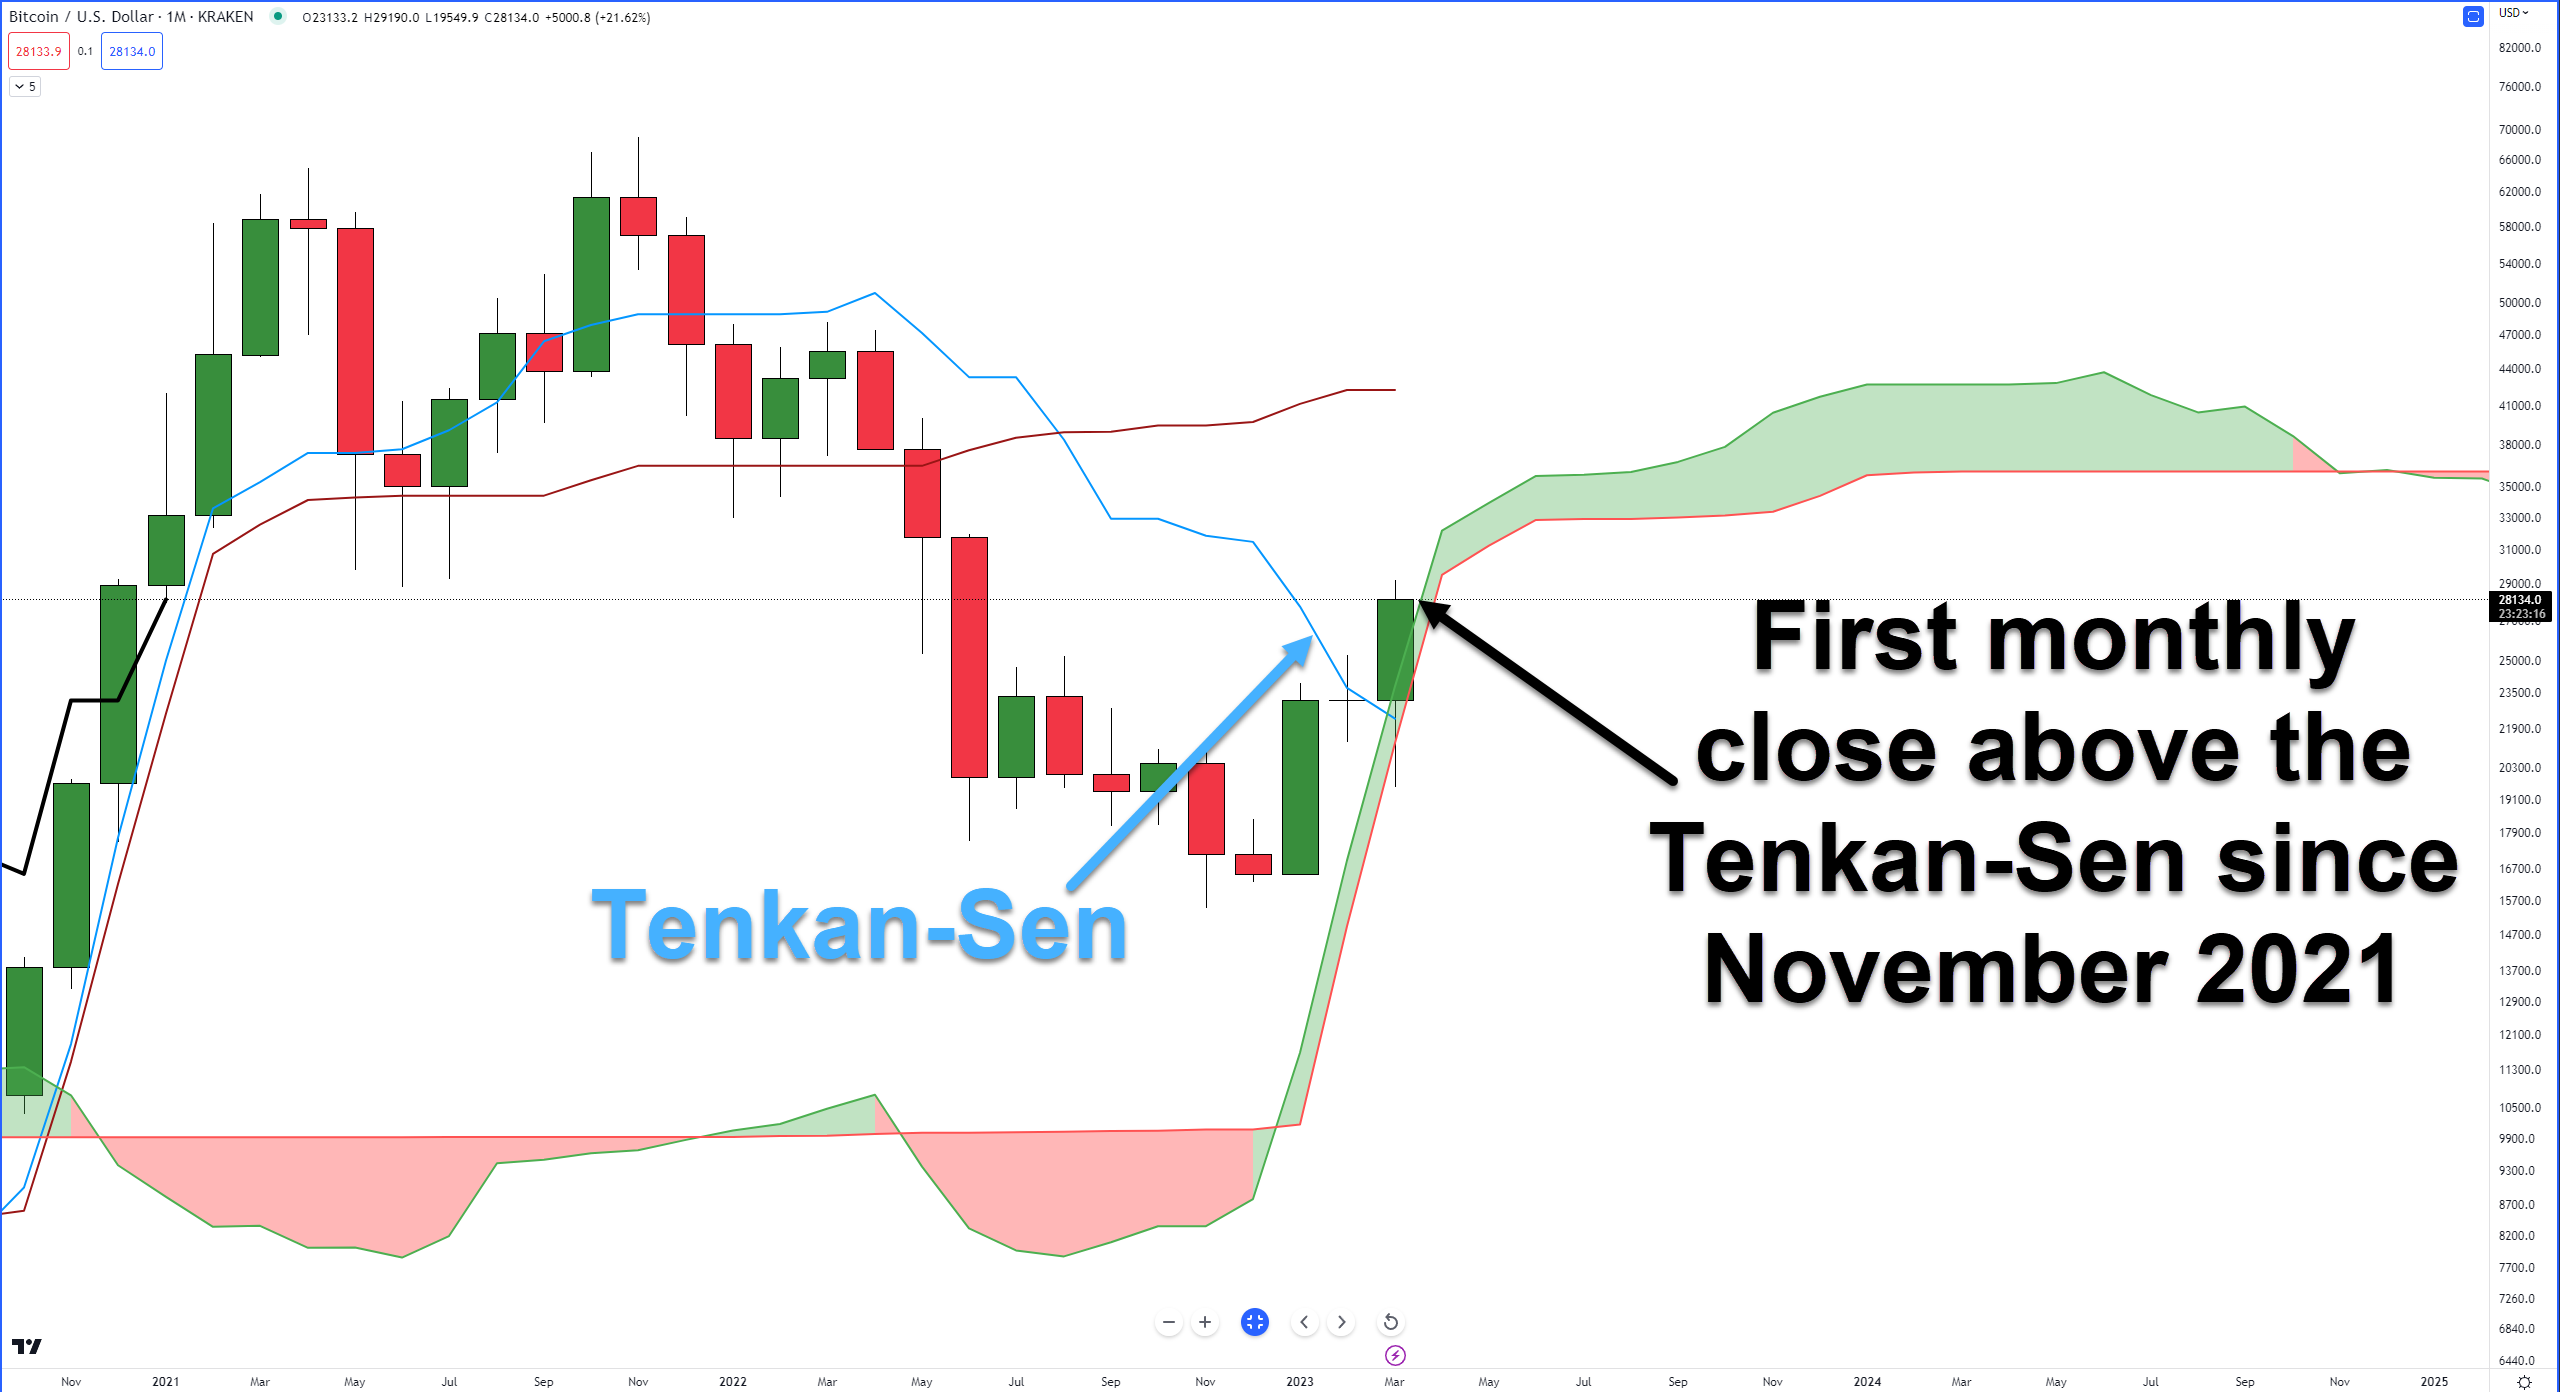
Bitcoin has experienced consecutive closes above the Cloud for January, February, and March. As we head into April, where should April’s close be to maintain the bullish trend? 🐂
The bottom of the monthly Cloud (Senkou Span B) is at $29,506, and the top of the monthly Cloud (Senkou Span A) is at $32,152.
It seemed unrealistic to see Bitcoin return to the $30,000 range in December 2022; however, now it appears achievable.
Nevertheless, this market is known for unexpected downturns, especially over the weekend, so let’s wait and see what happens.