It’s the 10th week in a row $BTC has been stuck inside the Ichimoku Cloud.🥺
All of the suck involved with the type of price action and broken hearts one would expect to experience when something is in the Cloud, we’re all experiencing it.
It’s as frustrating as a mosquito in a mannequin factory.
Also, look for the TL;DR (Too Long; Didn’t Read) summary below if you want to skip what looks like a toddler’s placemat at IHOP. 👀
A few things to look at here on the $BTC‘s weekly chart:
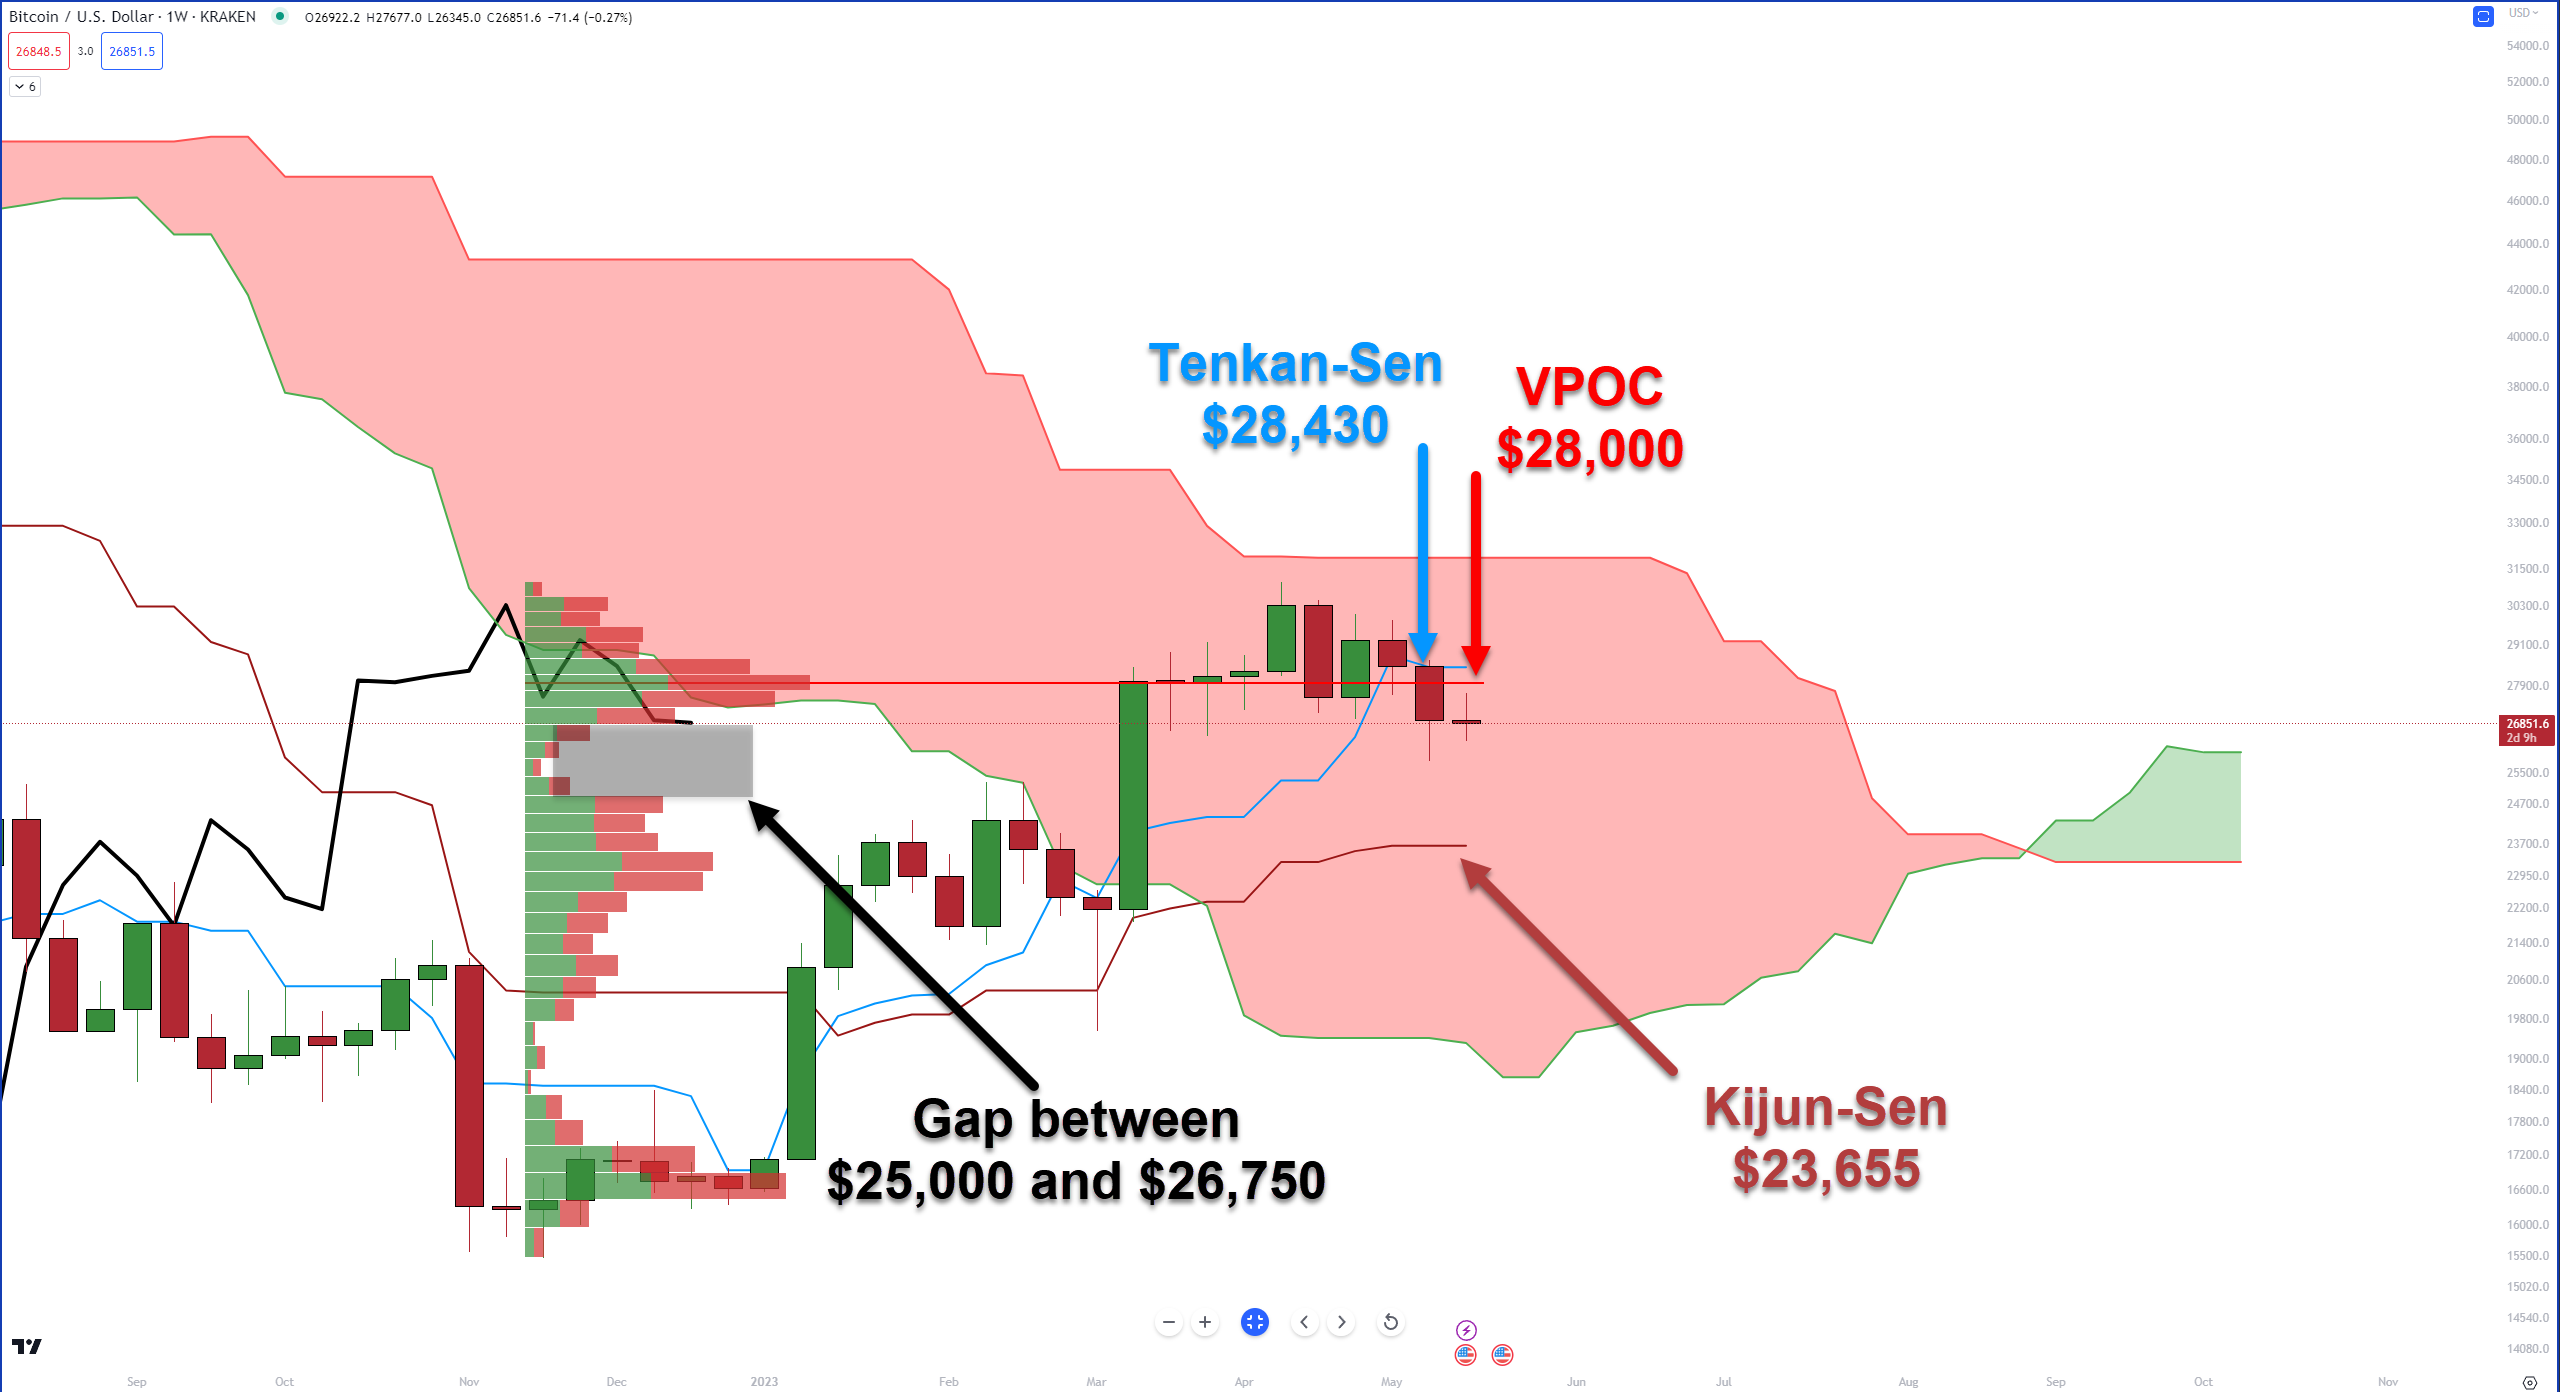
- The red horizontal line on the chart is the Volume Point Of Control (VPOC), which indicates the price level where the most $BTC was bought and sold. The collection of horizontal bars, known as the Volume Profile, begins at the November 2022 lows and shows that the highest volume of Bitcoin trading occurred around the $28,000 price point.
- The Tenkan-Sen, which is slightly above the VPOC at $28,430, is an area where selling activity has been high. In recent weeks, buyers have been unable or unwilling to keep price above this level.
- The Volume Profile between $26,750 and $25,000 shows very little trading activity. This is a sign of weakness and often suggests that if the price falls below $26,750, it could quickly drop to $25,000 in a sort of mini ‘flash’ crash.
- The next area where price might find support is at the weekly Kijun-Sen line, which is currently at $23,655. However, this line could rise closer to the $24,000 – $24,500 range once this week’s trading ends.
Let’s say Bitcoin does drop to the $25k zone, is there anything to support it? 🤷♀️
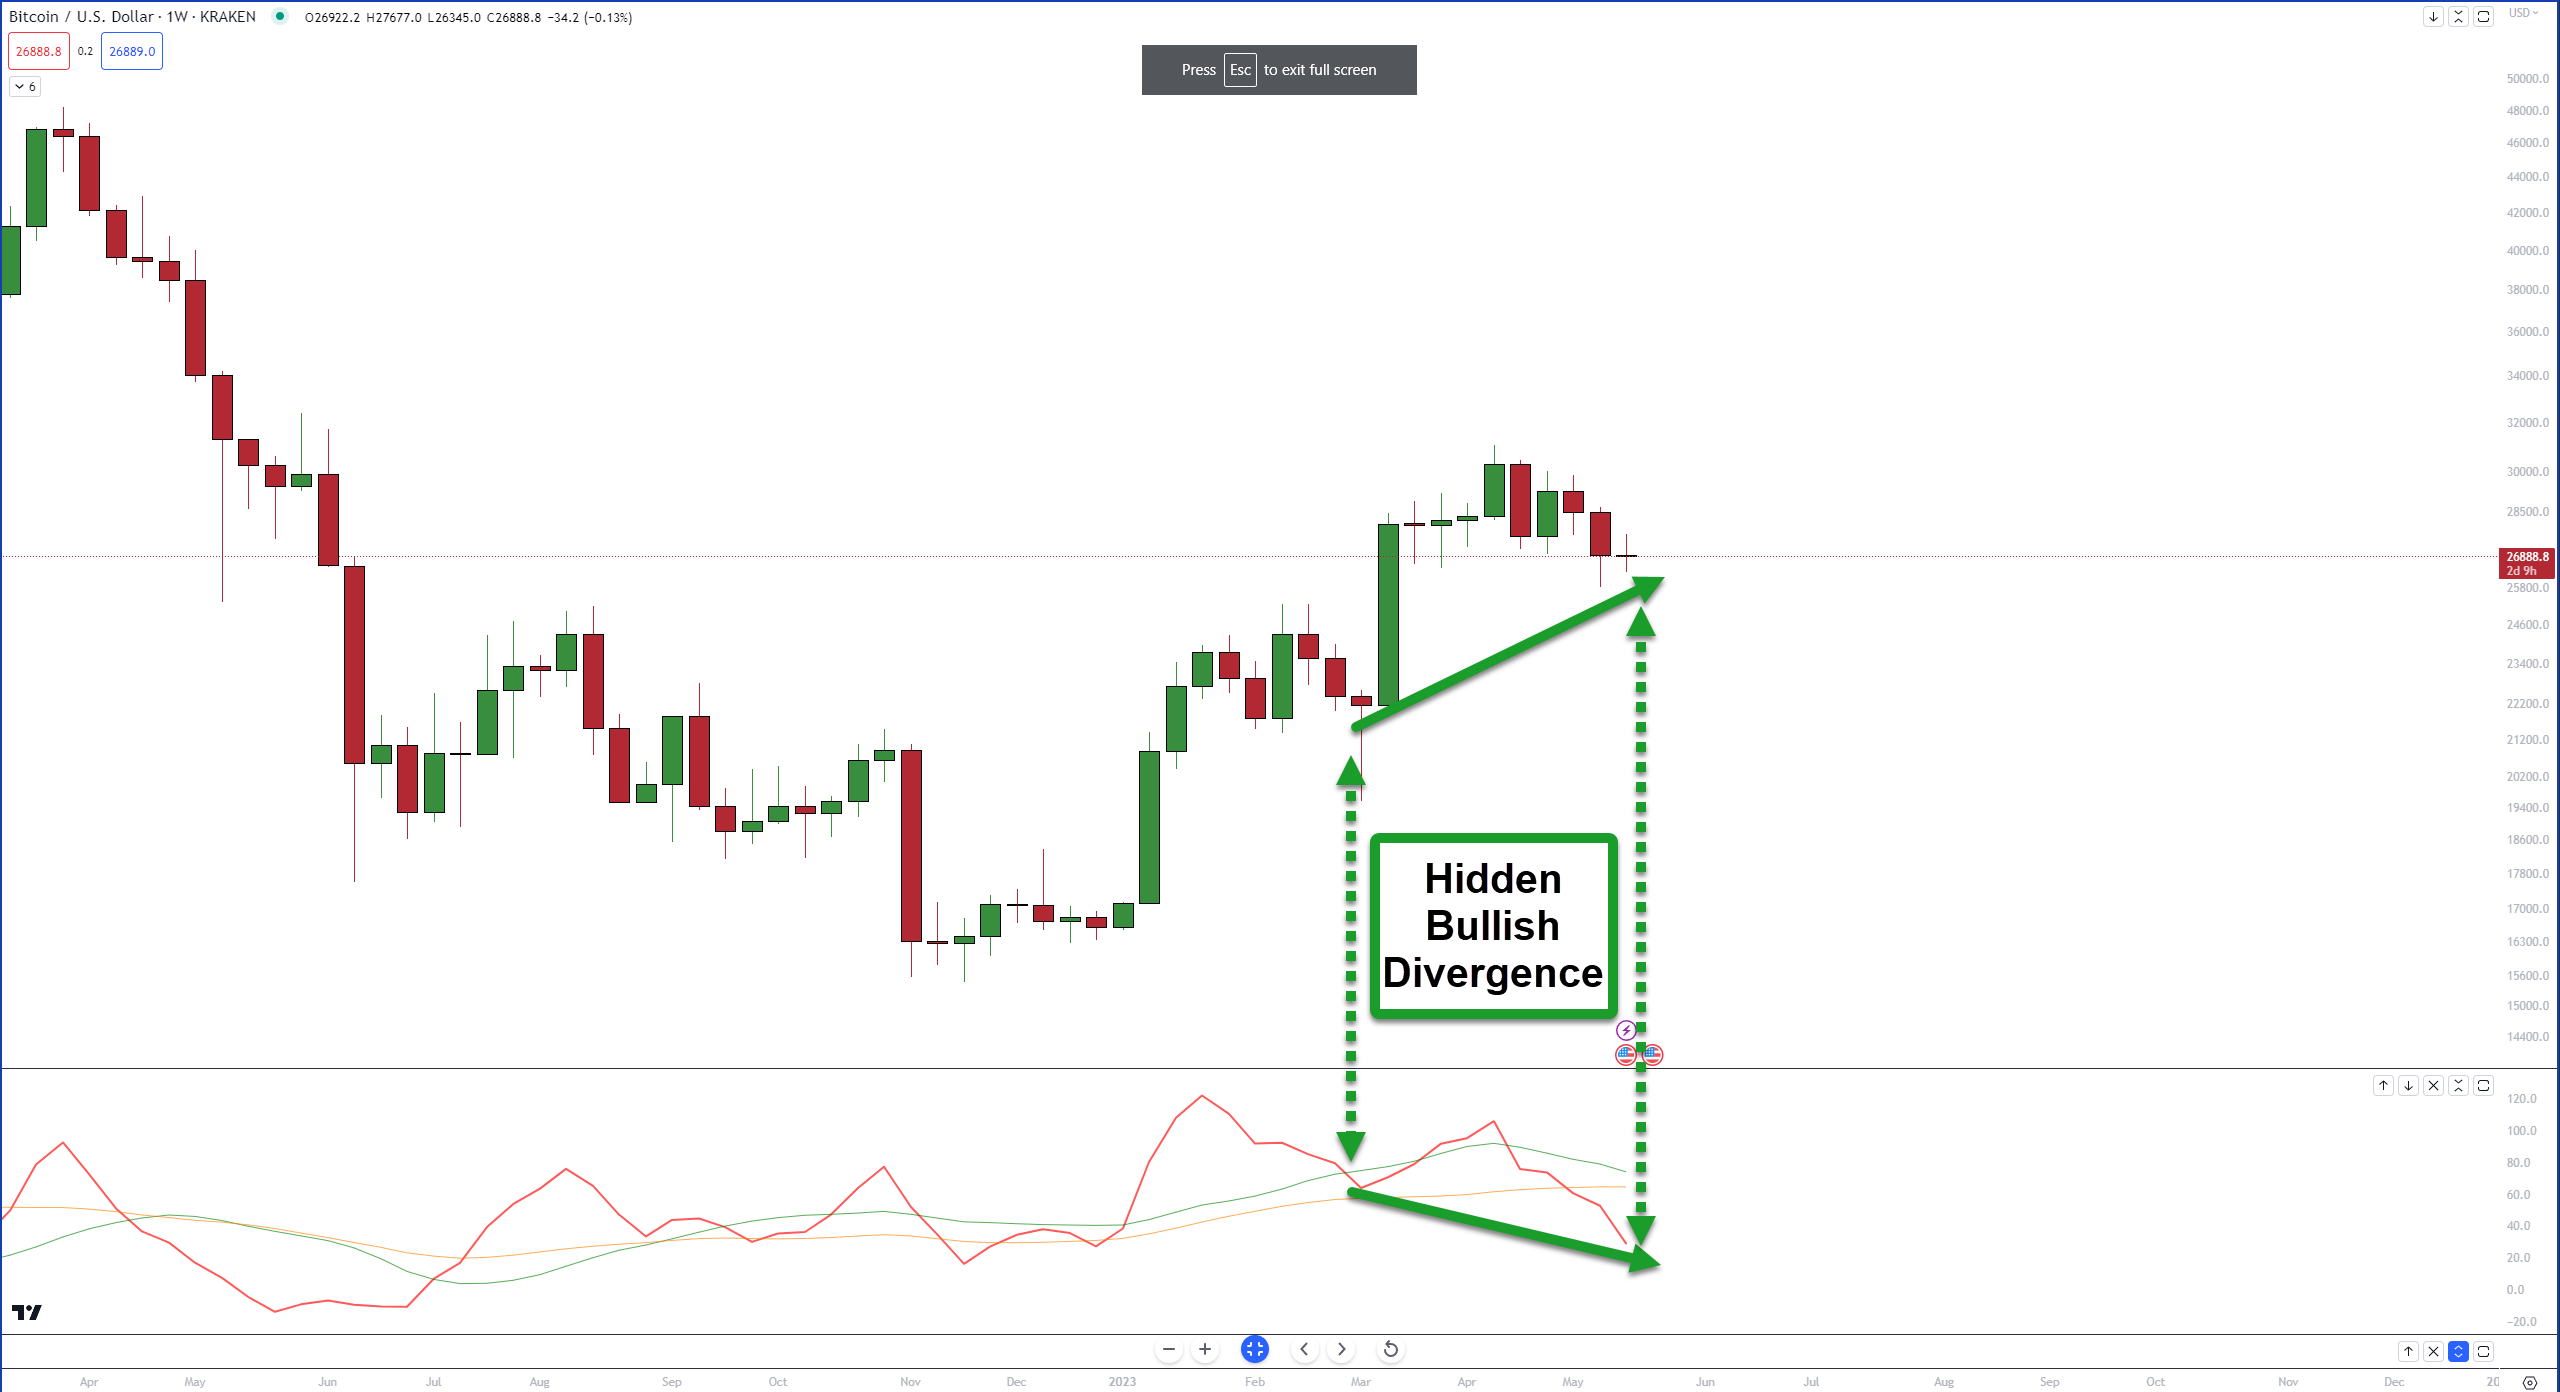
There’s a hidden bullish divergence between the Composite Index and the weekly candlesticks.
In simpler terms, this means that even though the price seems to be pulling back, underlying indicators suggest that the price might actually start rising again soon.
This kind of divergence often occurs during an upward trend or bull market, and it can serve as an early sign that price may continue to rise after the current pullback.
Traders and analysts appreciate hidden divergences because they can hint at a potential continuation of the prior trend. 🍄
TL;DR
- Near-term resistance at $28,000 to $28,500 may be a difficult nut to crack.
- Watch for any daily and weekly close below $26,750, as it could trigger a flash crash to the $25,000 level.