A Red Month for Bitcoin
As we prepare to close the curtains on May, Bitcoin ($BTC) and the broader cryptocurrency market are painting a less-than-rosy picture. Unless there’s an unexpected twist in the tale, we’re looking at a month cloaked in red. 🔻
Now, this isn’t exactly heartening news, especially considering May’s historical performance. Traditionally, May boasts the 4th highest average monthly gain (+50.39%) and has closed positively eight times in the past 13 years.
A Recurring Pattern?
Interestingly, this will mark the third consecutive May to wrap up in the red. On the occasions when May has ended on a down note, the average loss over the past 13 years tallies up to -16.13%. The silver lining? This month’s -7.53% is still beating that average.
Let’s delve deeper with a look at the monthly chart:
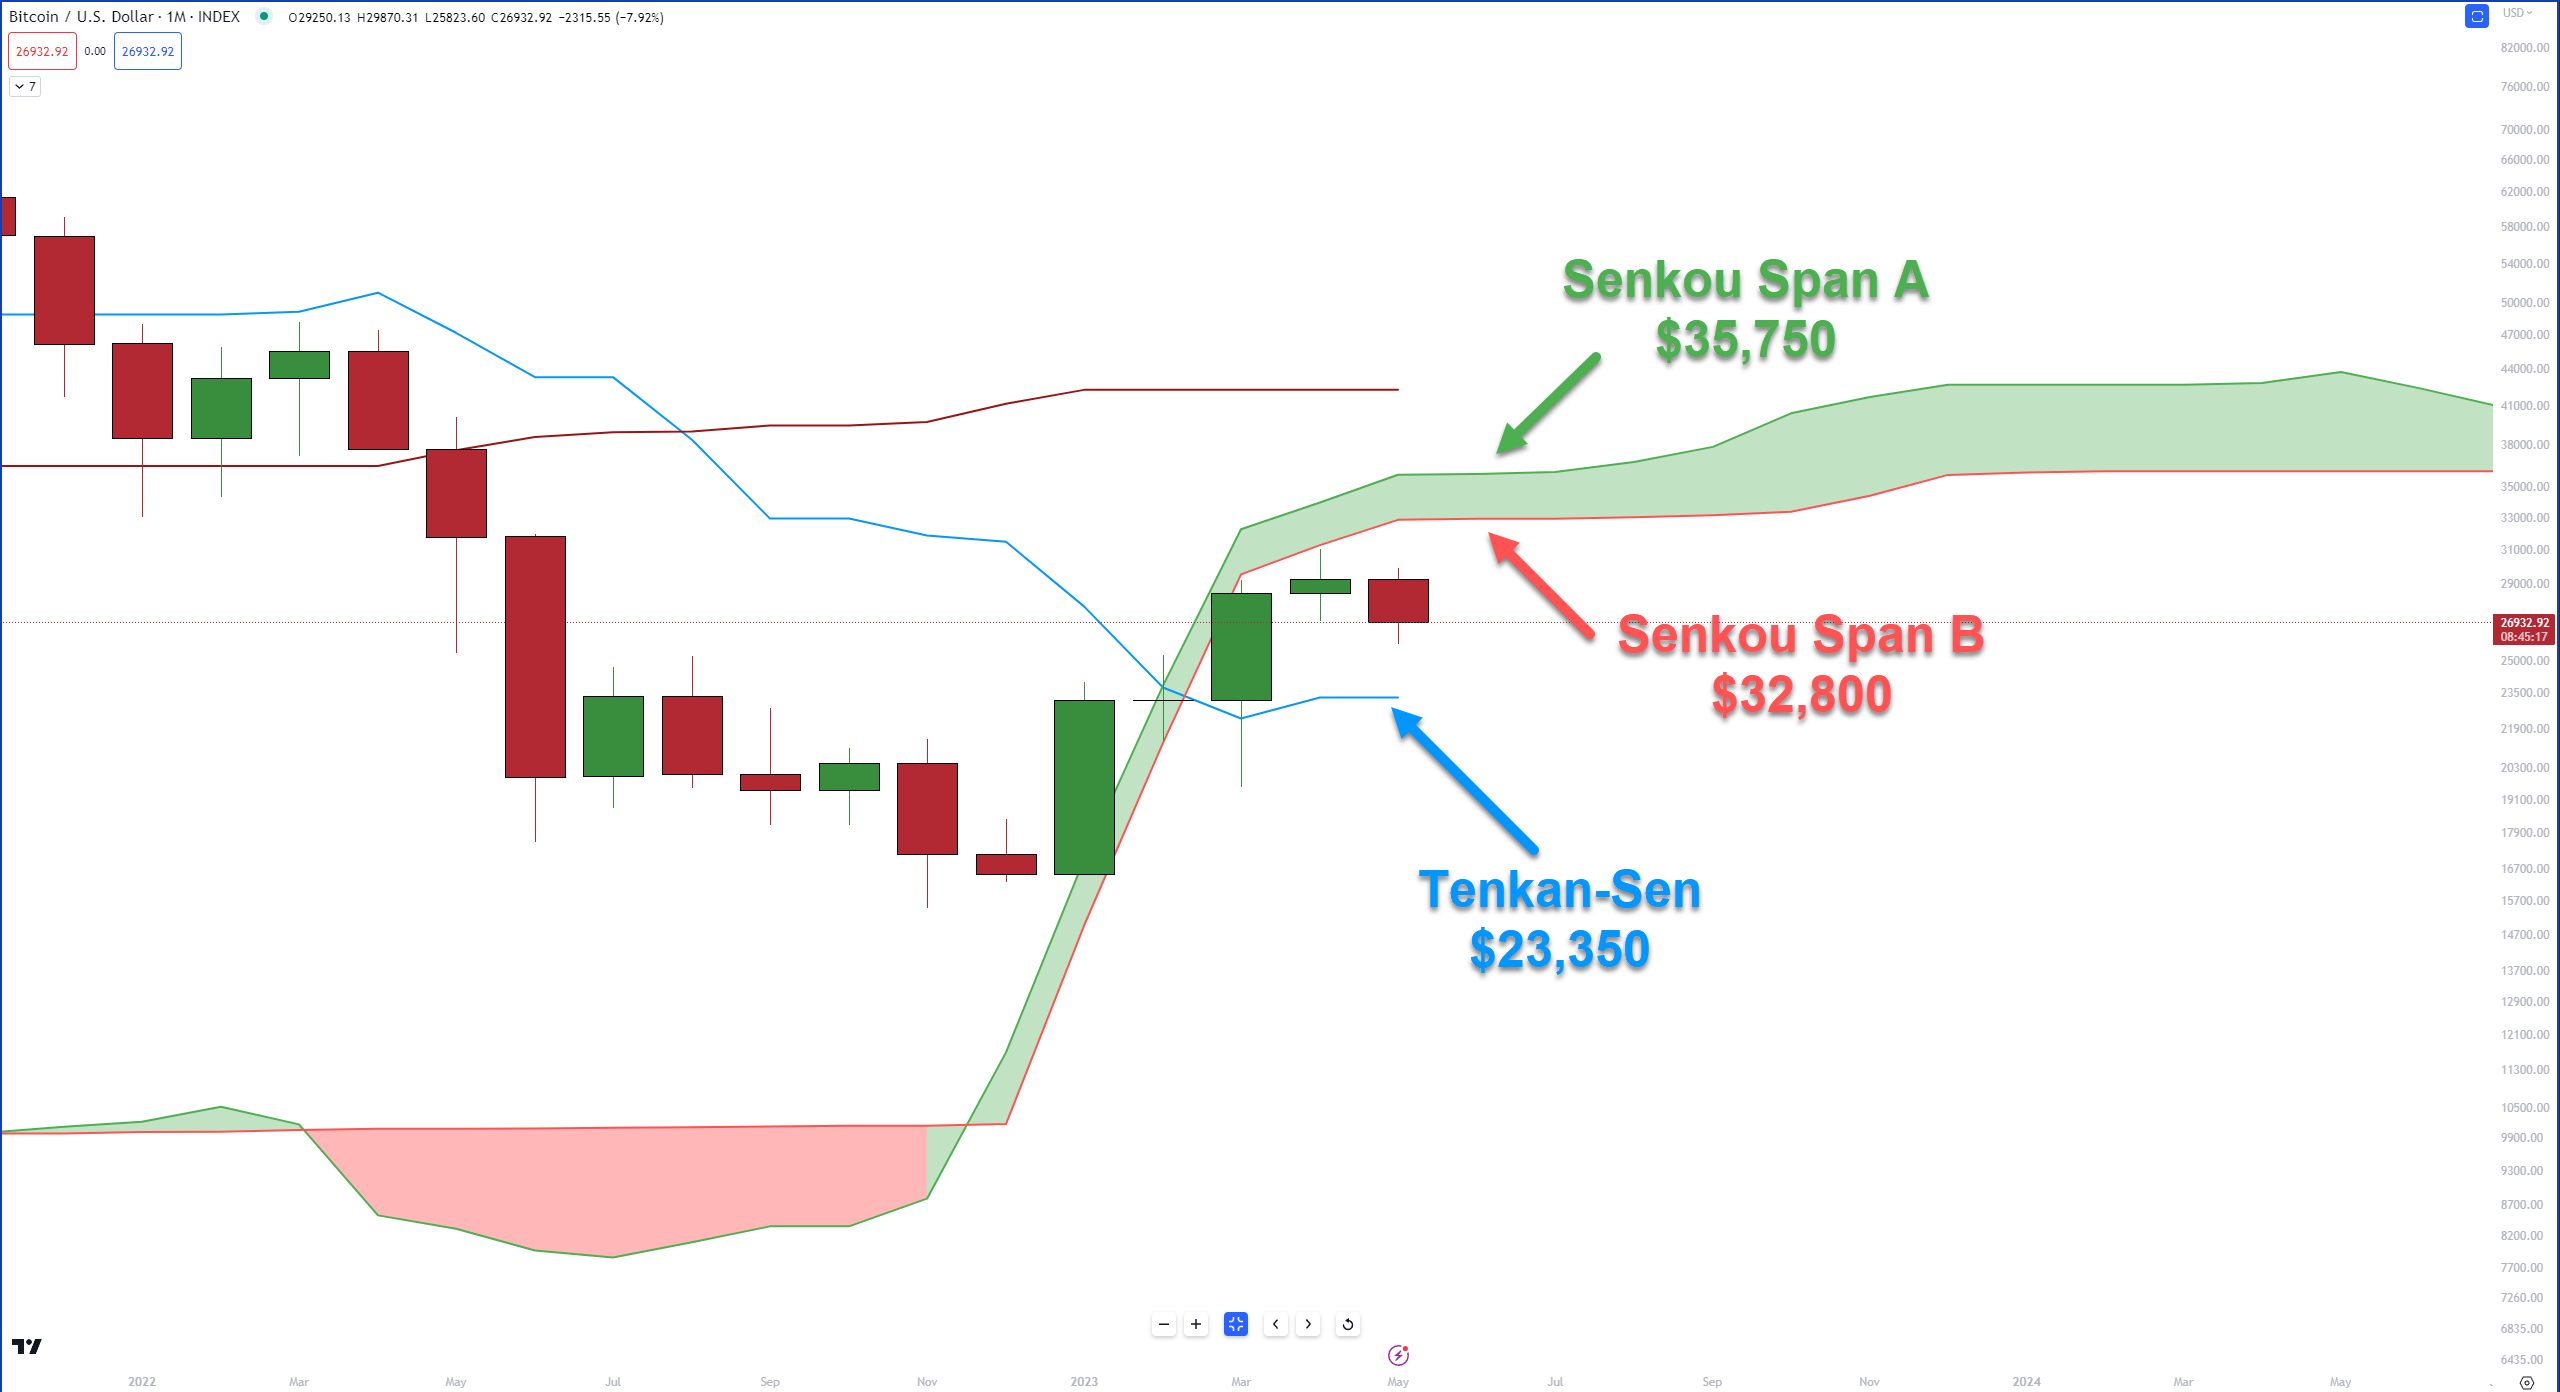
BTCUSD Monthly Chart – Click to enlarge.
Ichimoku Analysis: A Bleak Outlook
For the bullish among us, this chart might make for tough viewing – it’s about as appealing as a pair of socks with sandals. 🩴
April’s close laid the groundwork for May’s downturn, closing below the Ichimoku Cloud (a first since June 2020) and leaving a gaping chasm between the body of the candlestick and the Tenkan-Sen.
This gap is here to stay as we venture into June. The Tenkan-Sen is set to nudge up only slightly, settling in the $23,650 value area.
Bulls Vs. Bears: The Battle Ahead
For Bitcoin bulls, the immediate goal is clear – prevent a monthly close below the Tenkan-Sen. Should this occur, Bitcoin’s monthly chart will bear an uncanny resemblance to some of its most bearish periods: 2014 or 2018. 👀
The bulls’ near-term objective is to ensure June’s monthly close stays above the Tenkan-Sen. For a more significant victory, they’ll need to propel Bitcoin back above the Cloud. To pull this off, Bitcoin needs to close above Senkou Span B ($32,800) and Senkou Span A ($35,750) in June.
Now, let’s switch gears and examine the weekly chart:
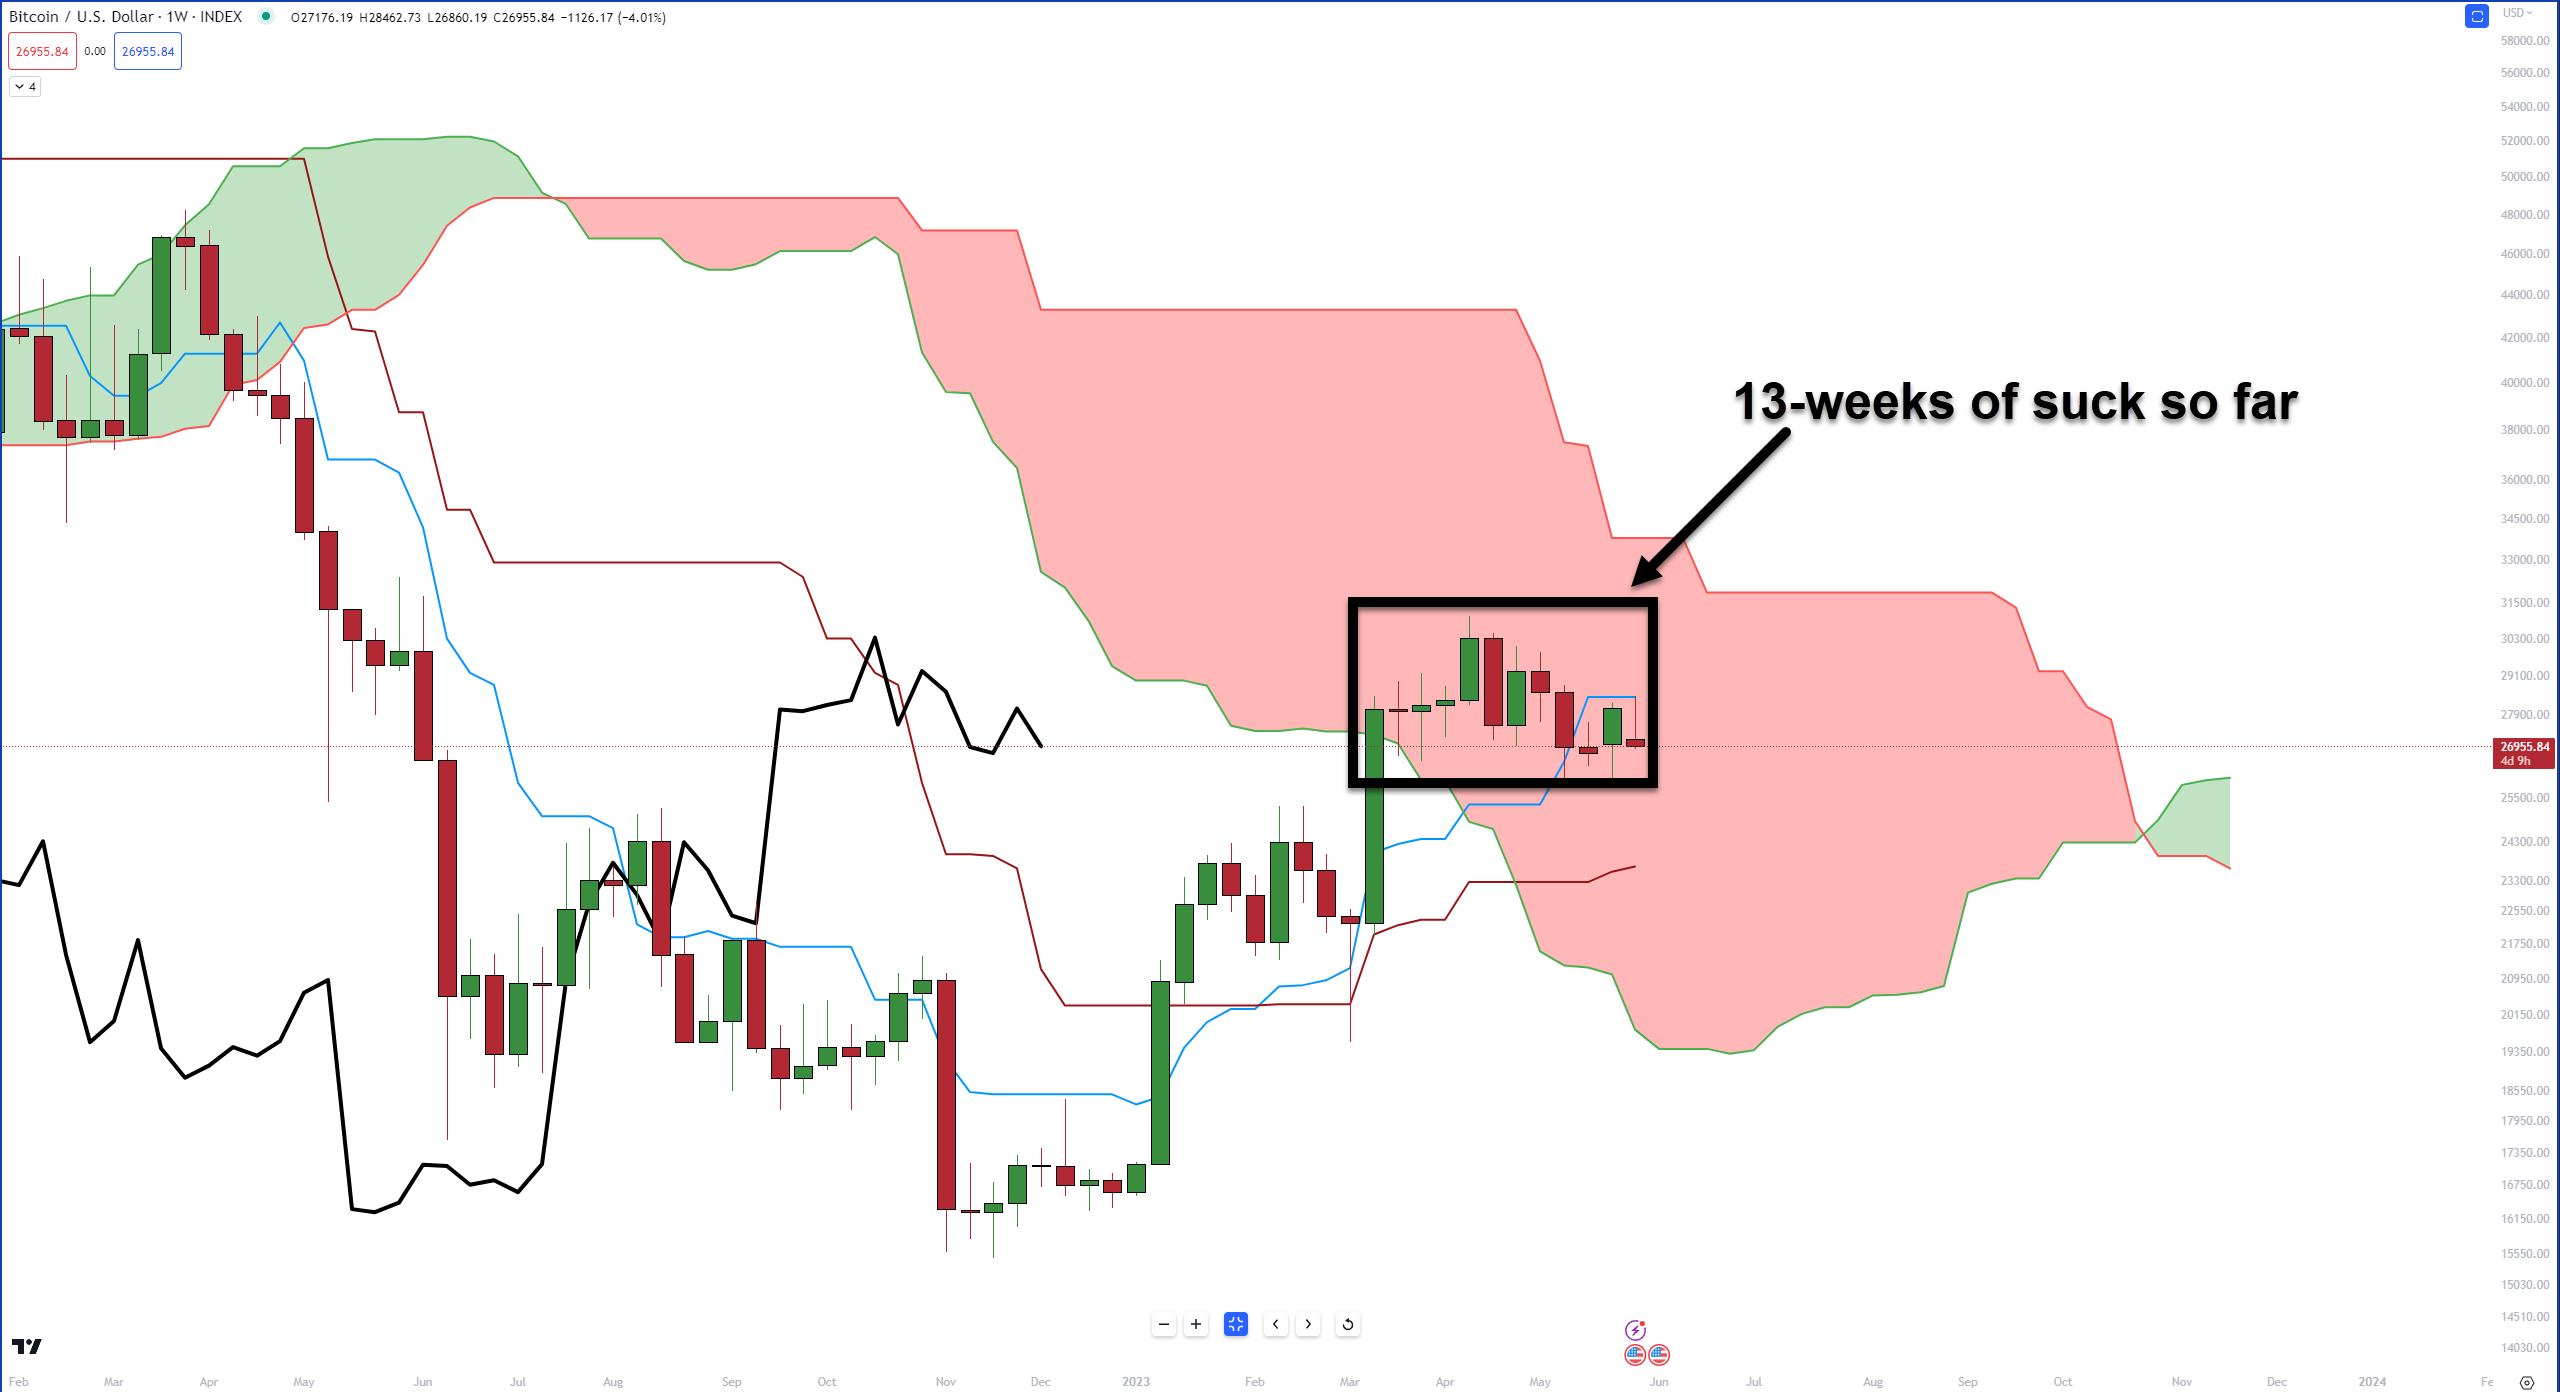
A Weekly Chart Stuck in the Clouds
Since March, I’ve been highlighting Bitcoin’s precarious position on the weekly chart – ensnared in the worst possible zone: the Ichimoku Cloud. ✔️
The Cloud is the embodiment of volatility, indecision, and, frankly, a whole lot of ‘nope.’ It’s a graveyard for trading accounts. Bursting with conflicting bearish and bullish signals, we’re about to embark on our 13th consecutive week of wading through the Cloud.
Until we break free from this predicament, the forecast remains unchanged: Cloudy with a 100% chance of pain. 🌧️