First YoY Decline Since Mid-2020

U.S. new home sales rose 4.1% MoM to an annual rate of 683,000 in April, topping the 669,000 expected by analysts. However, March’s initial 9.6% increase was revised downward significantly to 656,000. 🏘ïļ

The theme investors are watching is that the ongoing lack of existing homes for sale is forcing buyers into new construction. We’ve heard this from builders, who remain cautiously optimistic despite high-interest rates and prices weighing on affordability.

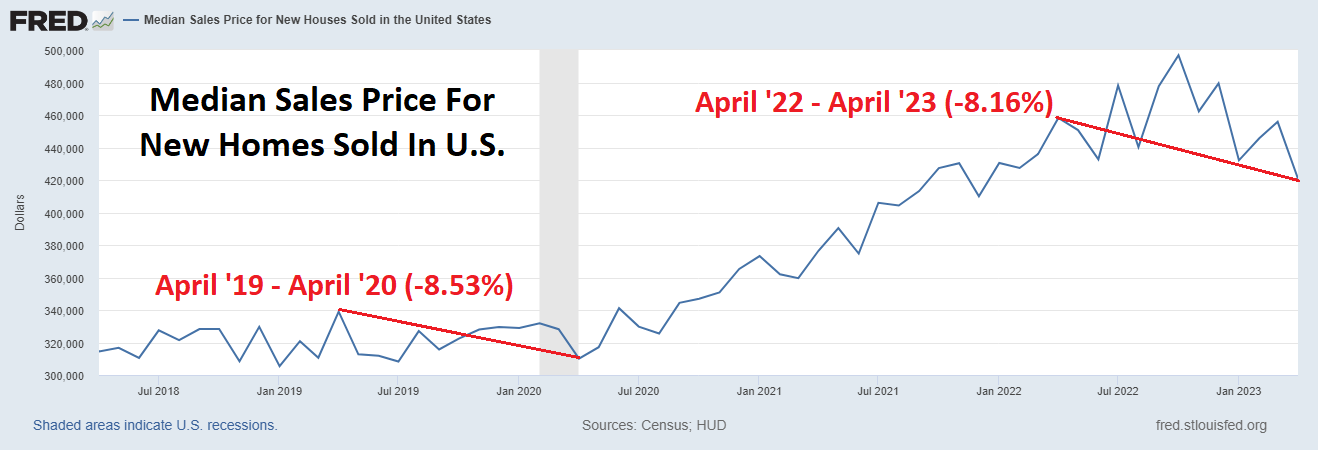
Speaking of prices, there is some positive news for hopeful buyers and the Federal Reserve. 👍

April’s data showed that the median sale price of new homes in the U.S. experienced a YoY decline for the first time since April 2020. New data showed that prices declined 8.16%, nearly matching the last time this data saw an annual decline. It’s currently sitting at $420,800, down from October’s $496,800 peak. ðŸ”ŧ

However, the long-term trend in this housing data shows prices are still above trend. Below we’re looking at the same data over the last thirty years. Clearly, the pandemic housing boom caused prices to rise at a much steeper pace than at other periods in history. 😎

That rise in asset prices and housing spending was a key driver of inflation, so the Fed hopes this data will continue to revert to its historical average. Because if it does, that’ll make the central bank’s fight against inflation a whole lot easier.

So far, Home Depot and other retailers have offered cautious consumer outlooks, expecting the housing market cooldown to continue. We’ll have to see if they’re right, but today’s data further enforces that view. 📝

More in   Economy

View All

Jobs Data Dampers Q1 Rate Cut Odds

While the leading indicators of employment continue to point to a slowdown, coincident indicators like U.S. nonfarm payrolls and ADP employment data continue to surprise to the upside. For stock market bulls, that may be bad news as it takes hopes of a first-quarter rate cut off the table. 😞

As we’ve discussed, much of the market’s recent rally has come on the back of hopes that the Federal Reserve will cut rates as much as six times in 2024. Disinflation continues across most major metrics, but a tight labor market has kept consumers spending and the economy humming along. As a result, Jerome Powell and the Fed have been hesitant to loosen financial conditions too quickly.

Read It

U.S. Jobs Data Back In Focus

The bond market continued to rally during a busy day of economic data, with October’s JOLTs data standing out to investors. Let’s recap it all. 👇

First off, October’s Job Openings and Labor Turnover Survey (JOLTS) signaled a continued slowdown in the labor market. Job openings fell to their lowest level since March 2021, at 8.7 million, while the ratio of openings to available workers ticked down to 1.3:1. That’s well below its peak of 2.0:1 set earlier in the year. 📉

Read It

Producer Prices’ Third Straight Rise

After twelve straight months of year-over-year declines, producer prices have stabilized and are back on the rise these last three months. That, combined with the stickiness in core consumer prices, has investors wondering if inflation could return from the dead. 😎

The headline producer price index (PPI) rose 0.5% MoM and 2.2% YoY in September. Excluding food and energy, core PPI rose 0.3% MoM as services drove the larger-than-expected increase. 🔚

Read It

The War On Inflation Is Won

It wouldn’t be an inflation data day without some drama, so let’s get into what happened. 👇

First off, the headline consumer price index (CPI) rose 0.4% MoM and 3.7% YoY. That was ten bps above estimates, driven primarily by higher energy prices. As for core consumer prices, they rose 0.3% MoM and 4.1% YoY, as expected.

Read It