A green day today after a 25 bps rate hike and Powell’s comments. 🔴
Market participants continue to digest the rate hike – but the news on hikes isn’t done. The ECB and BoE interest rate decisions are tomorrow.
In today’s Litepaper, we’re diving in elbows deep into why January 2023 was so important, what to look out for with $BTC.X, and a very detailed look at $ETH.X, $LTC.X, and $ADA.X.
And no Bullets From The Day today because this Litepaper is biiiiiiiiiiig.
Here’s how the market looked at the end of the trading day:
| Cosmos (ATOM) |
$14.54
|
10.82% |
| Litecoin (LTC) | $97.84 | 5.21% |
| Filecoin (FIL) | $5.47 | 4.99% |
| Polygon (MATIC) |
$1.15
|
3.39% |
| Ethereum (ETH) |
$1,620
|
2.42% |
| Solana (SOL) | $24.29 | 2.38% |
| NEAR Protocol | $2.34 | 2.10% |
| Avalanche (AVAX) | $20.02 | 1.71% |
| Bitcoin (BTC) | $23,735 | 1.52% |
| Ethereum Classic (ETC) |
$21.94
|
1.50% |
| Altcoin Market Cap |
$564 Billion
|
1.05% |
| Total Market Cap | $1.016 Trillion | 1.16% |

January 2023 was the best month for Bitcoin (and the broader crypto market) in over 15 months. 👍
How have previous Januarys faired?
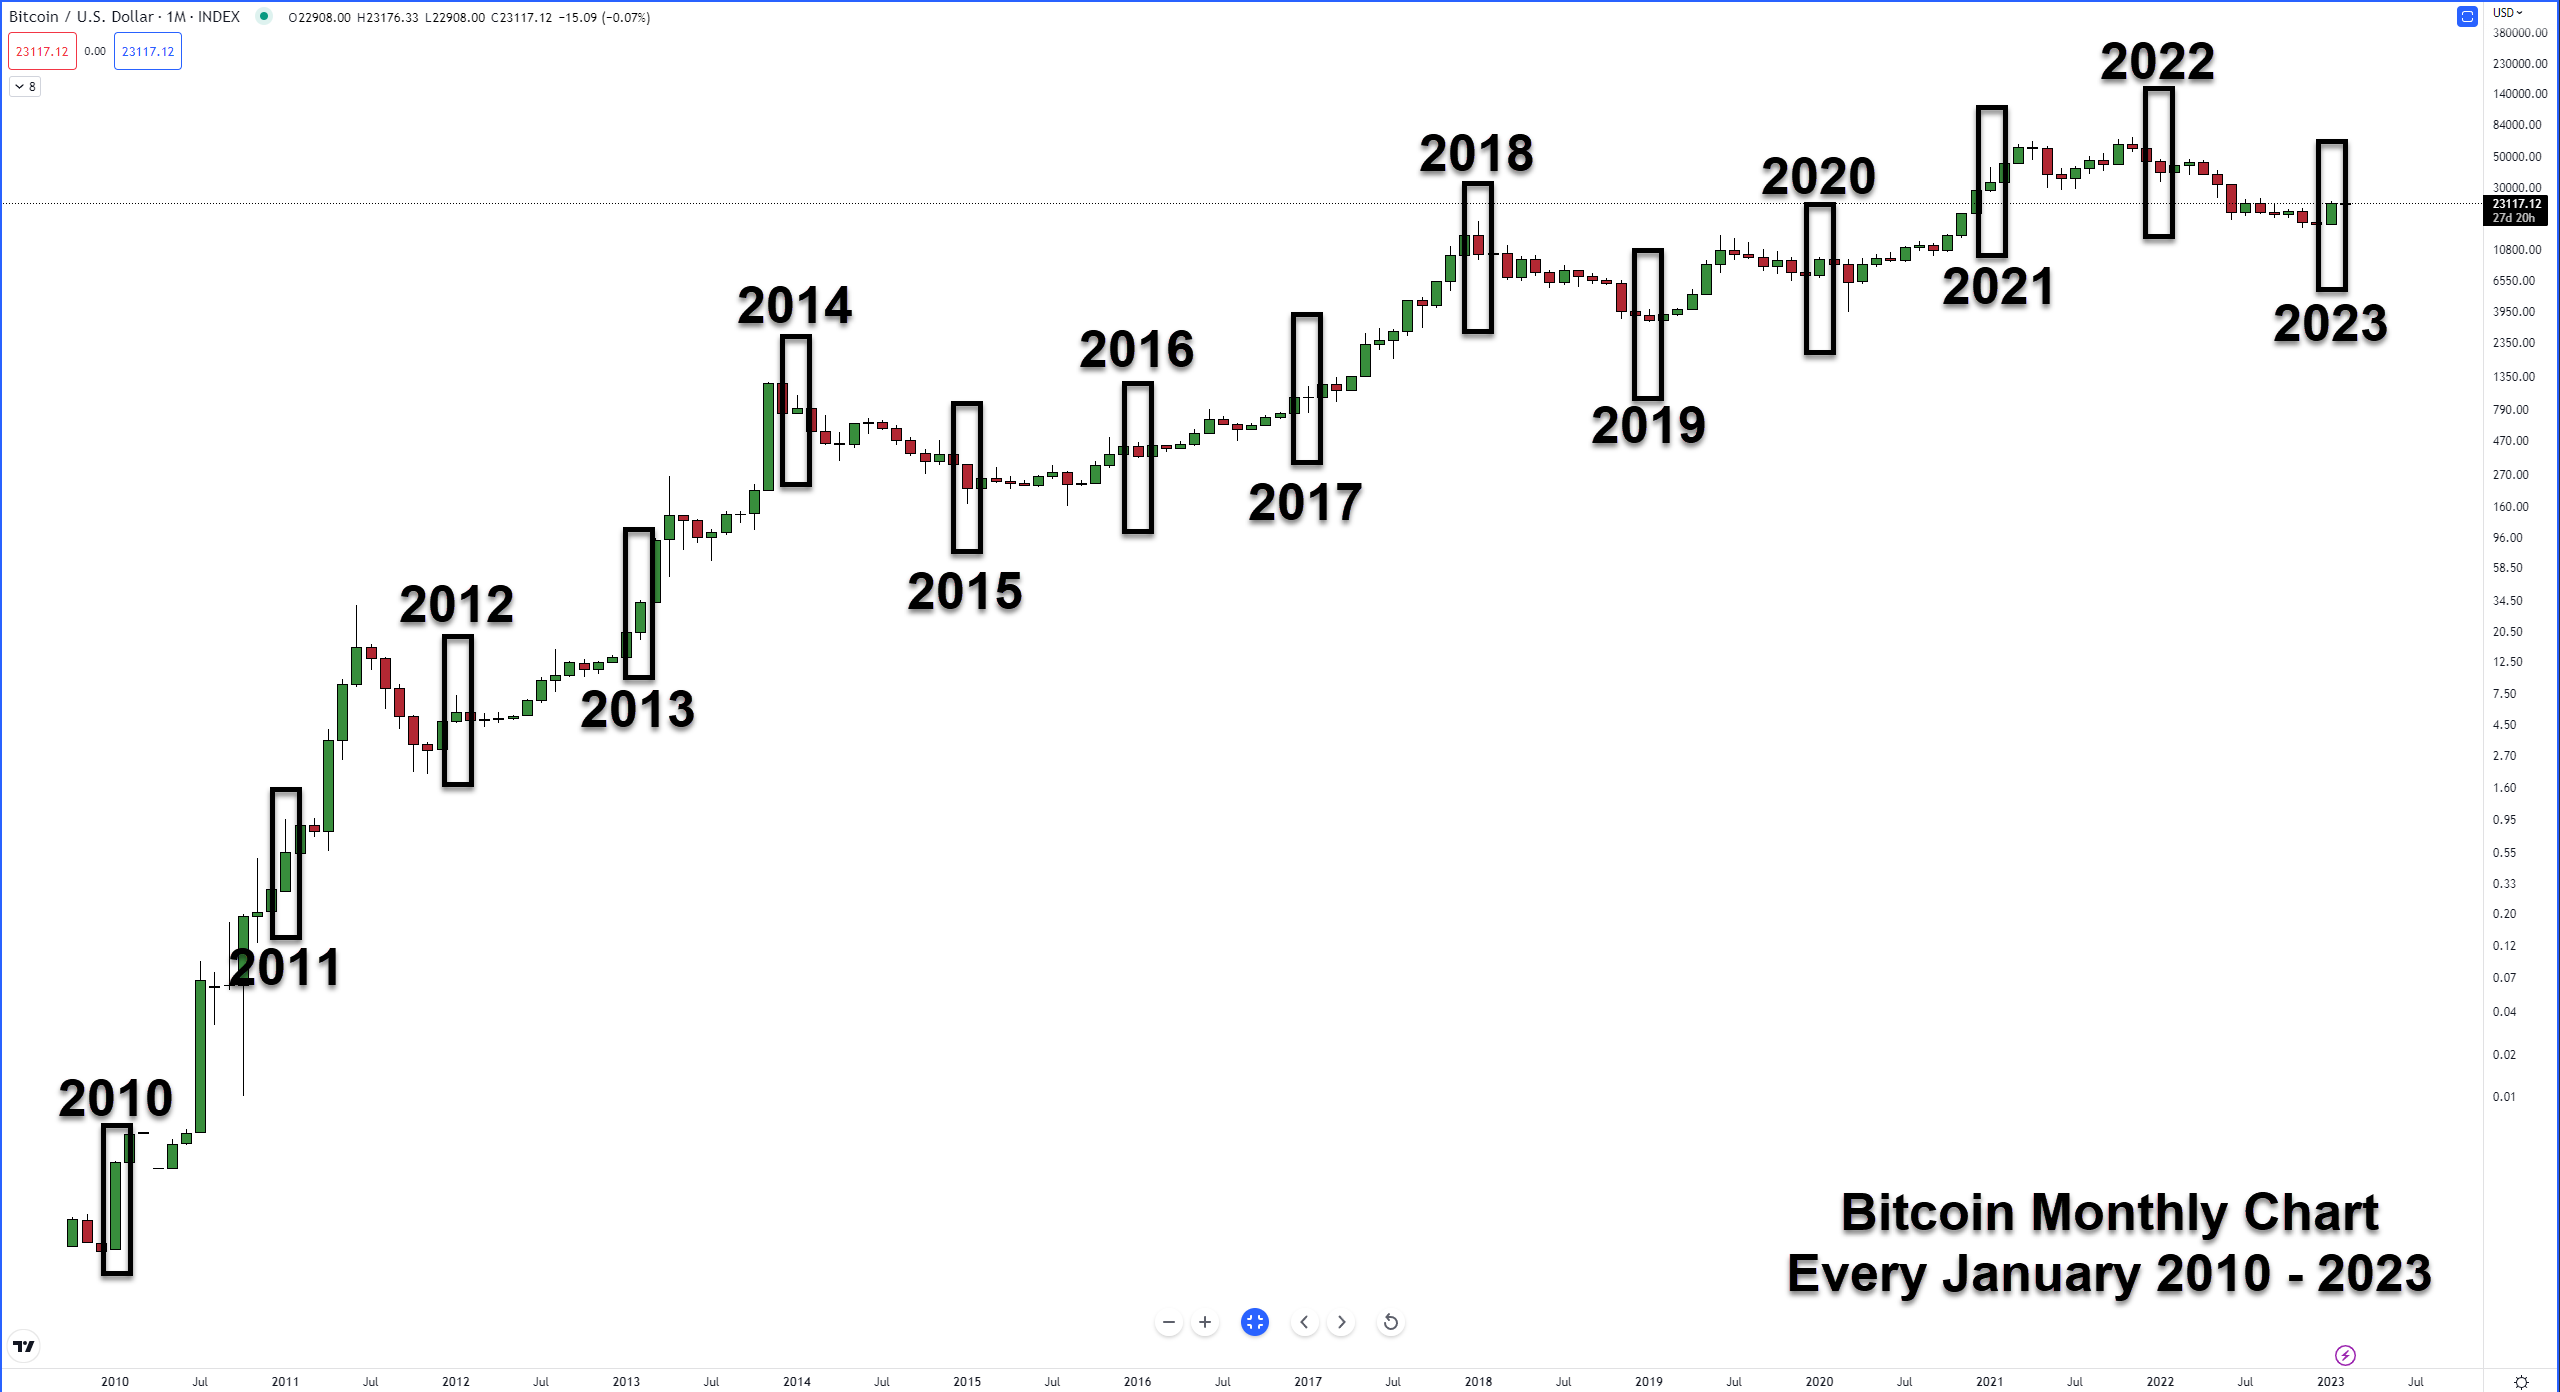
Let’s take a look at all of the Januarys Bitcoin has traded in going back to 2010:
- Jan 2010 +378.85%
- Jan 2011 +83.33%
- Jan 2012 +16.13%
- Jan 2013 +7.52%
- Jan 2014 +8.92%
- Jan 2015 -33.04%
- Jan 2016 -14.80%
- Jan 2017 -0.17%
- Jan 2018 -27.16%
- Jan 2019 +11.16%
- Jan 2020 +30.22%
- Jan 2021 +14.35%
- Jan 2022 -16.66%
- Jan 2023 +39.95%
Some key takeaways:
- 9 out of 14 January months closed in the green (64%) vs. 5 out of 14 (36%).
- Excluding January 2010, January 2023 was the second-best-performing January ever.
- January 2023’s close was the highest monthly close in 6 months.
- January 2023 was the best-performing month since October 2021. 😲
As January Goes, So Goes Stonks… And Maybe Bitcoin?
You may or may not have heard of some beliefs/theories from the stock market related to January: the January Effect and the January Barometer.
The January Effect is a belief that January is often one of the best performing for stonks (especially for small caps) – in both absolute and risk-adjusted returns, but the past 15-ish years may point to a change in that theory.
“As goes January, so goes the year.” That stock market phrase comes from a theory known as the January Barometer. 🌡️
The January Barometer is a belief that if the S&P 500 ends in the green for January, then the year will end in the green. From the 1950s to the 1980s, there was a roughly 70% correlation between a green January ending with a year in the green. After the 1980s, though, it’s now around 50-ish percent.
There are a metric crap ton of opinions on what January ‘means’ for stocks, bullish or bearish. Still, the above explanation should give you a little idea of how January is sometimes perceived in the stonk market.
Bitcoin’s existence isn’t even a blink of an eye compared to how long the stock market has existed – but have past Januaries for Bitcoin been an indicator of how the year will go? Let’s see:
- 2010 – Green January, Green Year
- 2011 – Green January, Green Year
- 2012 – Green January, Green Year
- 2013 – Green January, Green Year
- 2014 – Green January, Red Year
- 2015 – Red January, Green Year
- 2016 – Red January, Green Year
- 2017 – Red January, Green Year
- 2018 – Red January, Red Year
- 2019 – Green January, Green Year
- 2020 – Green January, Green Year
- 2021 – Green January, Green Year
- 2022 – Red January, Red Year
- A green January coincided with a green year 7 out of 8 times.
- A red January coincided with a red year 2 out of 5 times.
The limited data suggest a strong probability of a green January coinciding with a green year.
But there are two keywords in the sentence above: limited-data. Not a lot of history to go off of.
It’s anybody’s guess where crypto will end up in 2023. 🤷♂️

There are several important conditions for $BTC.X within the Ichimoku Kinko Hyo system that Bitcoin has present. 📢
First, let’s look at where Bitcoin started in January.
Also, if you want to skip all fancy schmancy Technical Analysis, scroll down to the Putting It All Together summary.
In the January 4, 2023, Litepaper, we looked at a rare condition on Bitcoin’s monthly chart I call Patel’s Two Clouds Theory. I wrote:
In Manesh Patel’s book, Trading with Ichimoku Cloud: The Essential Guide to Ichimoku Kinko Hyo Technical Analysis, Patel calls attention to an Ichimoku phenomenon that no other modern Ichimoku analyst has called attention to in book form. This is what he observed:
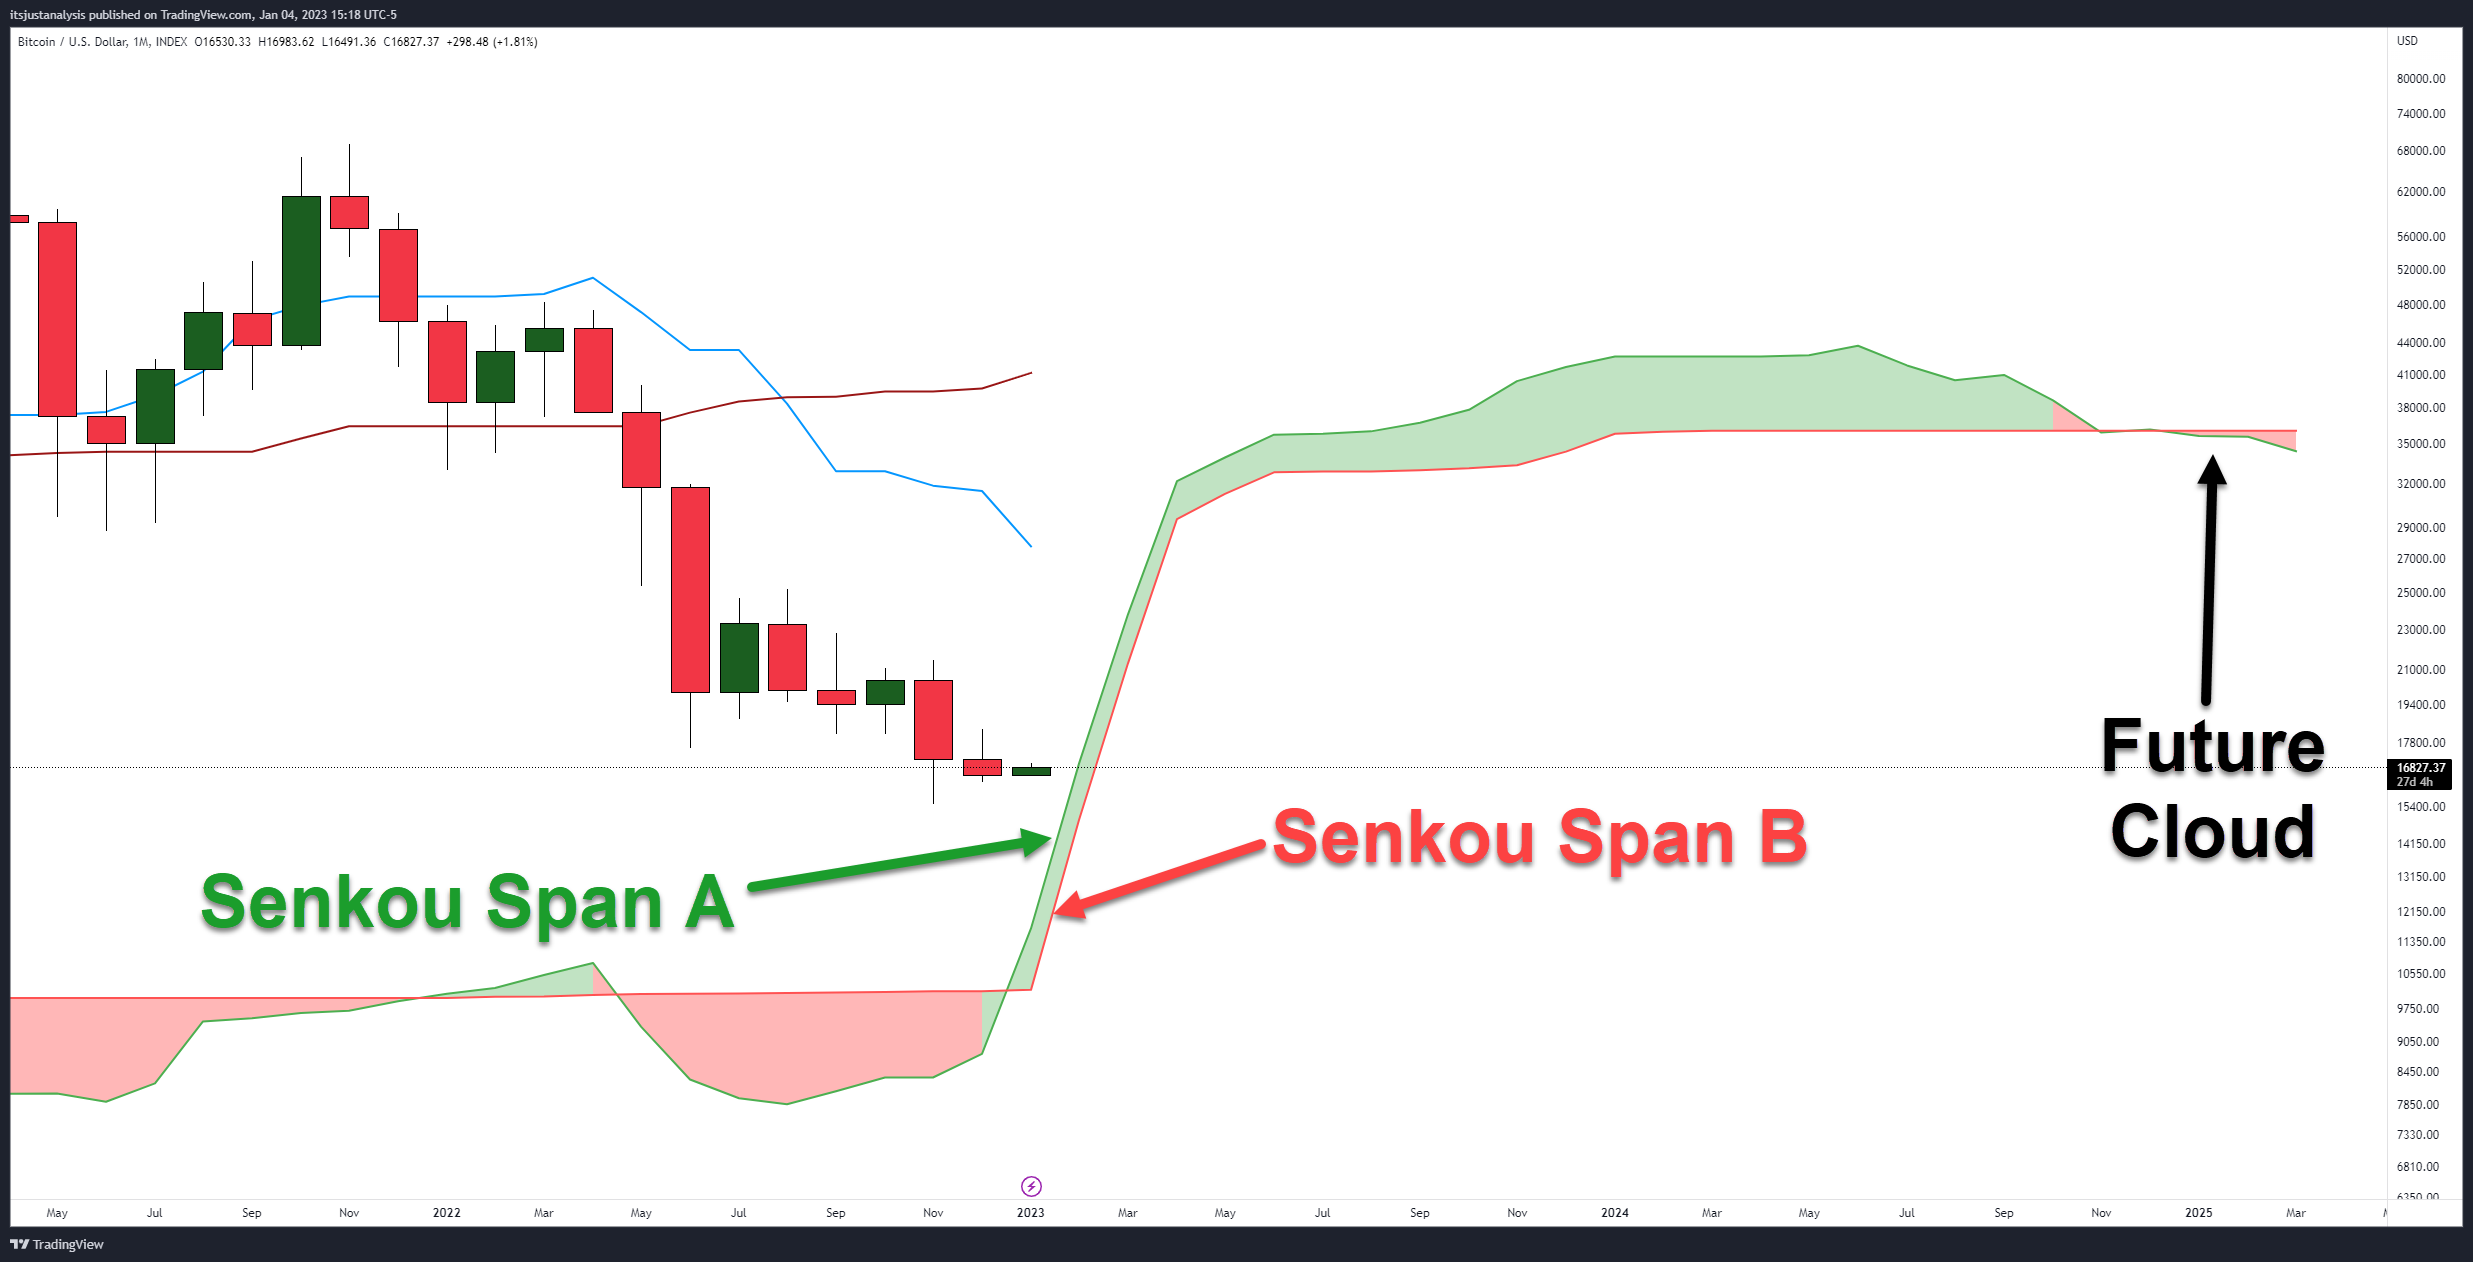
When a major trend change occurs, the Future Cloud is thin, with both the current Senkou Span A and Senou Span B pointing in the direction of the Cloud.
It’s a rare condition that is currently present on Bitcoin’s monthly chart:
The image below from January 4, 2023, shows where Bitcoin was trading and that the monthly chart was positioned for Patel’s Two Clouds Theory.
Fast forward to the end of January 2023, and this is what Bitcoin’s monthly chart looks like now:

There are several important price levels that Bitcoin will need to respect to maintain a bullish outlook. 👁️🗨️
The Cloud
Primary support is at the Cloud itself. Senkou Span A ($16,973) and Senkou Span B ($14,937) represent both the near-term monthly support (Senkou Span A) and strongest level of support (Senkou Span B).
Failure to close February above Senkou Span B ($14,937) could trigger a resumption of the bear market.
Word of warning for the bulls: thin Clouds represent weakness. It is very easy for price to move through a thin Cloud.
The Chikou Span
Out of all the conditions on the monthly chart for Bitcoin, the Chikou Span’s position is probably the most important for February. 📣
For bulls, one of the most sought-after conditions is for the Chikou Span to remain above the bodies of the candlesticks and in open space (a condition where it wouldn’t intercept any candles horizontally over the next five to ten periods).
When the Chikou Span drops below or ‘inside’ the bodies of the candlesticks and price is above the Cloud, it is a warning sign that consolidation or a test lower may happen soon.
If bulls want to see Bitcoin continue moving higher without a lot of headaches, they’ll need to push for a February close that puts the Chikou Span above $28,980.
The Tenkan-Sen
Near-term resistance for Bitcoin on the monthly chart in January was $27,753 – but now it has slid lower to $23,713, almost right on top of where February opened.
The massive gap between the candlesticks’ bodies and the Tenkan-Sen is now resolved. In other words, in the short term, Bitcoin has returned to equilibrium.
If bulls close Bitcoin above the Tenkan-Sen, it will be the first monthly close above that level in over 15 months – since November 2021.
Kumo Twist
Not much to write about here, but important to keep an eye on. Depending on how Bitcoin trends over the next 22 months, November 2024 may be an important inflection point. ⏱️
Composite Index And RSI

Regular bearish divergence is present between the candlestick chart and the Composite Index. It’s a warning that the current upswing could be overdone.
However, the RSI – which remains in bull market conditions – remains between the 50 and 40 oversold levels. Bitcoin’s monthly RSI made a new all-time low on December 2022.
Putting It All Together
To prevent further losses, Bitcoin must pull off some consistent bullish pressure throughout the year.
If Bitcoin closes below the Cloud, that will put the Chikou Span below the bodies of the candlesticks, putting Bitcoin into a condition where it would experience a very high probability of testing the $10,100 value area. 😶
Now let’s look at some of the major altcoins. Unfortunately, few altcoins have existed long enough to have a complete monthly Ichimoku chart.
$LTC.X is one of the oldest altcoins, and it just fulfilled a complete monthly chart after January 2023 closed! So in the absence of a full monthly Ichimoku chart, we will look at the 3-week, 2-week, or 1-week charts.
Litecoin
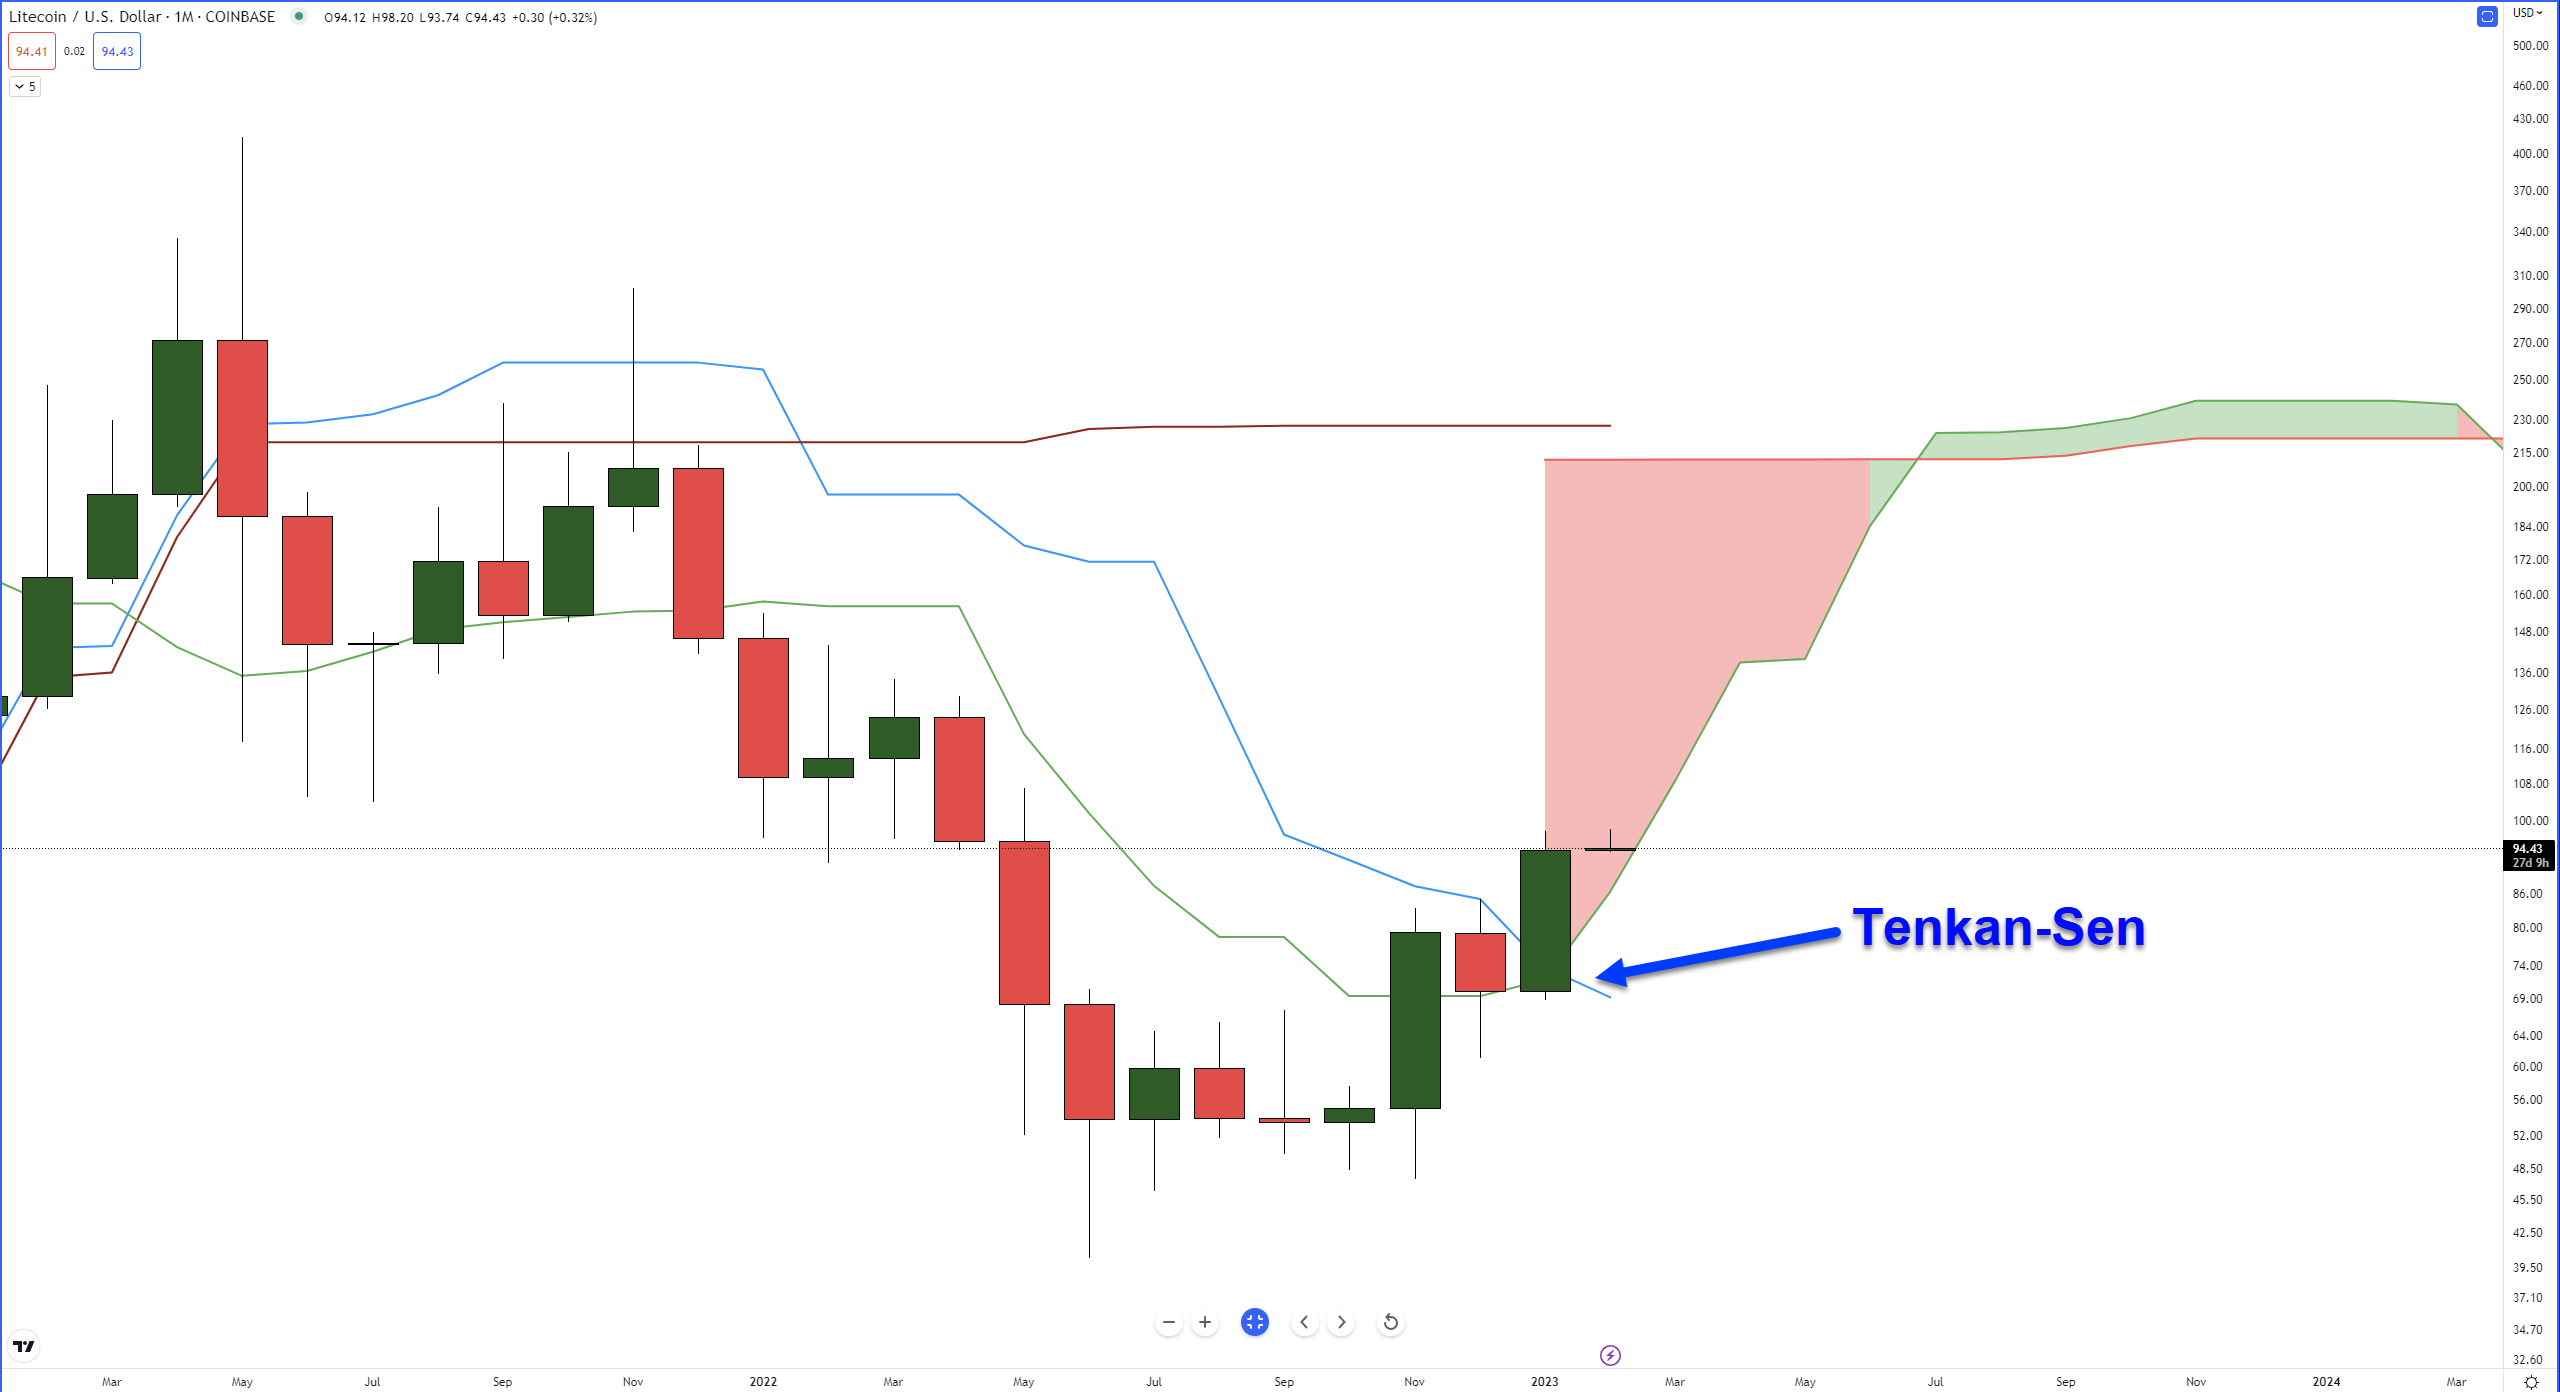
At first glance, it’s surprising how Litecoin has performed compared to the broader market over the past four months. Since October 2021, LTC has continued to drive higher.
January 2023’s close did two important things for Litecoin: it returned Litecoin above the Tenkan-Sen and back inside the Cloud. It is the first time LTC has closed above the Tenkan-Sen on the monthly chart since April 2021- 21 months. 😱
But the Cloud is a horrible place. The Cloud represents indecision, volatility, Vladimir Putin, STDs, broken hearts, and dreams. The Cloud is where trading accounts go to die.
It will likely be a messy 2023 if LTC stays inside the Cloud.
Ethereum

If $BTC.X is the barometer for the entire cryptocurrency market, then $ETH.X is the barometer for the altcoin market. 🪙
While Bitcoin’s chart shows it’s stuck against its monthly Tenkan-Sen, Ethereum is now above the monthly Tenkan-Sen for the first time since December 2021 – 14 months.
From a support perspective, the Tenkan-Sen is now the closest and most immediate level at $1,455. Below that, it’s the top of the Ichimoku Cloud (Senkou Span B) at $800.
Senkou Span B is the strongest level of support/resistance in the Ichimoku system, and the longer it is flat, the stronger it is perceived to be.
Immediate resistance within the Ichimoku system is the Kijun-Sen at $2,698.
Bulls might not want to see a massive rally for Ethereum in February because of a Kumo Twist in March 2023.
Cardano
If you want to see one hell of an ugly long-term chart, $ADA.X is the chart for you. 😖

Cardano is one of those altcoins that doesn’t have a complete monthly Ichimoku chart, so we’re going with the 3-week.
While Ethereum and Litecoin may be above their monthly Tenkan-Sen levels, Cardano hasn’t closed above the 3-week Tenkan-Sen since October 2021 – 15 months.
However, the most recent 3-week candle closed up +50.40%, the best close since August 2021 – 18 months.
The Tenkan-Sen at $0.382 (insert Fibonacci joke) is the most immediate near-term resistance, but above that, the bottom of the Cloud at $1.58 is the strongest resistance level.
If Cardano continues to make higher closes on the 3-week chart, it will eventually run into the Kijun-Sen, which will probably be around the $1.00 level when price tests it.
But there’s more to the Ichimoku Kinko Hyo system than the indicators. Ichimoku has its own Time, Wave, and Price Principles (known as The Three Principles).
And this is where the Ichimoku analysis goes into overdrive. 🏎️
Kihon Suchi – ‘Day of the turn.’
In a nutshell, Kihon Suchi is the Timespan Principle put into practice. It is similar to using Gann’s cycles of the Inner Year or horizontal Point & Figure counts to identify market turns.
Simply put, Kihon Suchi says that the number of candlesticks and swings in the most recent trend can help identify when a future turn in the market could occur.
Certain numbers are also important in the Ichimoku Kinko Hyo system, 9, 17, 26, 33, 42, and so on.

If we look at Cardano’s monthly chart (yes, the monthly now), the last bull run from March 2020 to August 2021 was 18 candlesticks long. In the Time Span Principle, that number is 16 – one away from the Ichimoku number of 17.
So, theoretically, 16 candlesticks from August 2021 is where a turn in the market has a high probability of occurring. January 2023 was 18 candlesticks from August 2021 – again, one number away from the Ichimoku number 17.
Wave And Price Principles
Again, without diving into the nitty gritty, all we need to know is that Cardano’s monthly chart shows what’s known as an N Wave Pattern in the Ichimoku system.

From there, analysts using the Price Principle can project the price level where they believe $ADA.X will go next – $2.98.
Putting It All Together
Ichimoku analysts indicate the next price level of importance for bulls is just a hair below the $3.00 level.
Utilizing the Kihon Suchi, May 2024 is where bullish analysts would expect the $2.98 to be found or, more importantly, where a new and important swing, low or high, develops.
Other important dates using Ichimoku numbers are September 2023 (9), February 2025 (26), and September 2025 (33).
Links
Links That Don’t Suck:
🧷 How You Can Prevent Hackers From Stealing Your NFTs
🙏 Some hope on the horizon for victims of Celsius collapse
🛳️ Why Ark Invest Believes Bitcoin Could Emerge As Multi-Trillion Dollar Market
🚔 US Blacklists Bitcoin, Ether addresses tied to Russian sanctions-evasion efforts
👮 Federal judge bars SBF from contacting FTX and Alameda employees via Signal
🎮 EA cancels mobile Apex Legends and Battlefield games, shutters Industrial Toys studio
💊 GoodRx illegally shared health data with tech giants to target ads, government alleges
🤖 Silicon Valley is old news. Welcome to ‘Cerebral Valley’ and the tech bro morphing into the AI bro
Credits & Feedback
Today’s Litepaper was written by Jon Morgan. Let him know how he did: