To wrap up an earnings and fundamental-news-packed week, we will highlight a chart making the rounds among the technical analysis community. 📈📉
Today we’re highlighting a concept called polarity, which we highlighted back in early June when the market reversed from current levels. Essentially the idea means that areas of support become resistance when broken and vice versa.
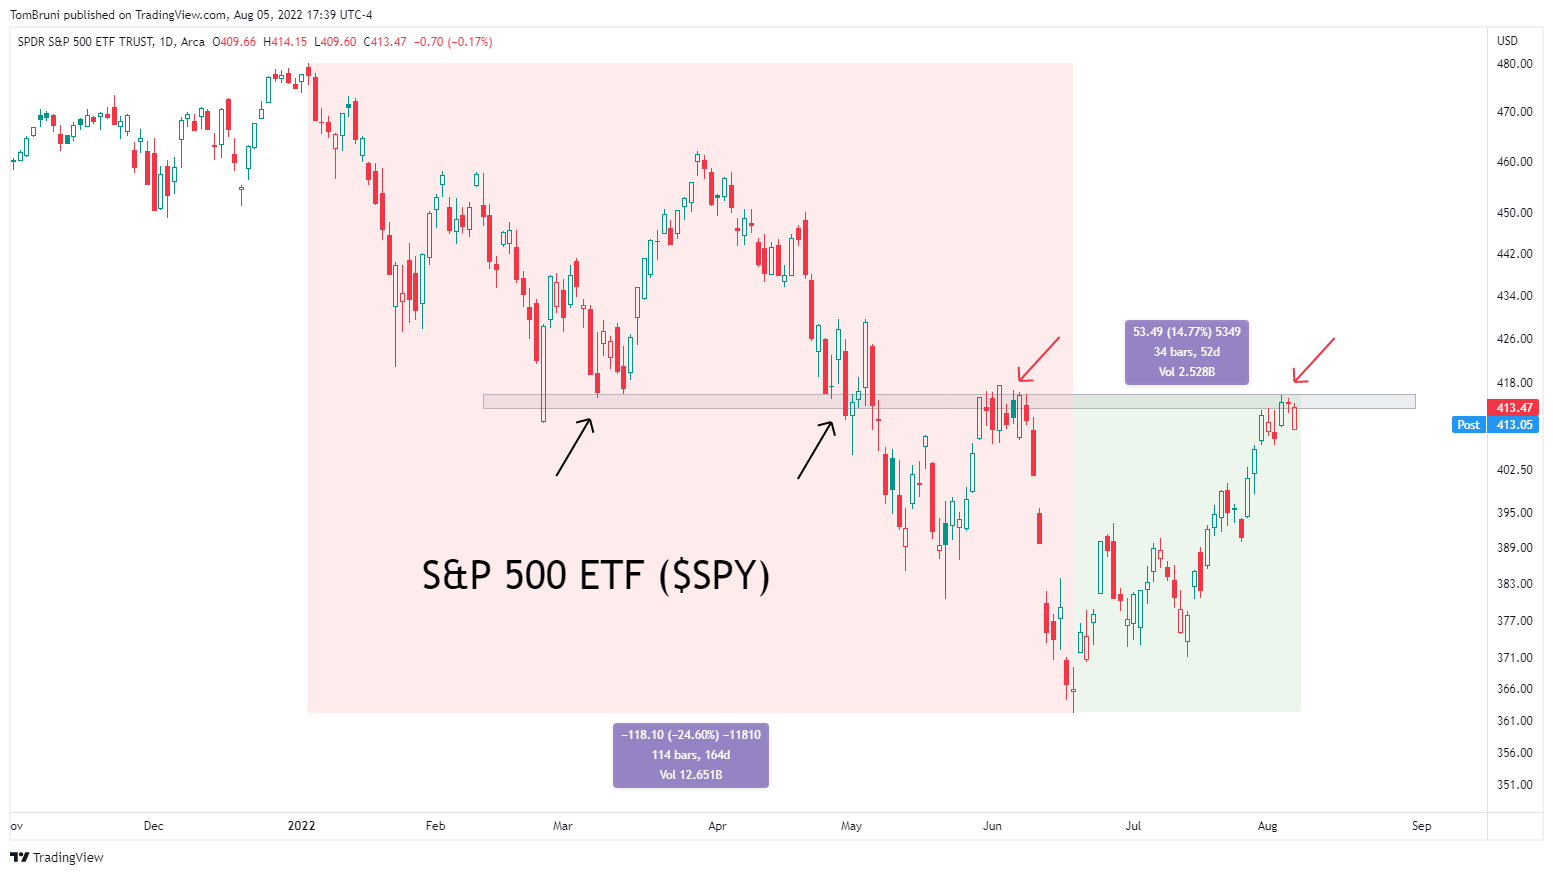
Below we see that concept at work around the $415 level in the $SPY ETF. 👇
Technical analysts are paying attention to this area for two main reasons. ✌️
First, the market is pausing at the same level it did back in June before prices continued their downward trend. Although the environment feels different than it did two months ago, this area clearly has price memory as prices stopped making progress about a week ago.
The second is the ascent of the rally, which has been steep. The market has gone up roughly 15% in about two months, leading some analysts to believe that a consolidation (period of sideways trading) would be healthy and set the market up for a more sustainable move higher.
Bearish analysts view this retest of resistance as an opportunity to get rid of long positions or initiate short positions, expecting a decline as we saw in June. 🔻
Who will be correct remains to be seen, but what happens from current levels will likely set the tone for the overall market over the coming weeks. 🗓️
We’ll be watching closely. 👀