Over the last month, technical analysts have been tracking several developments in the market.
First, they pointed out the breadth divergence, where fewer stocks made new lows with the indexes. Then, they pointed out the bullish engulfing candle that marked a potential reversal for the market.
Stocks have rallied since, leaving many wondering where they’re headed next.
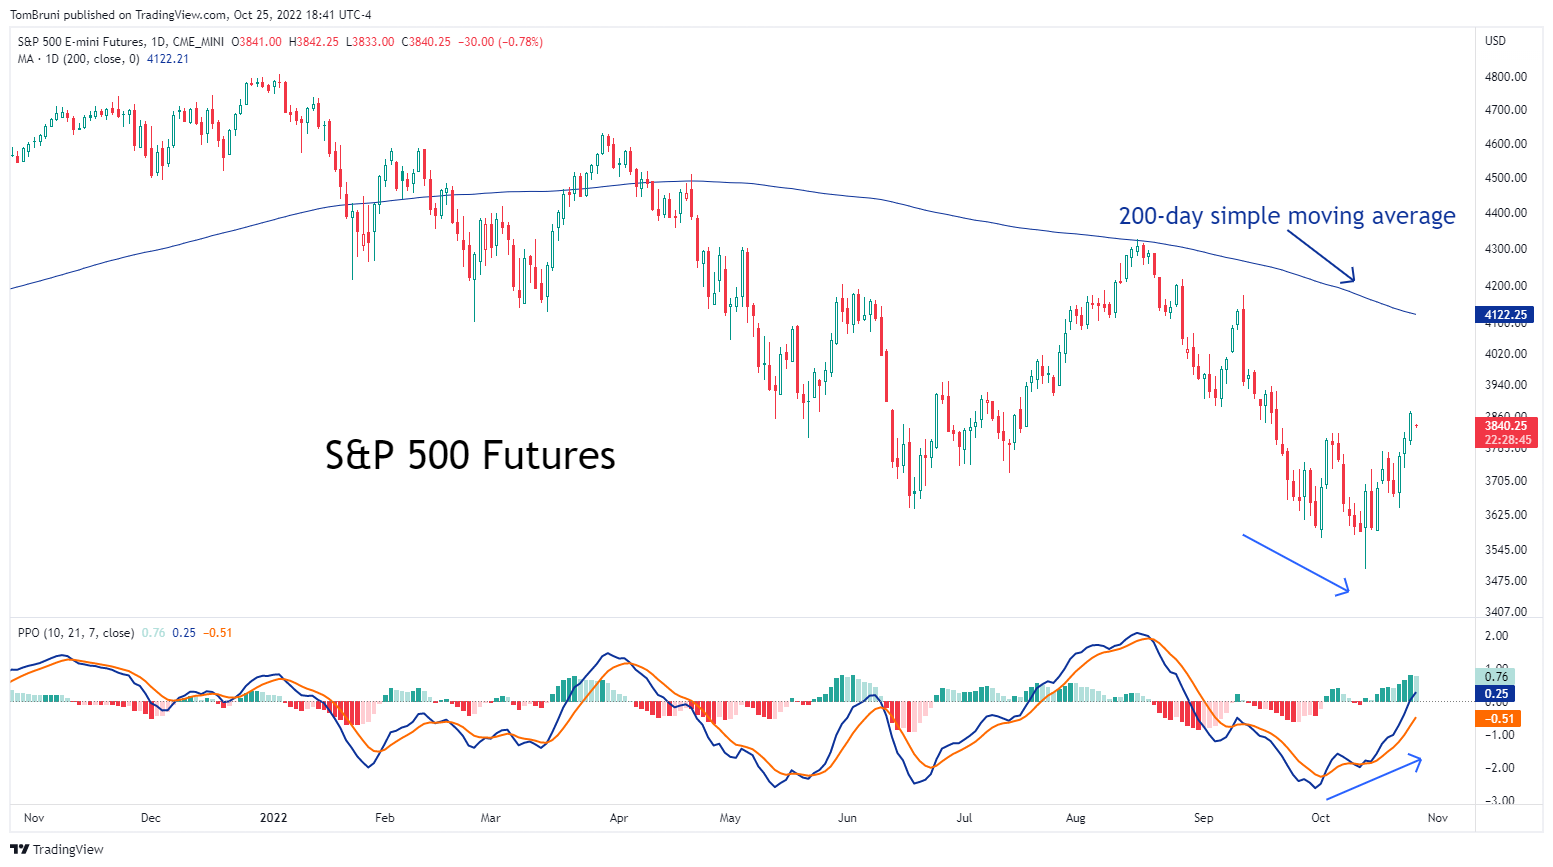
Well, the next major level many technical analysts are watching is the 200-day simple moving average. This is a commonly used indicator that helps smooth out the stock market’s long-term trend and is often looked at as a potential area of reflection for prices.
Whether you look at the S&P 500 in the U.S., the Euro Stoxx 50, or any other major global index, they’re all approaching their downward-sloping 200-day moving averages. In the coming weeks, technical analysts will watch how prices react to these areas across the various global indexes.
Like every tool, the moving average is far from perfect. And depending on who you ask, its merits and uses are highly debatable. With that said, those who are proponents of the tool point to the chart below to show its usefulness.
As you can see, this summer’s rally in the S&P 500 was halted right at the 200-day moving average. Of course, there was an entire period of January through April where prices didn’t react as strongly to the indicator. So we’ll leave it for you to decide on your own.