Some Charts Worth Watching

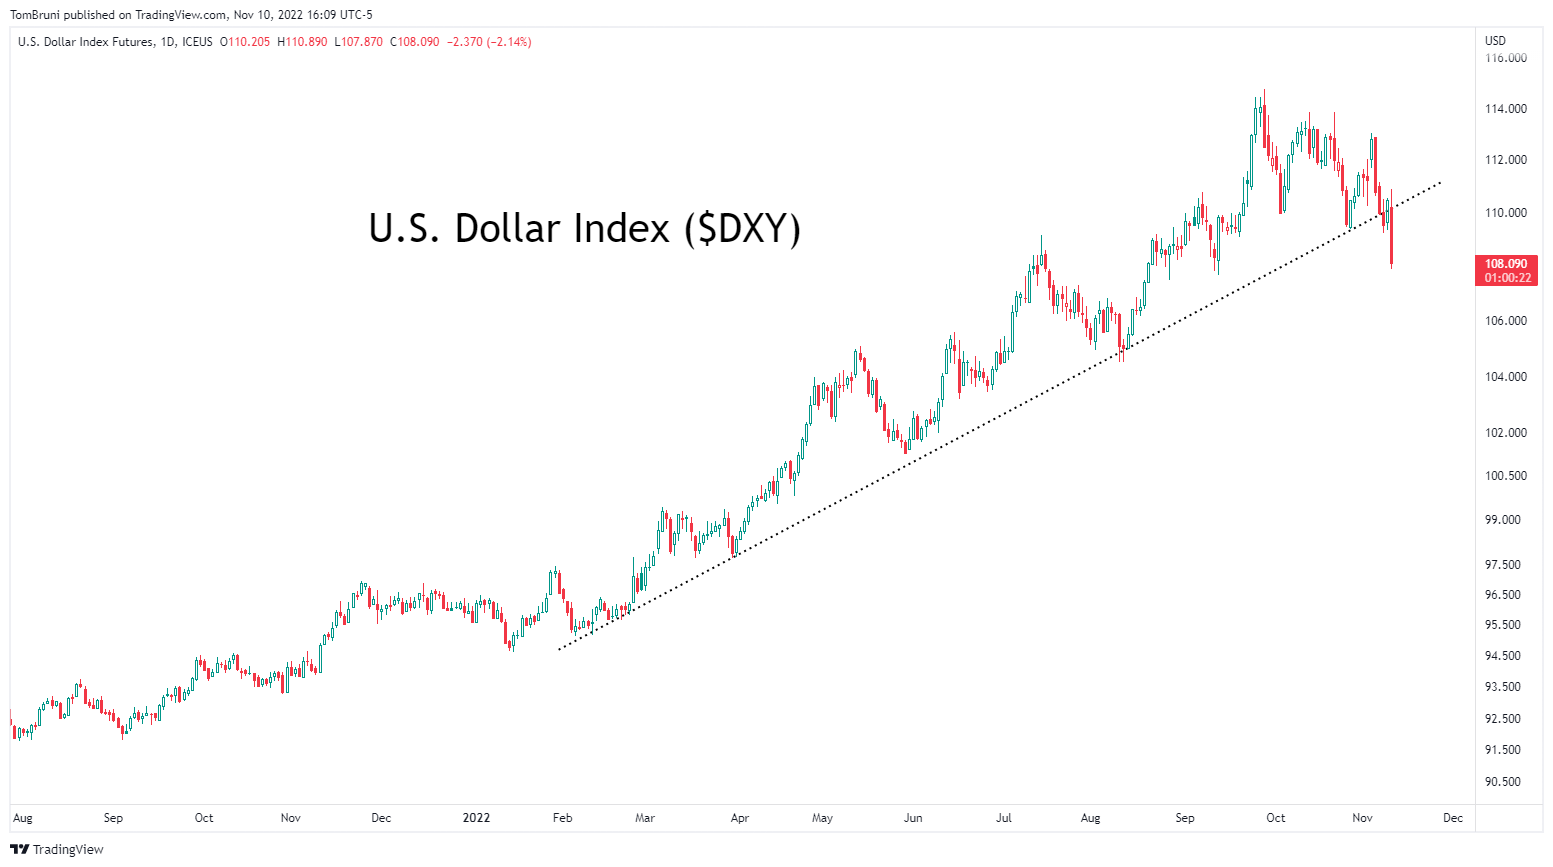
The U.S. Dollar has served as a safe-haven asset for the last year, so investors have been watching it carefully. In early October, we discussed how technical analysts viewed the Dollar’s uptrend and what they were watching to indicate that its trend might be changing.

Many traders are taking today’s action as confirmation that the longer-term trend has shifted from up to at least sideways. The first reason is that prices broke an uptrend line from February lows, indicating a change in the rate of trend. And the second reason is that prices made their first series of lower highs and lower lows.

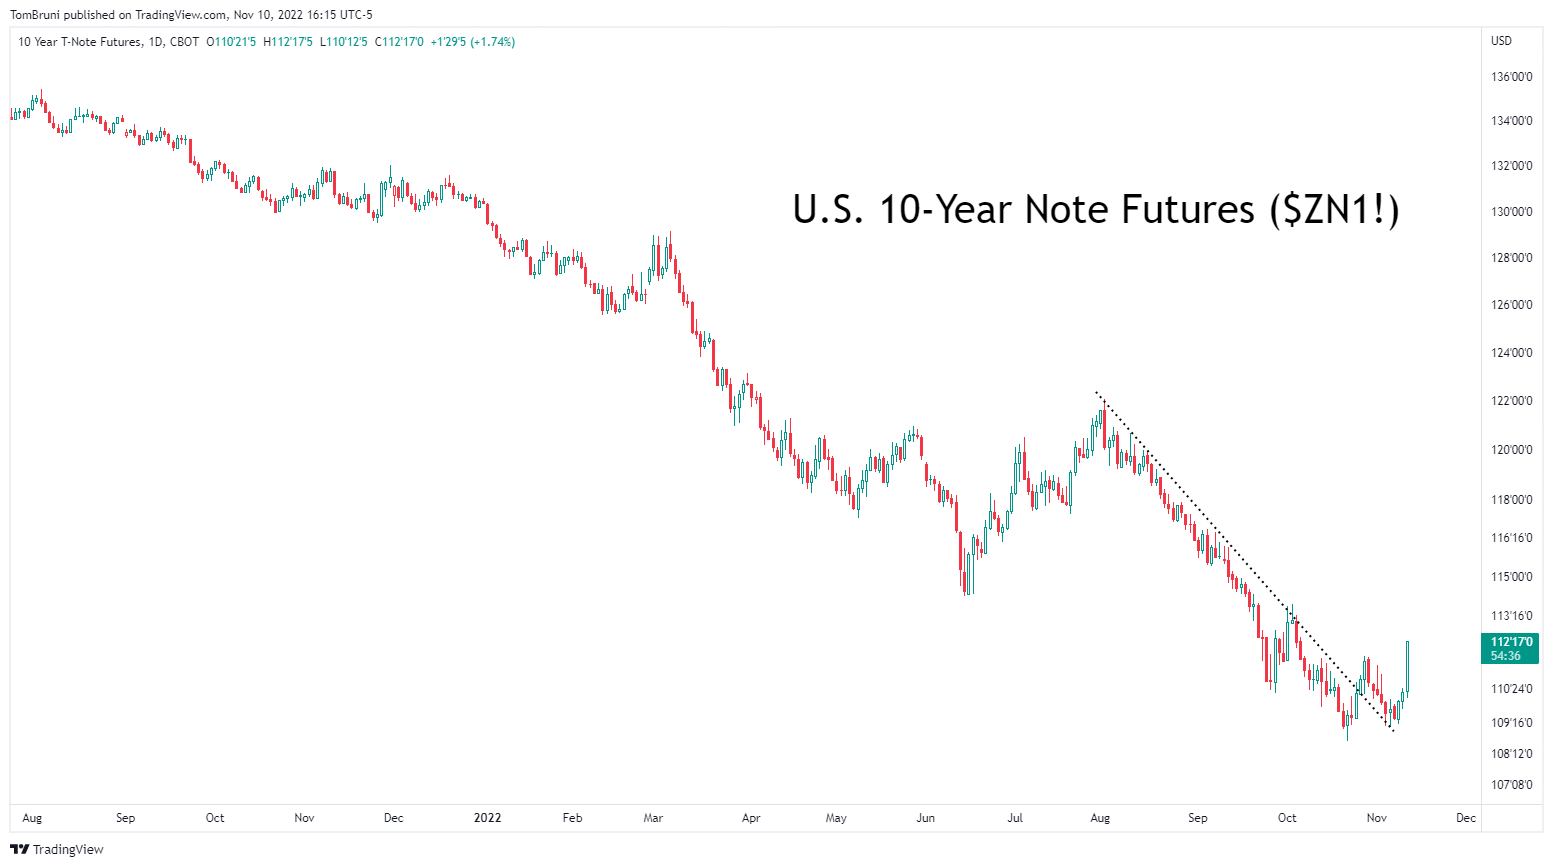
The other significant headwind for the market has been falling bonds (aka rising treasury yields). But, similar to the U.S. Dollar, 10-year treasury note futures show signs of a potential trend change. First, prices broke through a trendline from their August highs. And secondly, they made their first higher low and higher high. 

Long-term trends don’t reverse overnight. Even the improvements we’ve noted above played out over the last month and are just now beginning to make directional progress. ⏱️

But what bullish analysts and traders say is most important is that treasury yields and the U.S. Dollar are no longer marching higher daily. They point to today’s action as evidence that even a little bit of stabilization in these assets gives risk assets enough fuel to rally.

Meanwhile, bearish analysts and traders say this is nothing more than poor positioning into this morning’s CPI news being unraveled. And that once the shorts are done being squeezed, each asset class will resume its primary trend.

Who is ultimately right remains to be seen. But at the very least, it’s worth keeping an eye on these potential trend changes as we head into year-end. 📆

More in   Stocks

View All

Did We Just Witness A Bullish Slingshot?

What is a bullish slingshot, and why should we care? Today we’re looking at three tweets from Ryan Detrick of the Carson Group, who is making a bullish case for stocks.

In his first tweet, Ryan noted that January is seasonally a strong month during a pre-election year. And this year didn’t disappoint, with the S&P 500 gaining 6.2% in January. That’s the index’s best January since 2019 (7.9%) and 1989 (7.1%). 📆

Read It

Checking In On Bank Stocks

It’s been a wild week for bank stocks, so let’s take stock of where they all stand after today. Though before we get into some charts, let’s recap today’s news stories related to the sector.

First up, SVB Financial Group, the parent company of Silicon Valley Bank, has filed for Chapter 11 bankruptcy protection. The company says this process will allow it to evaluate strategic alternatives for its unaffected businesses and assets, including SVB Capital and SVB Securities, which remain operational. Also, note that Silicon Valley Bank was not included because it was taken over by the Federal Deposit Insurance Corporation (FDIC) last week. ⚖️

Read It

Southwest Airlines In A Tailspin

$LUV investors are as happy today as the many thousands of people stuck in airports because of a historical wave of cancelations from Southwest Airlines. 🤬

Upwards of 70% of Southwest’s flights have been canceled, with reports on social media from flyers that many were told the cancelations would last through Friday. 

Read It

Approaching Q1’s End

The days are short, but the quarters are long. And this first quarter has felt like a year of action in and of itself. So as we head into Q1’s last week of trading, we thought it’d make sense to check how the various asset classes are performing. 📆

Below is a chart of ETFs tracking stocks, bonds, commodities, and currencies at a high level. 👇

Read It