Atlas-t A Breakout In Greek Stocks?

Last week we discussed Japanese stocks hitting 33-year highs. And this week, the strength in foreign stocks continues, with Greece of all places making headlines. πŸ‘€

Let’s discuss what’s happening and see if investors will want a “pita the action.” πŸ«“

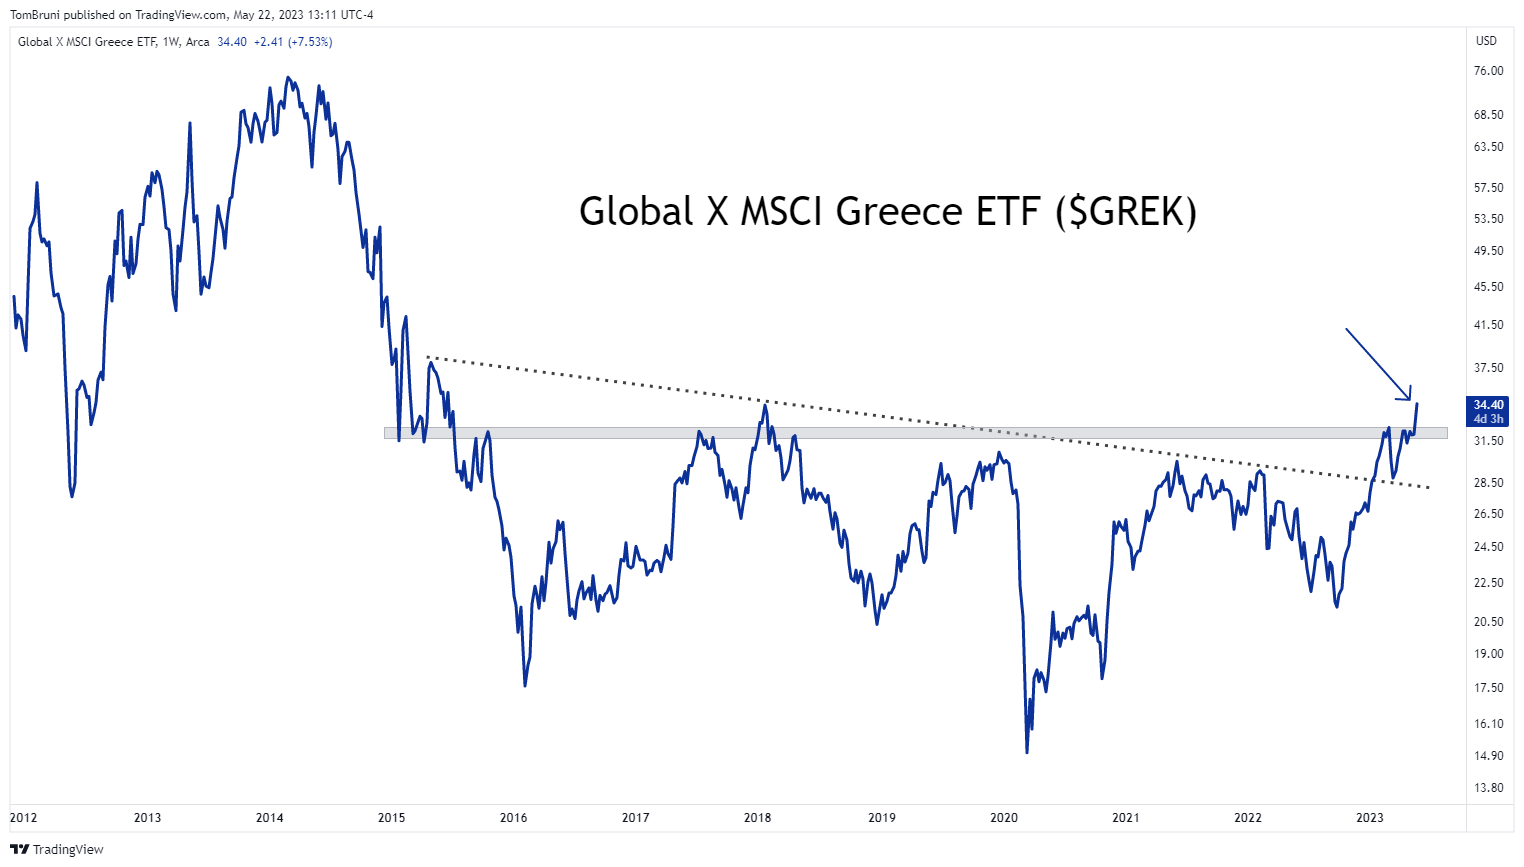
First, we’ll start with a weekly chart of the Global X MSCI Greece ETF ($GREK), one of the most popular vehicles offering direct exposure to the country’s stock market. As we can see from the chart below, prices are breaking out of the range they’ve been trapped in since 2015. Their last attempt in 2018 failed miserably, but they’re taking another shot at it five years later. πŸ“ˆ

Helping drive the breakout was election news from over the weekend. The country’s ruling New Democracy party doubled Syriza’s 20% of the vote. With that said, it’s projected to win just 145 seats in Parliament. That will leave it six short of an absolute majority. πŸ—³οΈ

As a result, Greek President Katerina Sakellaropoulou is giving the three leading parties three days each to form a coalition government. If none are successful, a caretaker government will be appointed to prepare for a runoff election about a month later.

Ultimately, we’ll have to see how it plays out. But for now, the country’s stock market is pricing in a “positive result,” whatever that means. 🀷

So why does this matter? Developed markets outside of the U.S. have been strong recently. Greece’s breakout is just more evidence of that. And ultimately, bullish investors suggest that continued strength overseas will be a tailwind for U.S. markets since these global asset classes tend to move in tandem.

Whether or not that holds true remains to be seen, but for now, investors are welcoming Greece to the party. “Feta late than never,” we always say… πŸ₯³

More in   Stocks

View All

Dividend Yields (Sort Of) Soar

With the recent selloff in defensive sectors like utilities, consumer staples, real estate, and telecom, many of these stock’s dividend yields are jumping to multi-year or multi-decade highs. However, the reason their jumping isn’t the one that investors prefer. πŸ™

A stock’s indicated dividend yield could rise by the company raising its dividend payout amount or the stock price falling. And recently, most of the dividend yield gains have come from falling prices.

Read It

Tis The Season For Yen-anigans

With all eyes on bonds, eyes should also be on currencies, and one of the scariest-looking charts out there is most definitely the Yen Index (JXY). πŸ‘€

When October came to an end, the lowest daily, weekly, and monthly close in the JXY’s history occurred. 😲

Read It

Small/Large Ratio’s 20-Year Lows

In theory, smaller-cap stocks are supposed to provide investors with a higher potential reward because of their higher risk. But that hasn’t been the case for much of the last decade…and that trend continues today. πŸ“‰

Below, the Russell 2000 vs. S&P 500 ratio is sitting at more than 20-year lows, signaling that smaller-cap stocks continue to underperform their large-cap counterparts. And while this ratio chart really highlights the longer-term trend, the year-to-date trend can be seen by simply looking at the absolute numbers.

Read It

Buyers Fishing For A Bottom

Just two weeks ago, we discussed a level of potential support that traders were eying in the S&P 500. Today, we’re sitting just above that level, so it’s worth revisiting the chart. πŸ—ΊοΈ

We initially discussed traders and investors identifying a confluence of technical “levels” and indicators in the $410-$420 range of the S&P 500 ETF $SPY. As we pointed out last time, not only is the market’s May breakout level near 420 but so is the volume-weighted average price from its 2022 highs and 2022 lows.Β 

Read It