Lots of nice big breakouts and moves across the board since last week. Looking at the top 25 cryptocurrencies by market cap, all are in the green for the past seven trading days, with 20 out of 25 in double-digit percentage gains.
However, analysts warn that a pause in the near-term upward momentum may occur. Not necessarily a cessation of the current bullish momentum but a pause as the rest of the market digests what the moves mean. We’re going to look at key price levels that investors, traders, and analysts are looking at as resistance. ✋
If you want to skip the Magic 8 Ball, chicken bone, voodoo technical analysis mumbo jumbo, scroll to the Too Long; Didn’t Read (TL;DR) part of the summary.
Ethereum
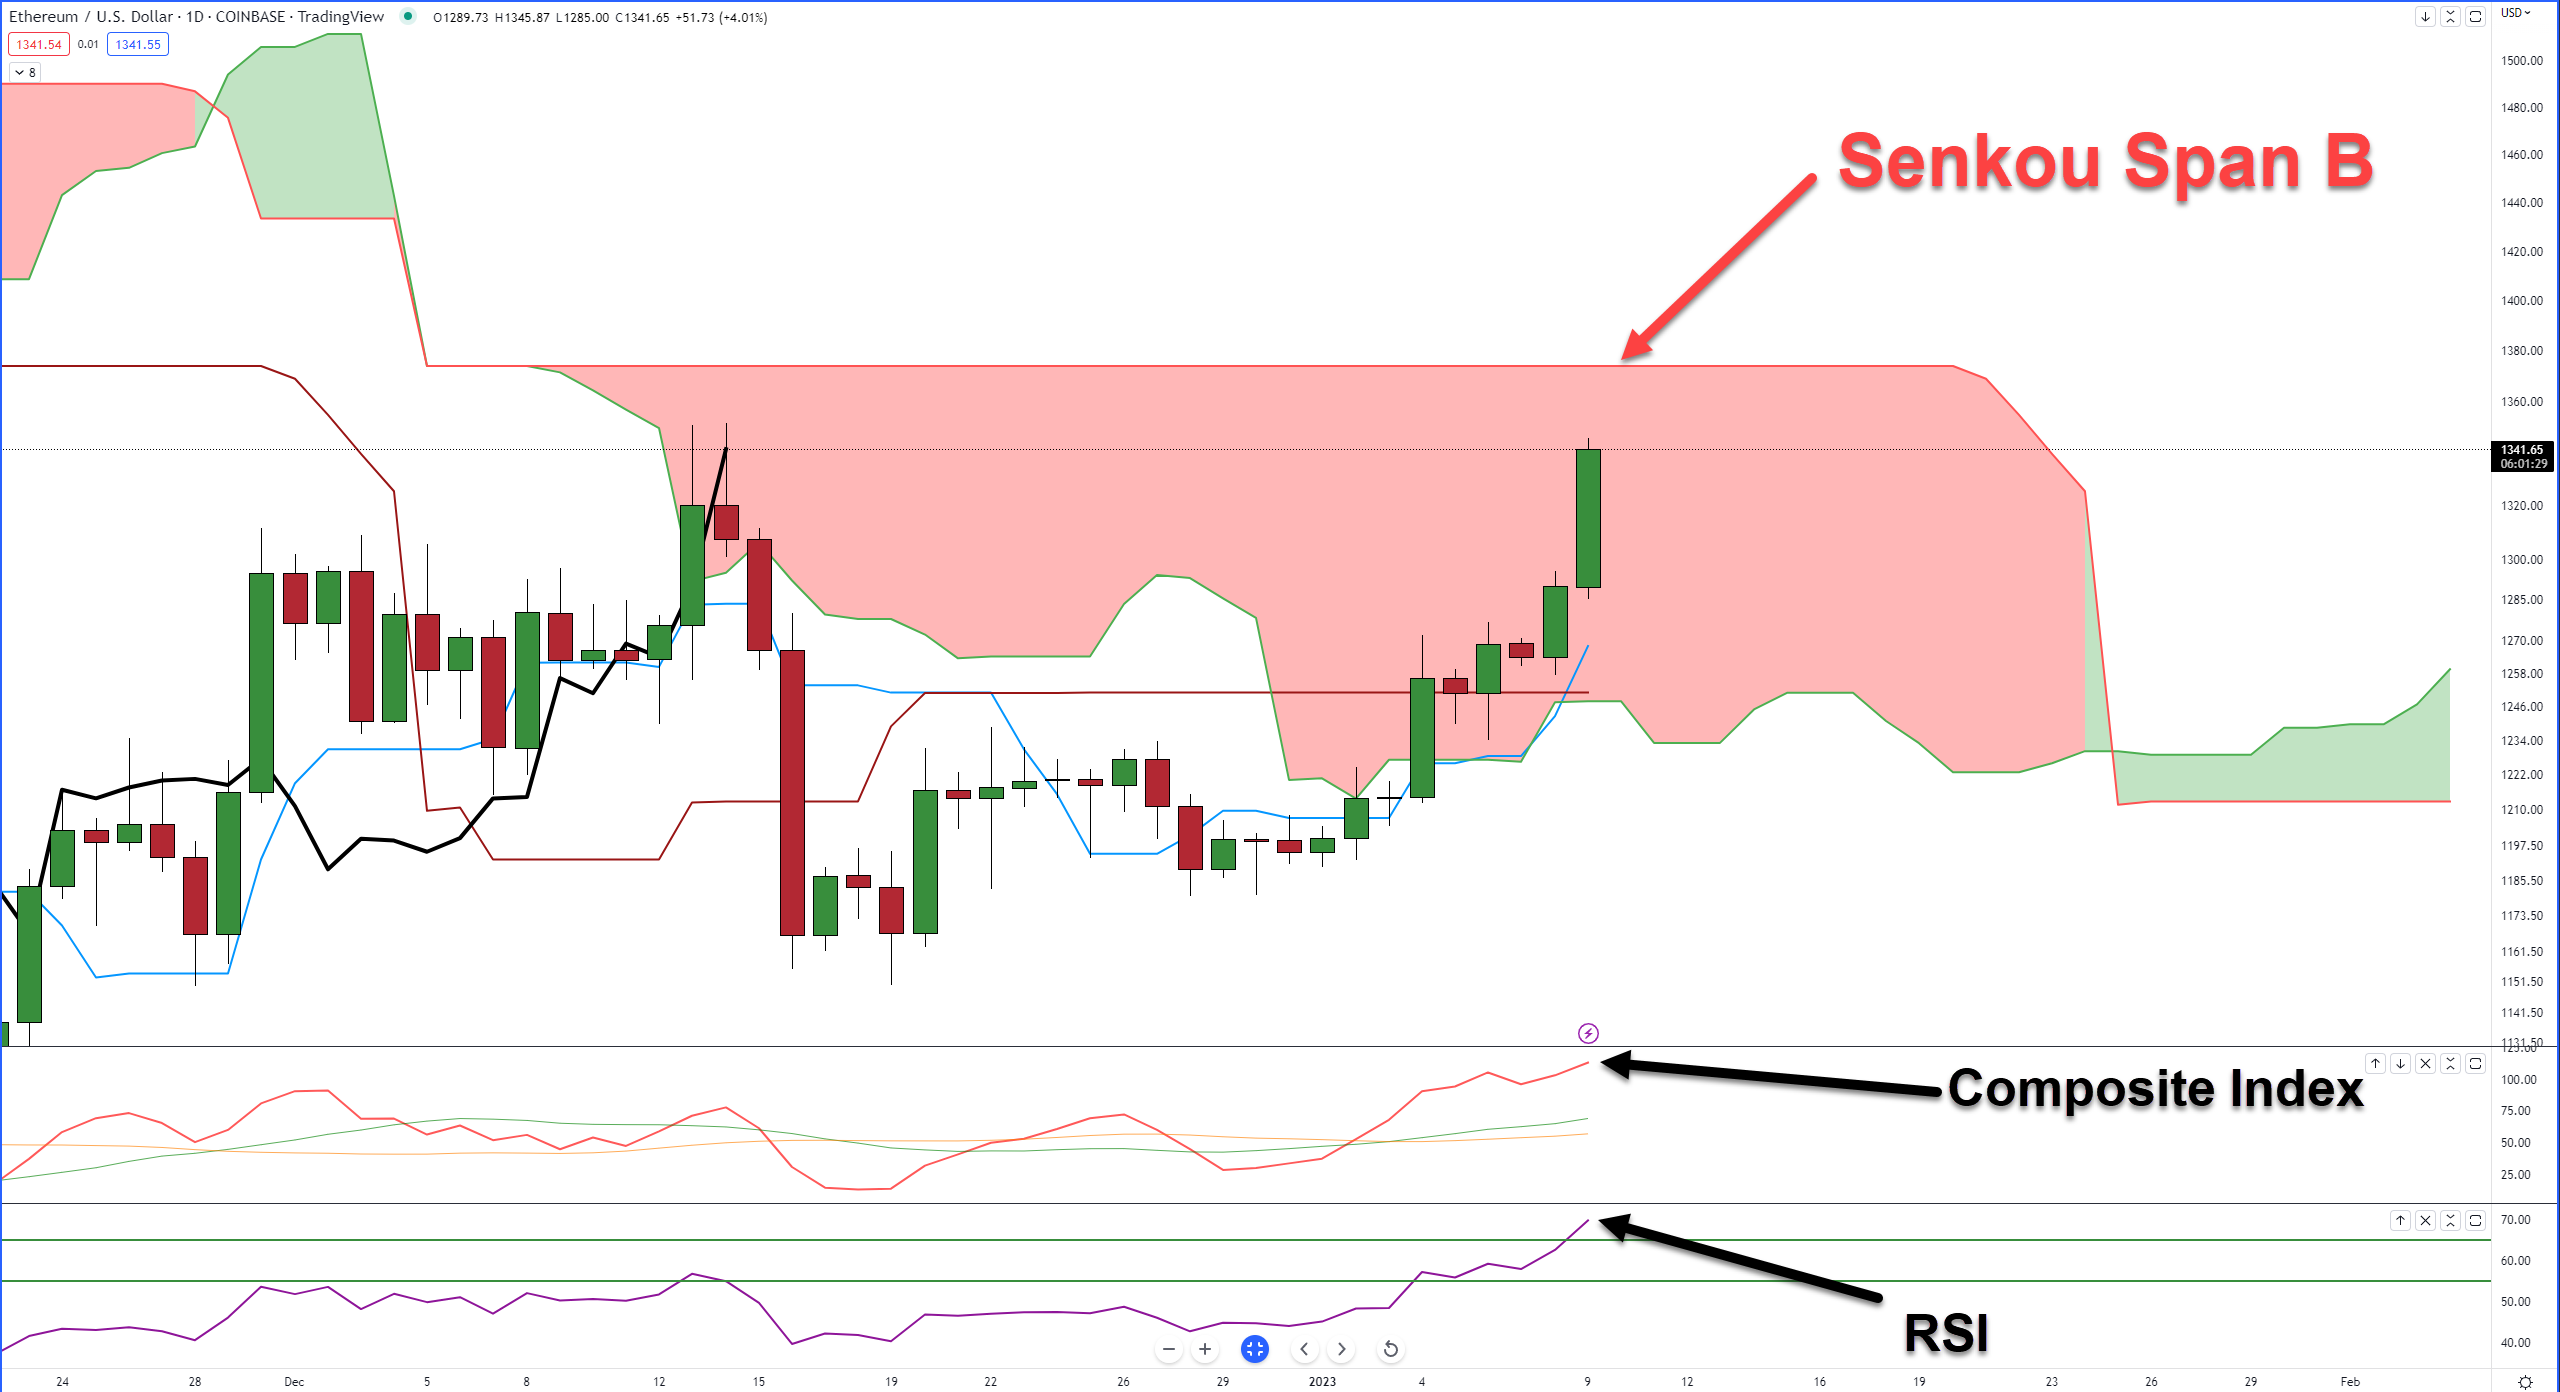
$ETH.X is inside the daily Ichimoku Cloud. The Cloud is the red and green blobs you see on the screen, and it represents indecision, volatility, whipsaws, misery, and all things bad in the world. It’s the place where trading accounts go to die. The top of the Cloud, Senkou Span B ($1,375), is the strongest support and resistance level in the Ichimoku Kinko Hyo system. When Senkou Span B is flat, its strength as support/resistance is exacerbated by how long it remains flat.
From an oscillator perspective, there are some warning signs. The Composite Index has been trading at its highest level on the daily chart since March 29, 2022. The RSI has moved above the last oversold level in a bear market, 65, and hit level 70.
TL;DR
Analysts and traders anticipate selling pressure and/or a pause at $1,375.
Long-term swing traders want to see the RSI move below level 70 and then return to test it again. A successful breakout above the retest of 70 could confirm that a new bullish breakout is likely to continue. 👉
XRP
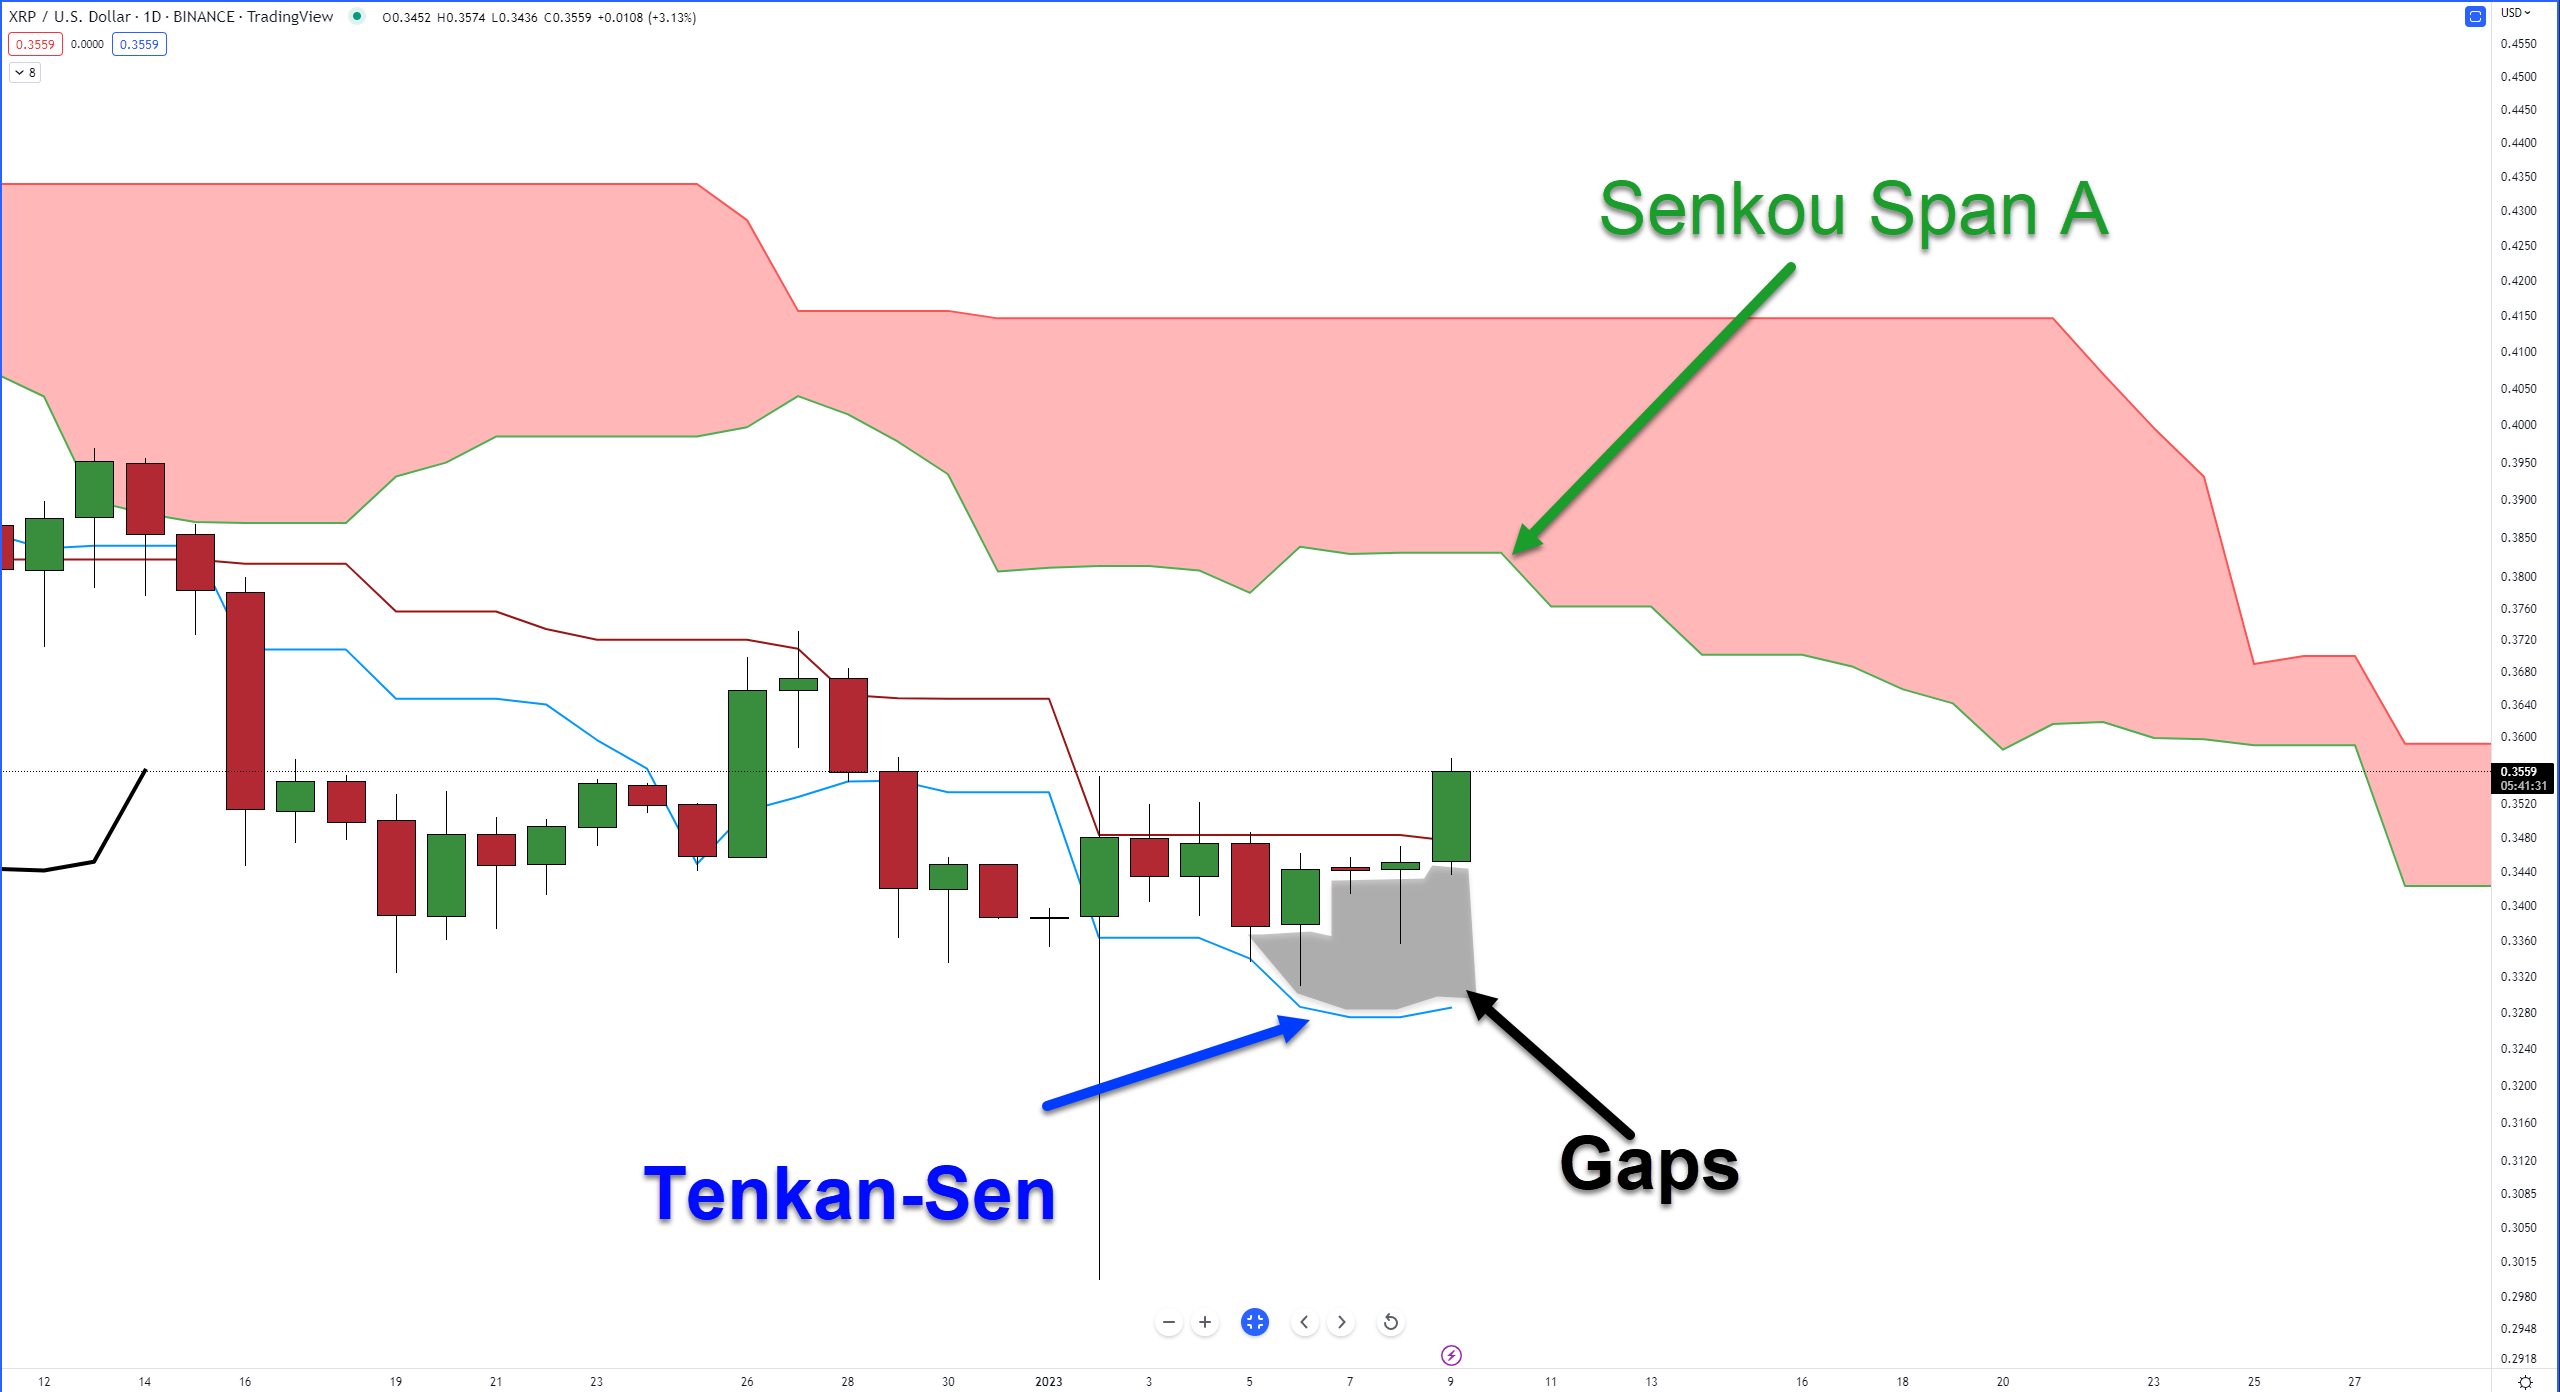
$XRP.X is attempting to close above the daily Kijun-Sen for the first time since December 14, 2022. 👀
Some traders see enough juice/momentum to keep XRP moving beyond the Kijun-Sen, but analysts warn that the bottom of the Cloud, Senkou Span A ($0.38), could prove difficult to close above.
There are already significant gaps between the bodies of the daily candlesticks and the Tenkan-Sen.
Additionally, the RSI (not shown) is close to the first overbought level in a bear market, 55. XRP has not tested the 65 level since November 5, 2022.
TL;DR
Analysts see XRP as having enough short-term momentum to move to the $0.38 level but warn that any further movement away from the Tenkan-Sen could trigger a violent pullback. 🔙