I wanted to add this to yesterday’s Litepaper, but there wasn’t enough room. 🪗
There’s a lot of folks on social talking about the monthly RSI and how it’s above the default overbought level of 70. That’s happened before.
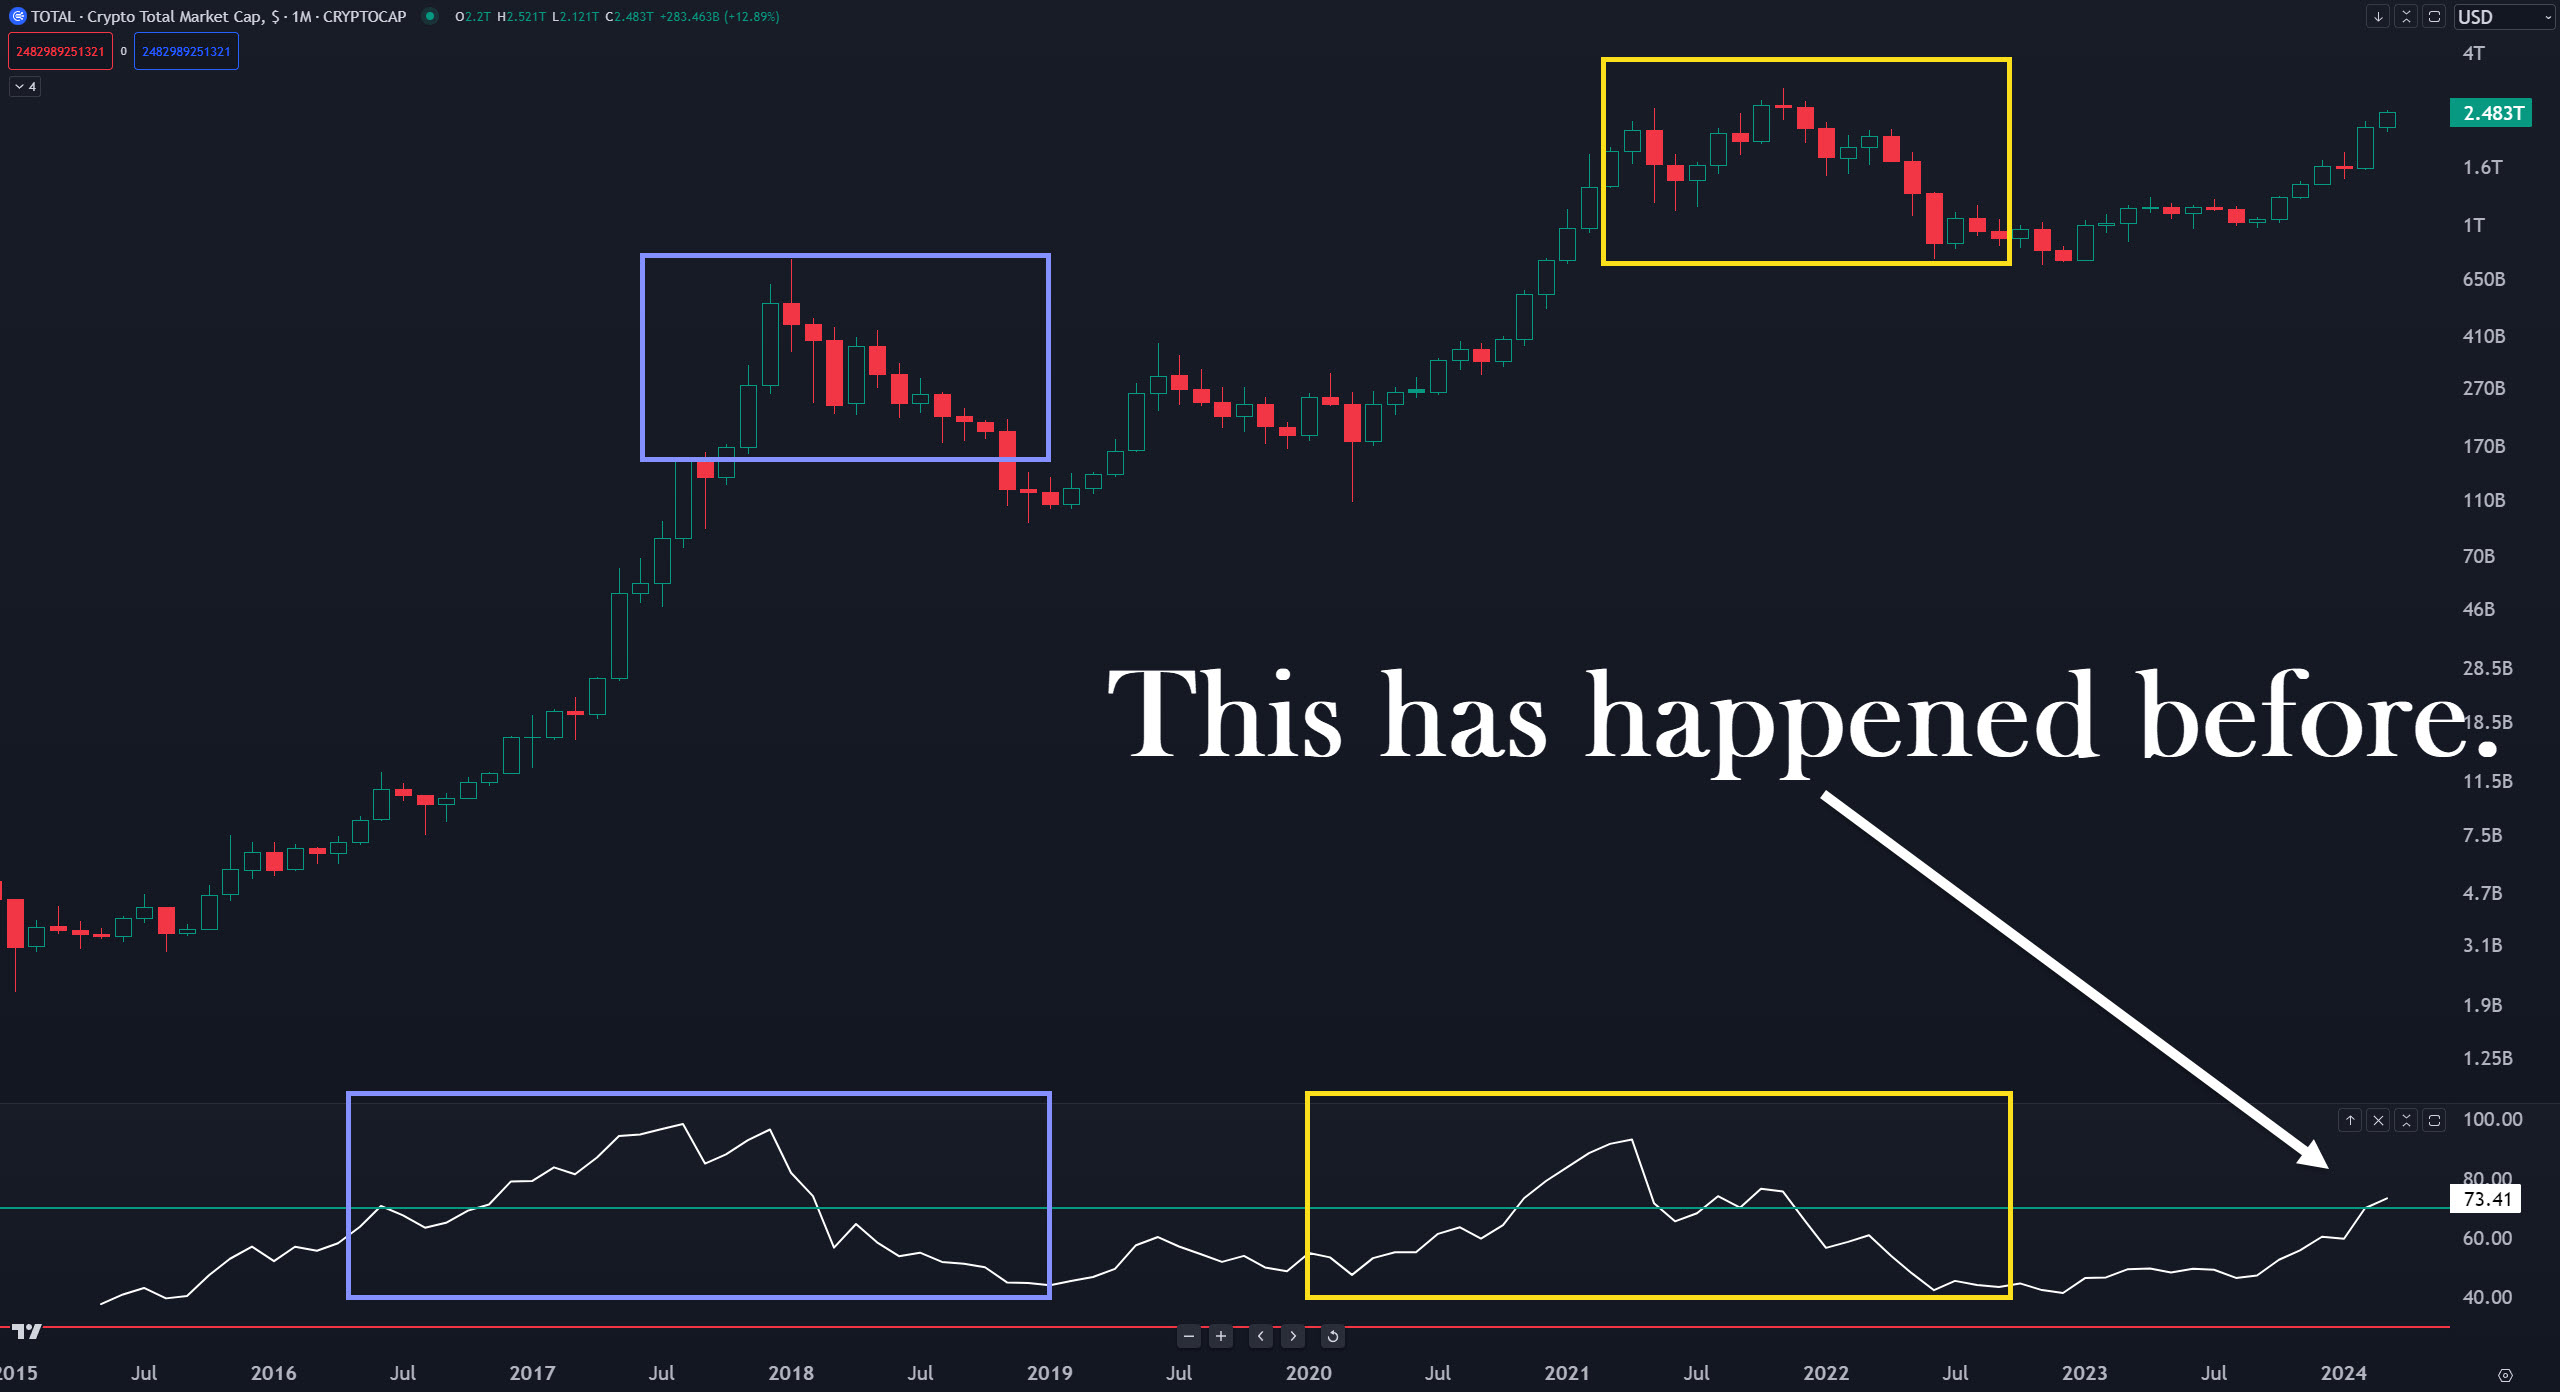
The chart above is the monthly chart for the Total Cryptocurrency Market Cap. I’ve highlighted two similar price action and RSI zones to show that price has hit the default overbought level on the RSI post-bear market before, and the trend has continued pushing higher despite the RSI turning lower.
There are two schools of thought: past performance isn’t indicative of future results, and the other: patterns repeat. Which is right? I have no idea, but this is the first time the technicals have reached these levels with such powerful, bullish fundamentals behind them.
And that can be a double-edged sword. Enough juice and joy, and things keep going up. But it’s also an opportunity for the ‘big boys’ to enact their shenanigans and trap bulls. Either way, be careful. ⚠️