The Good
We’re revisiting the NZDCAD pair from a few weeks ago.
It’s still in the bull flag, and you can see that bears have stubbornly defended the top of the flag and prevented bulls from even testing a breakout.
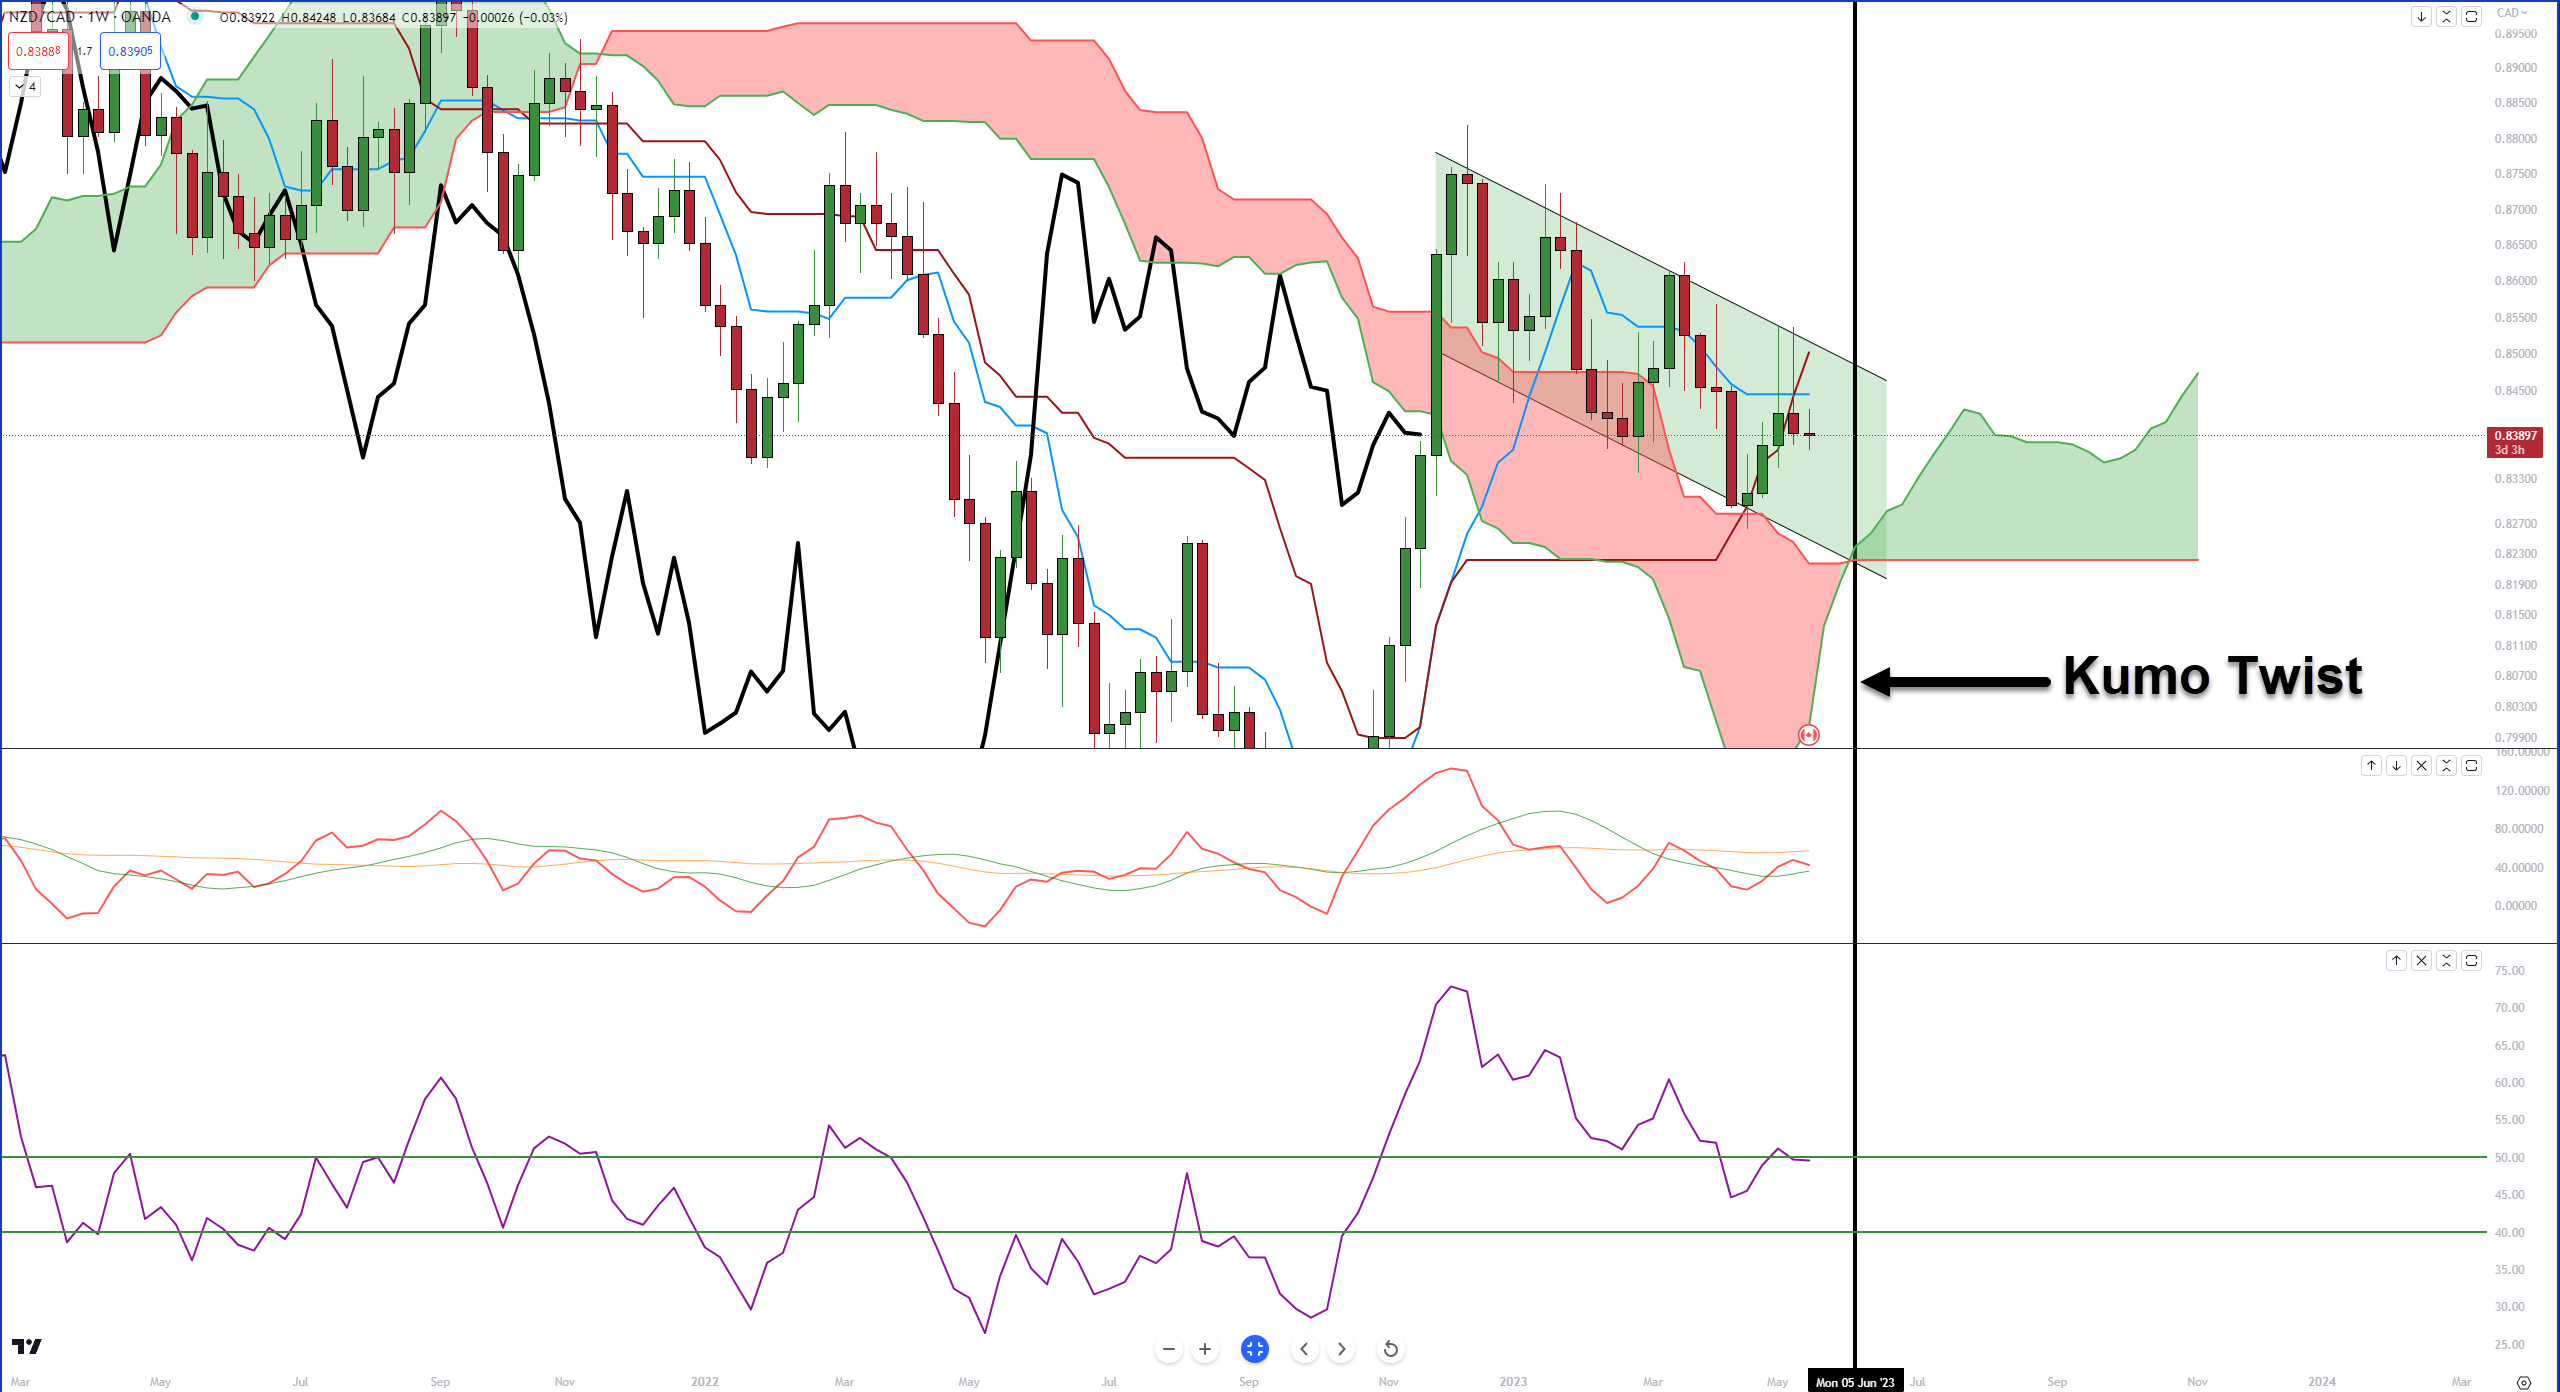
But bears shouldn’t be overconfident nor bulls overly despondent.
The weekly RSI is in oversold territory, and the Composite Index is flattening out a good amount – imagine a coiled spring.
From a time cycle perspective, the Kumo Twist in the week of June 5 will be very important to watch as it could be the trigger that sees NZDCAD make a major bullish or bearish move.
But when you look at the Kiwi’s performance in the RRG, it’s not hard to see why bulls might be favored for some action here.
The Bad
The bad here is for DXY bears and EURUSD bulls.
The monthly DXY on the left and the monthly EURUSD on the right both share (not surprisingly) an important condition within the Ichimoku system: bad gaps.
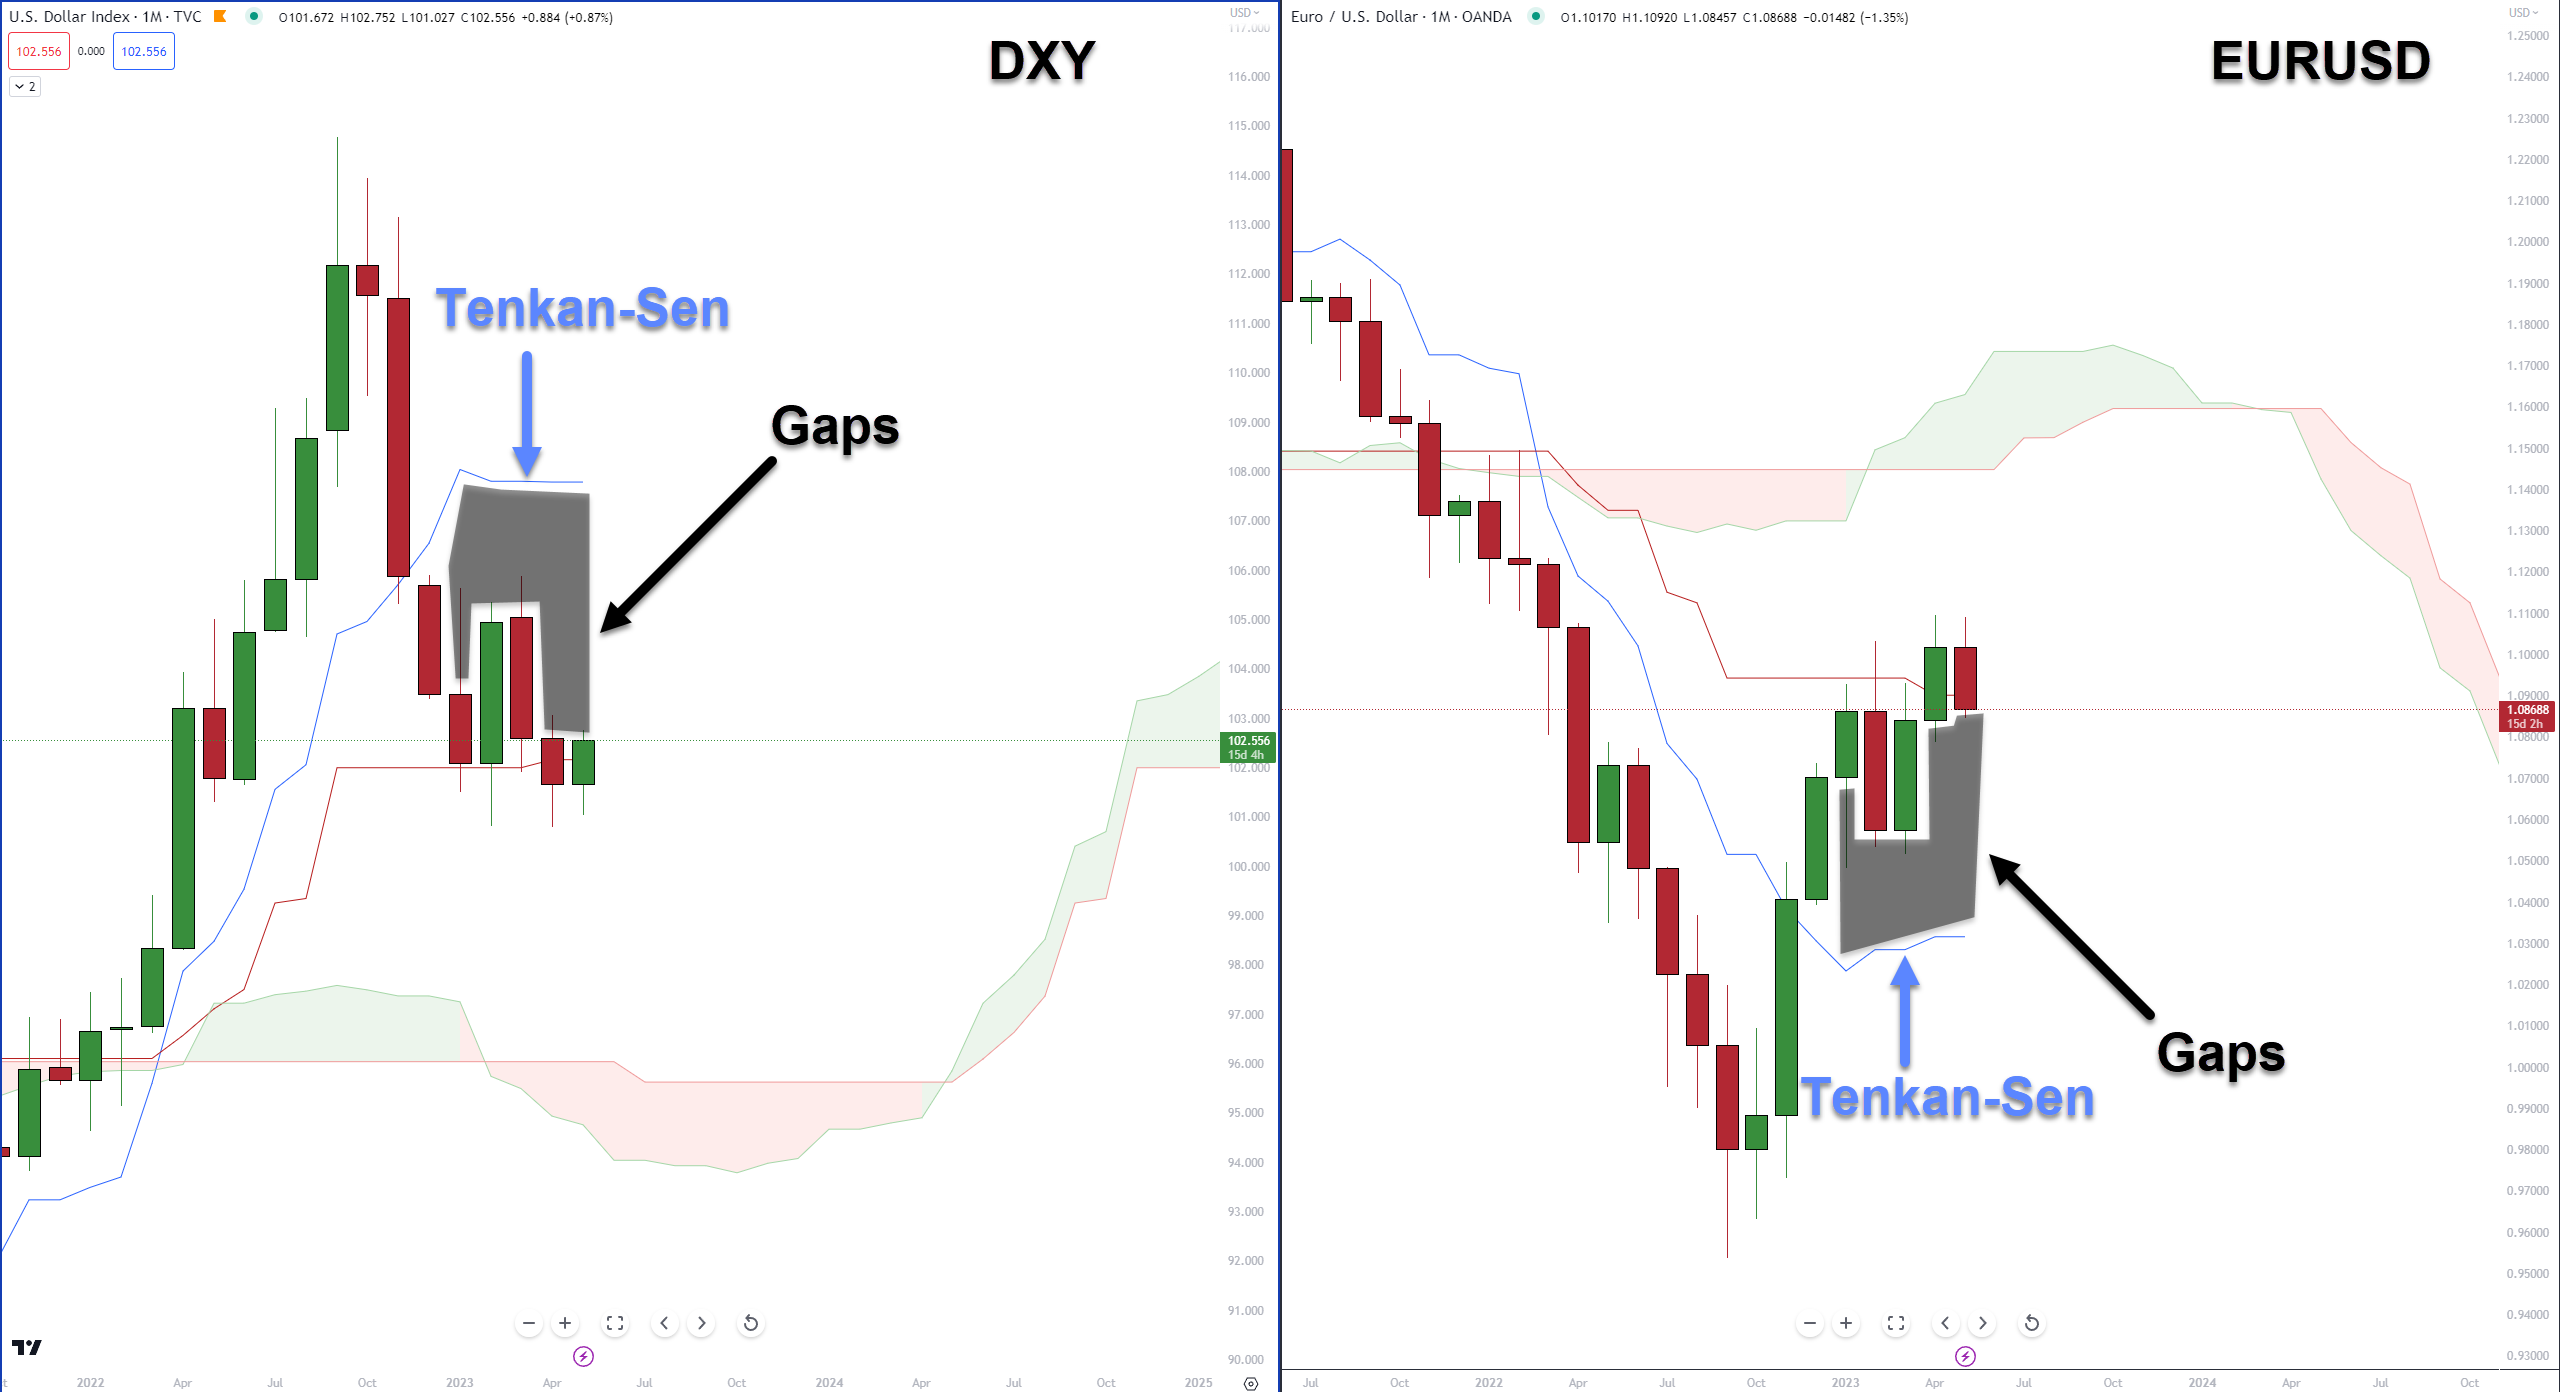
The gaps between the bodies of the candlesticks and the Tenkan-Sen are substantial and have been unresolved for five months.
Every day these gaps exist, there is an increased chance of a mean reversion back to the Tenkan-Sen – something to watch for.
The Ugly
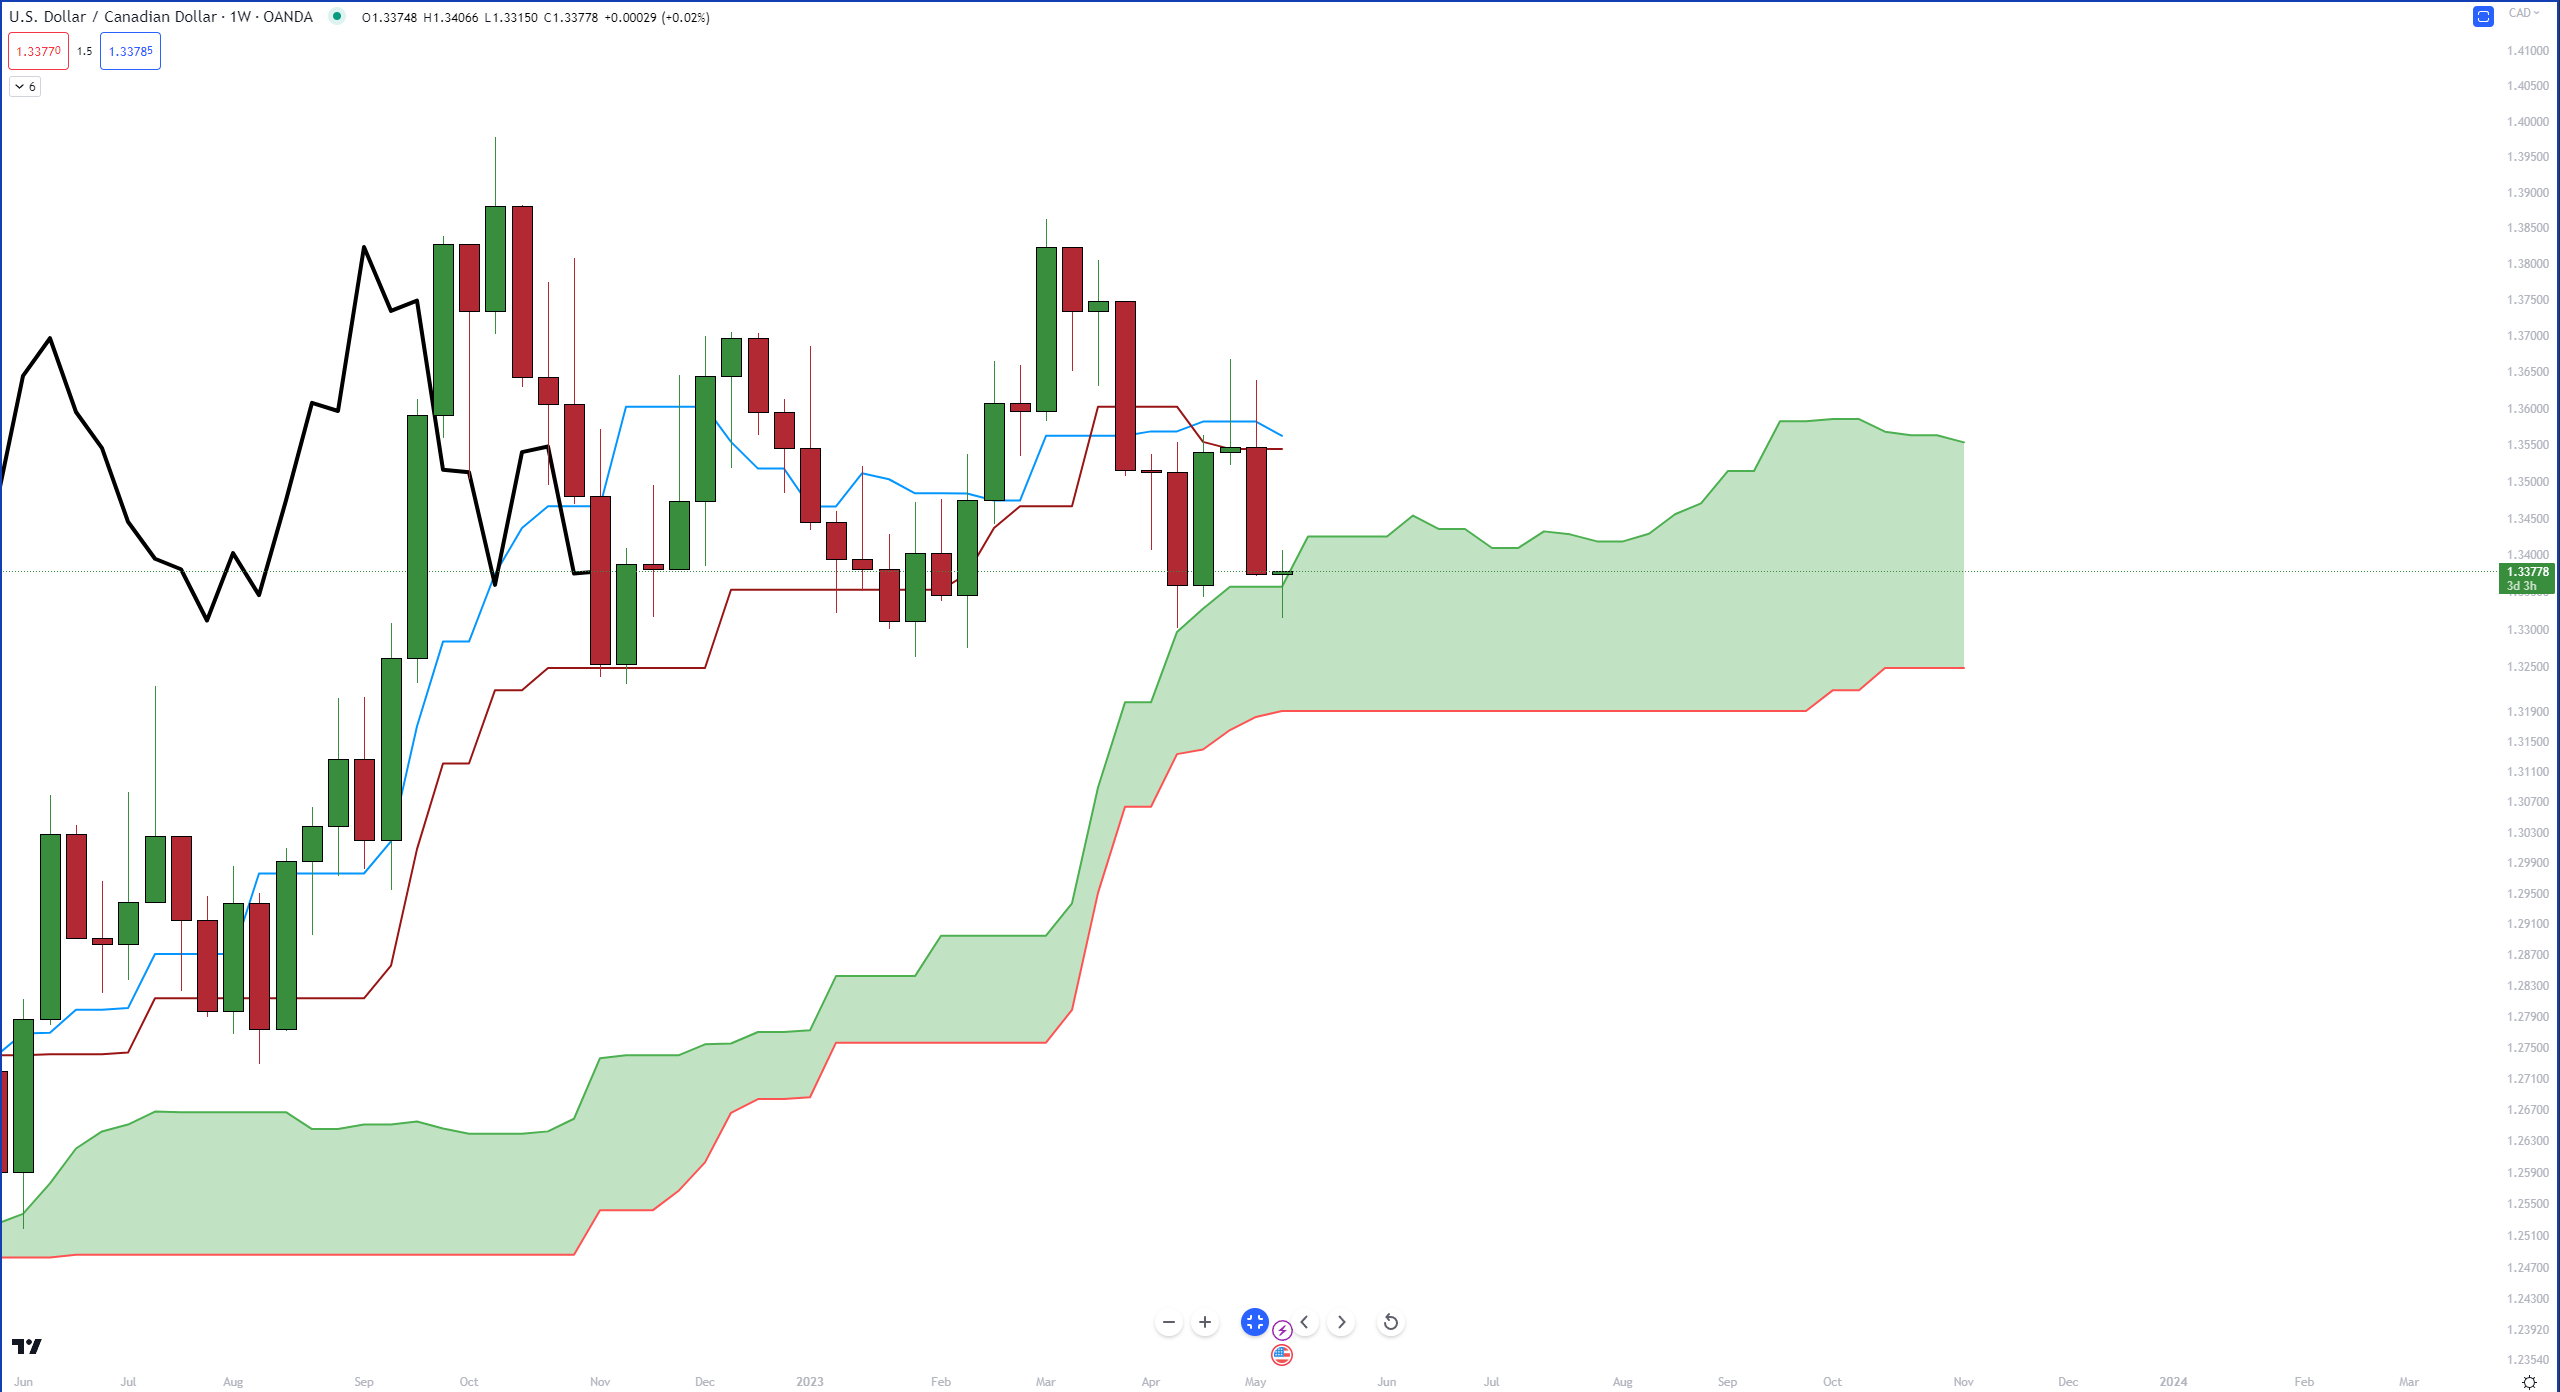
This is an update to last week’s Ugly chart – USDCAD.
Here’s what it looked like last week:
And here’s what USDCAD’s weekly chart looks like now:
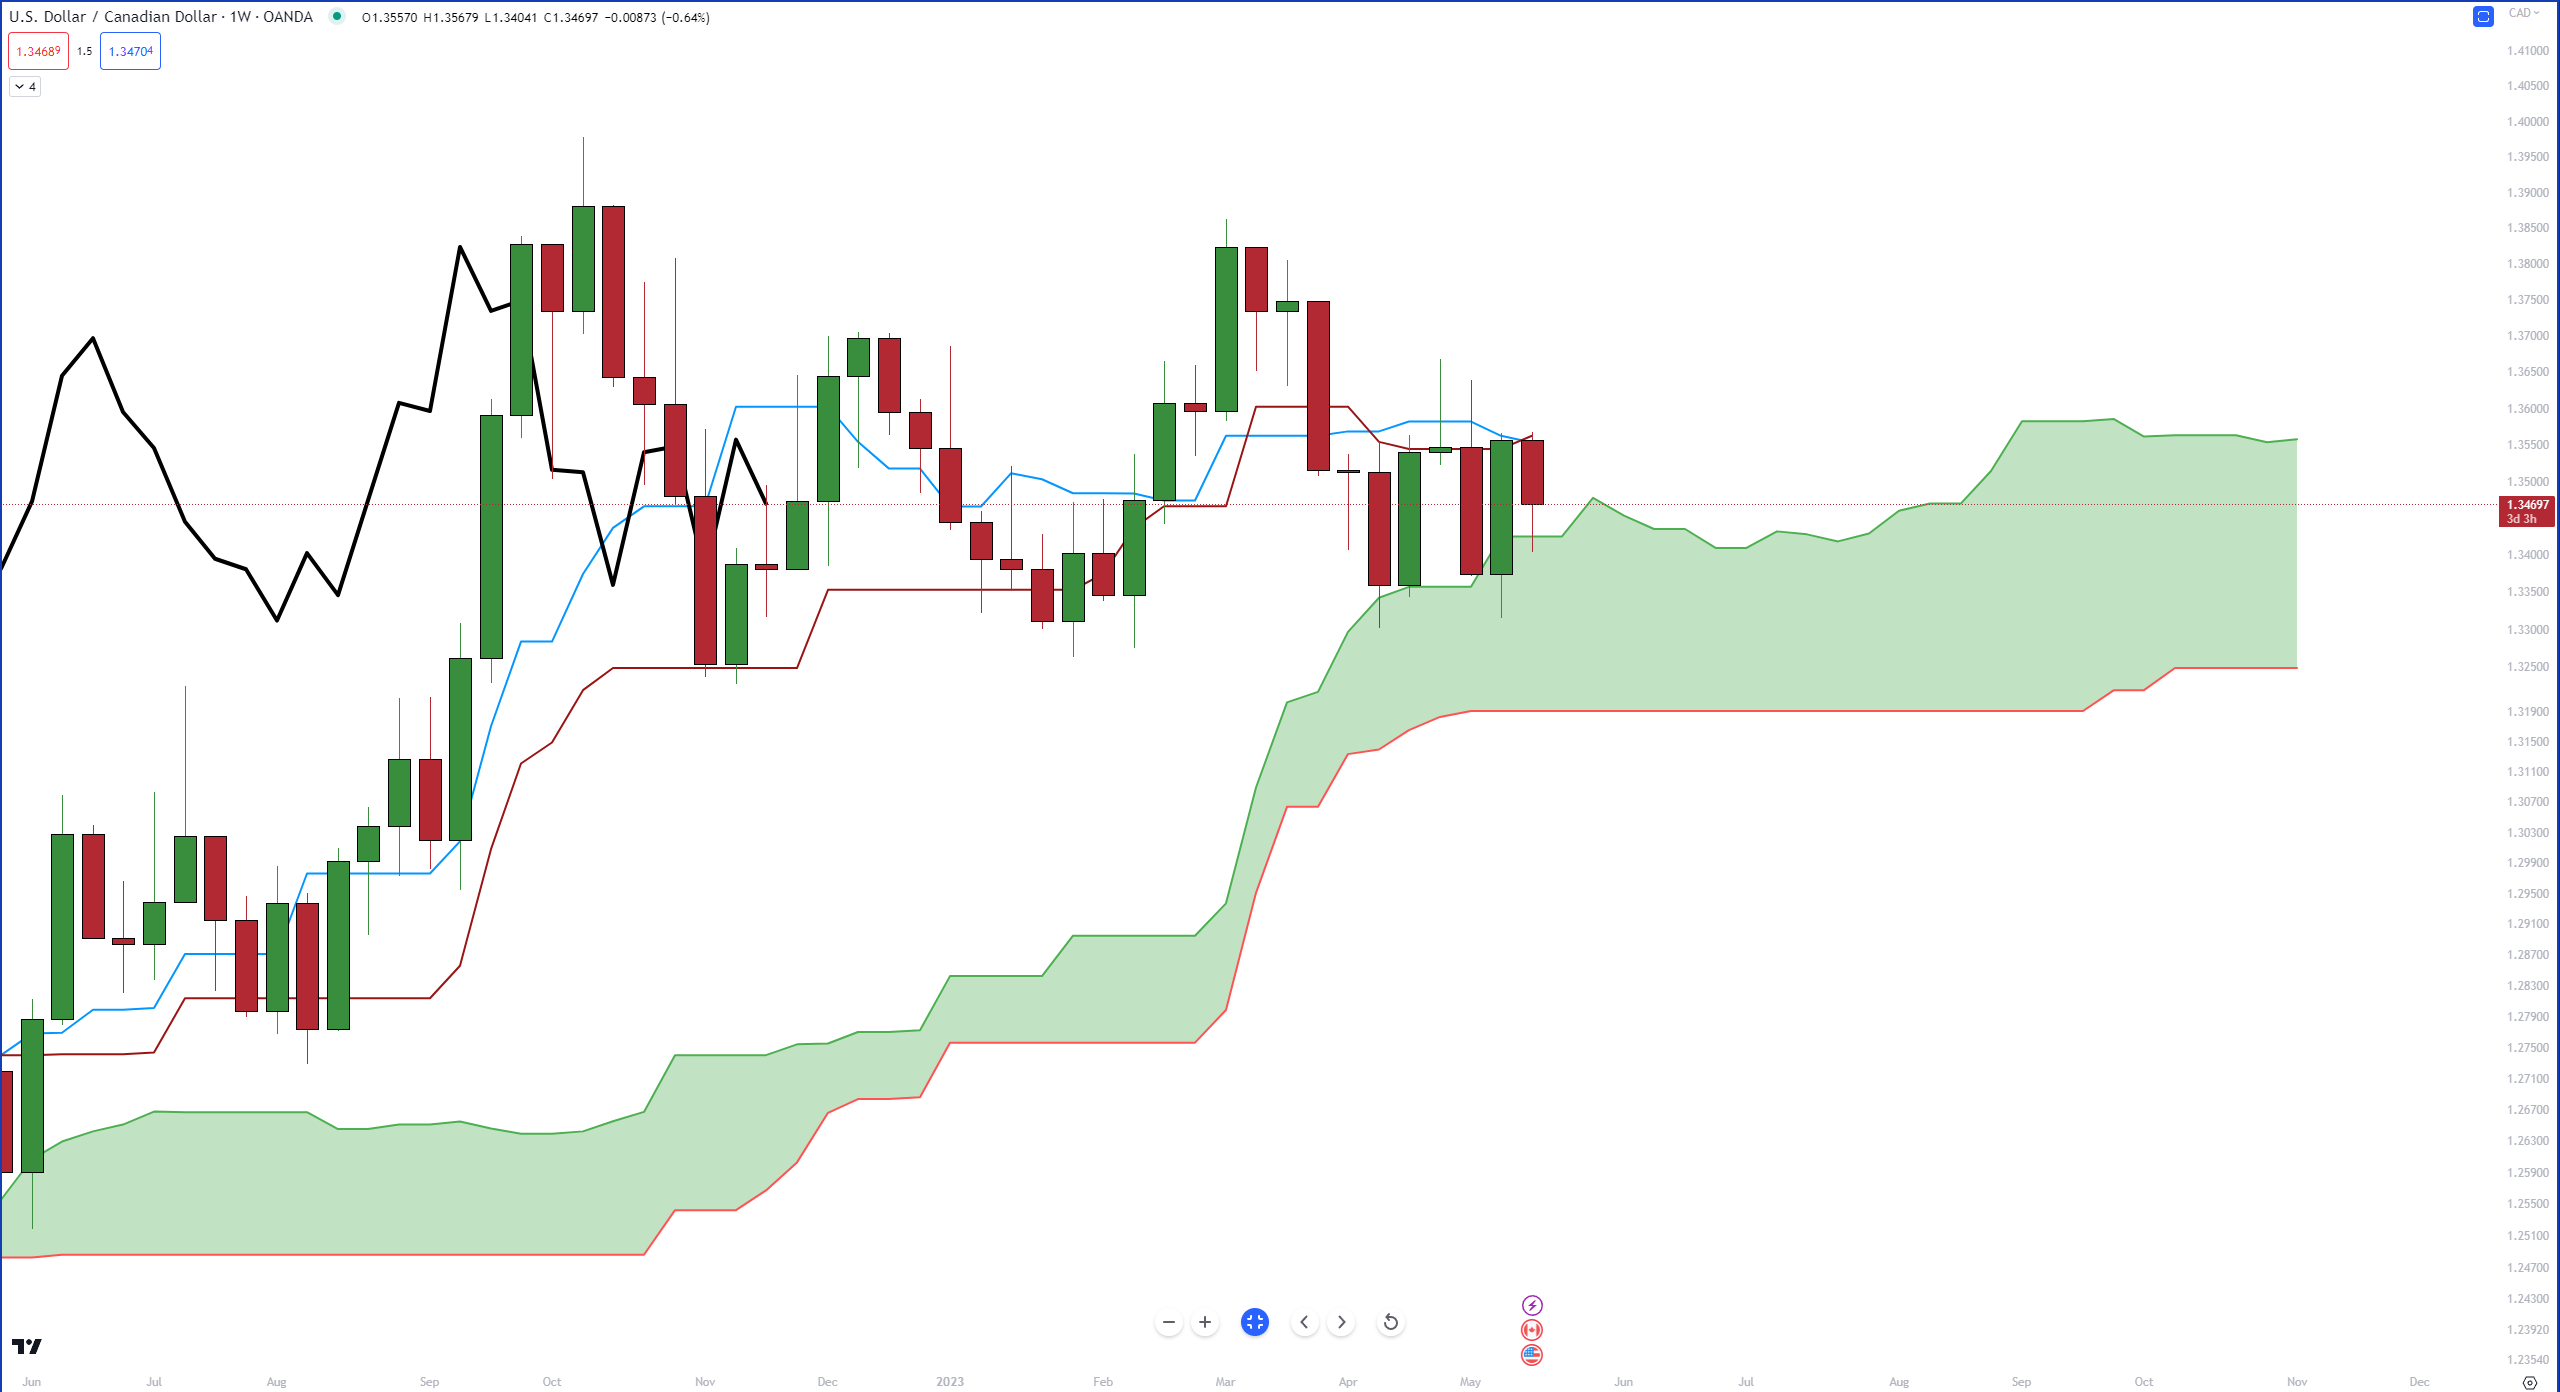
A nice bounce of the top of the Ichimoku Cloud (Senkou Span A) kept price from moving inside the Cloud, but bulls couldn’t push price above the Tenkan-Sen or Kijun-Sen.
Currently, the Kijun-Sen and Tenkan-Sen are acting as resistance, and you’ll notice price action is ping-ponging between them and the Cloud.
Additionally, the Chikou Span is inside the candlesticks. It’s a warning sign that congestion is likely to continue. 😖