Let’s be honest here, Coinbase’s problems are not the reason prices tanked after the rally, but it was a catalyst. From a technical analysis perspective, a small sneeze would cause some retracement. 🤧
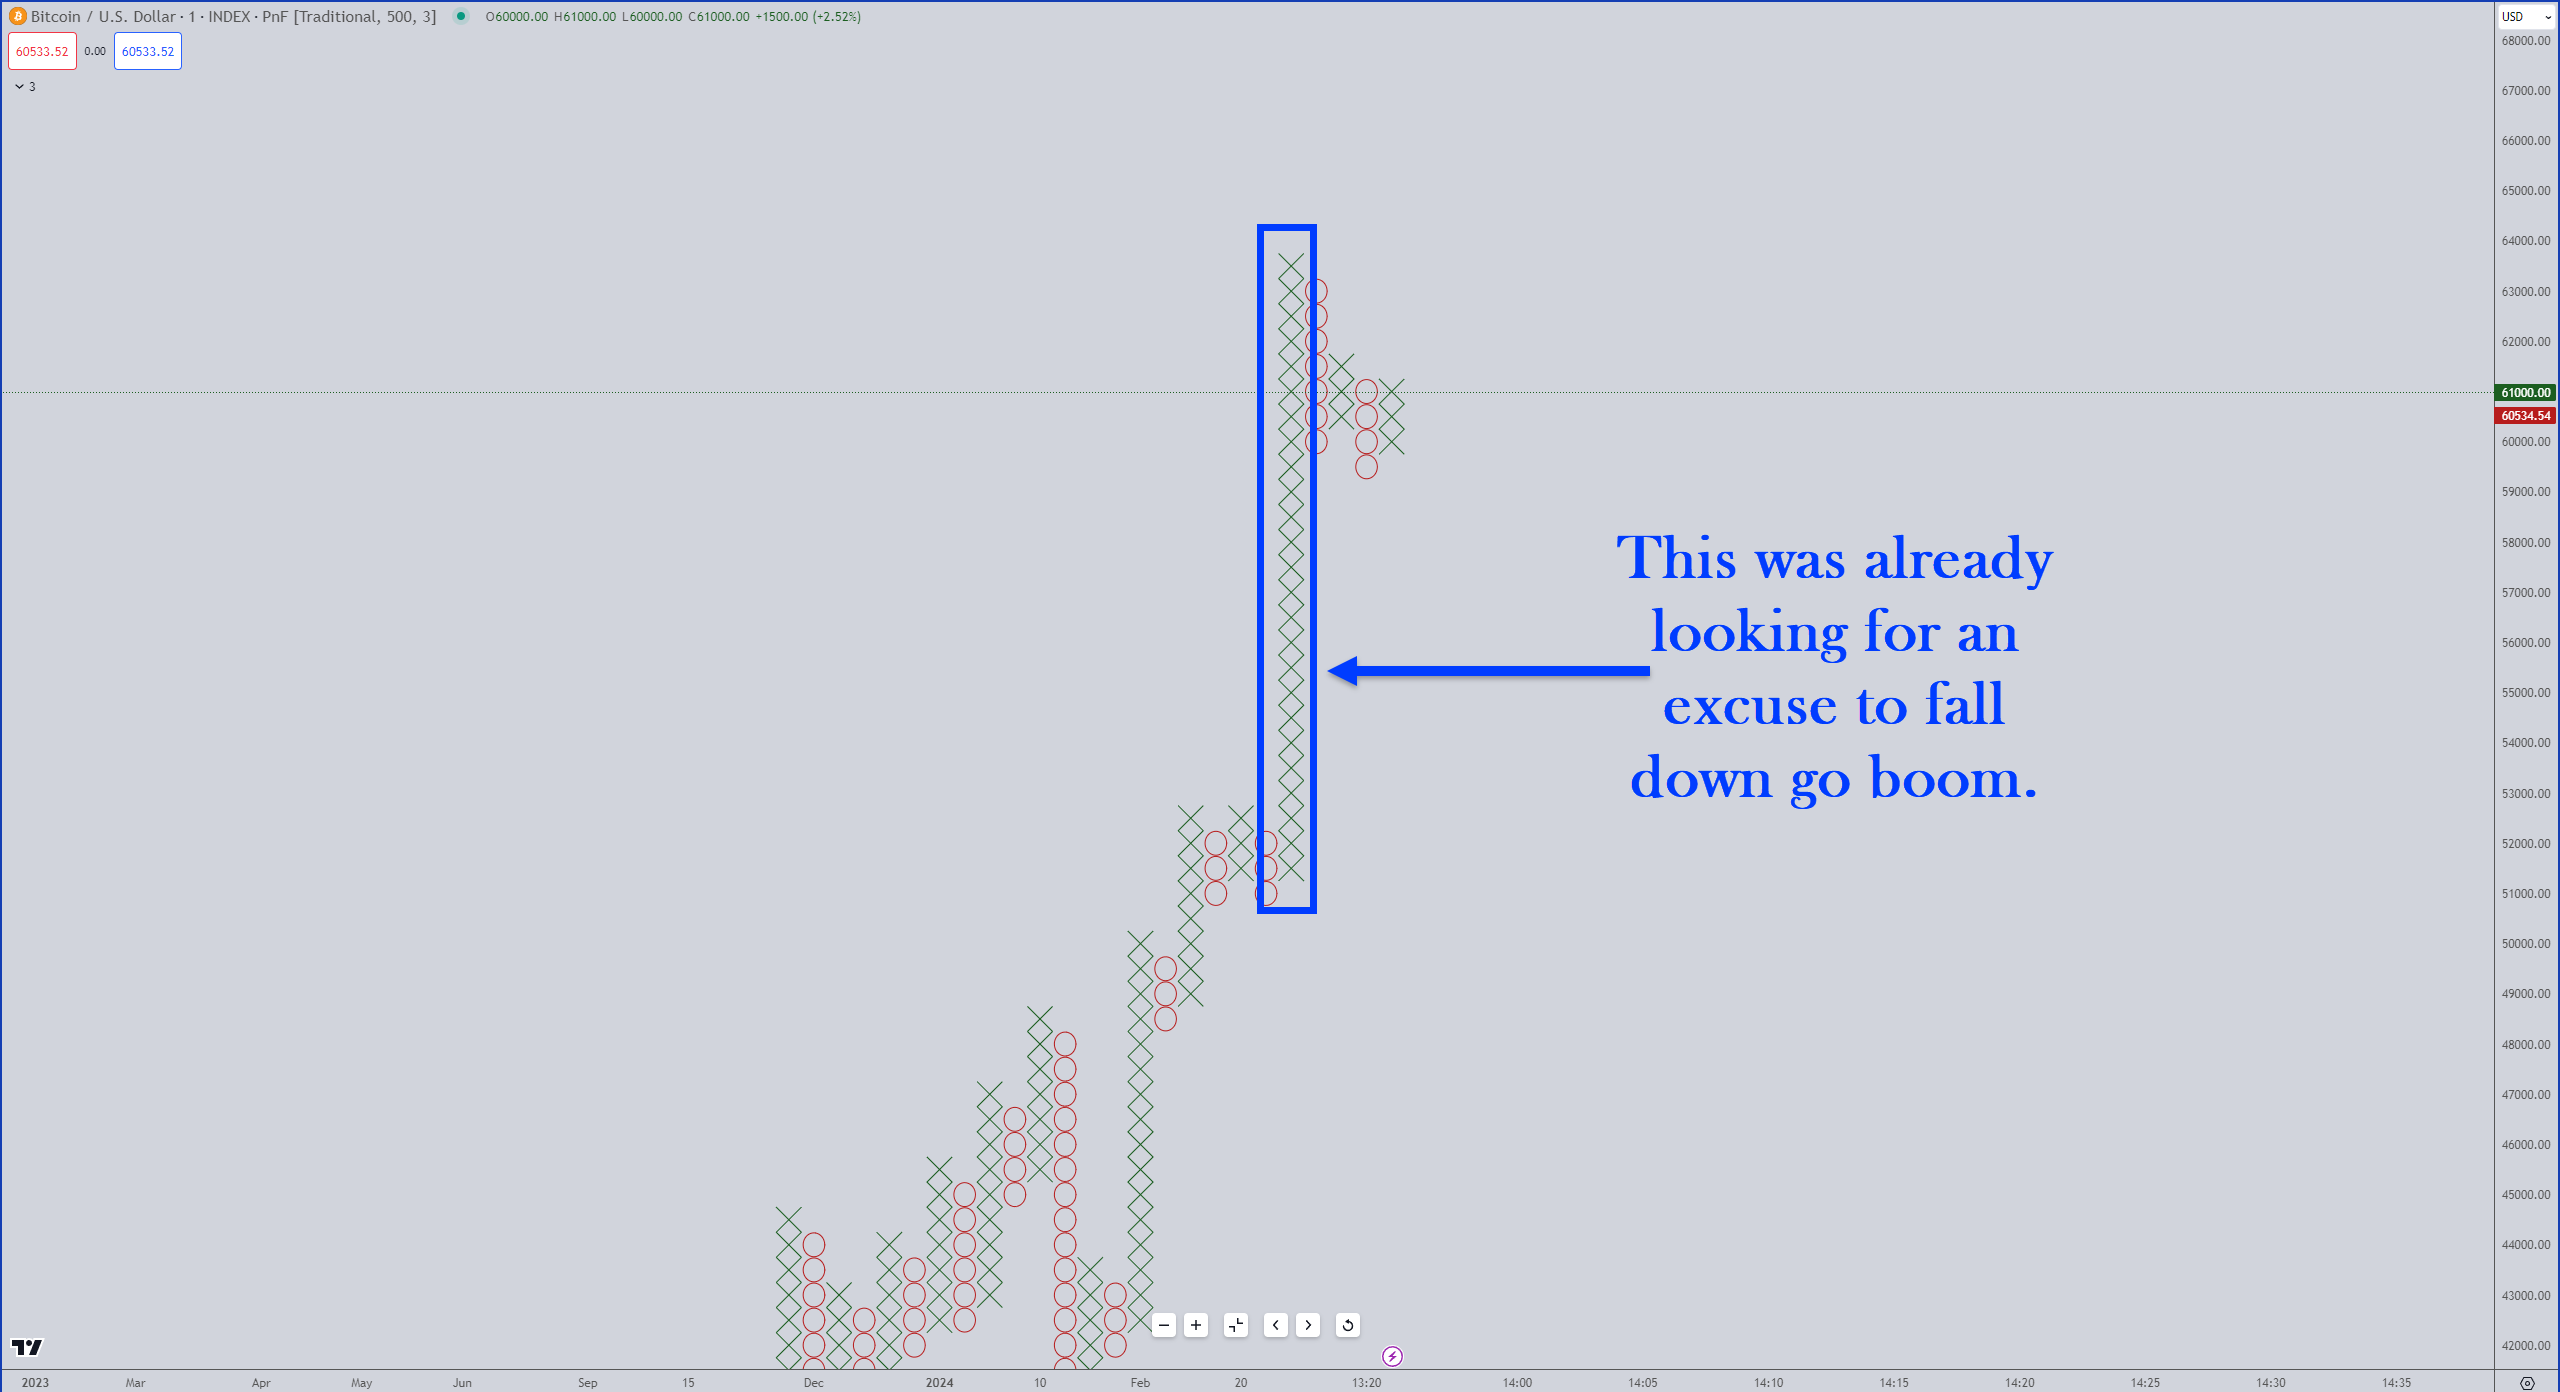
The chart above is a Point & Figure chart. You don’t need to know anything about it except for that hugenormous column of green X’s.
If you really want to learn about it, I recommend you watch this video here.
That massive column is called a Spike Pattern in Point & Figure – it’s the definition of exuberance and what you’d consider ‘overbought’. 🤯
The same Spike Pattern we just saw on Bitcoin’s chart is on Ethereum’s chart:
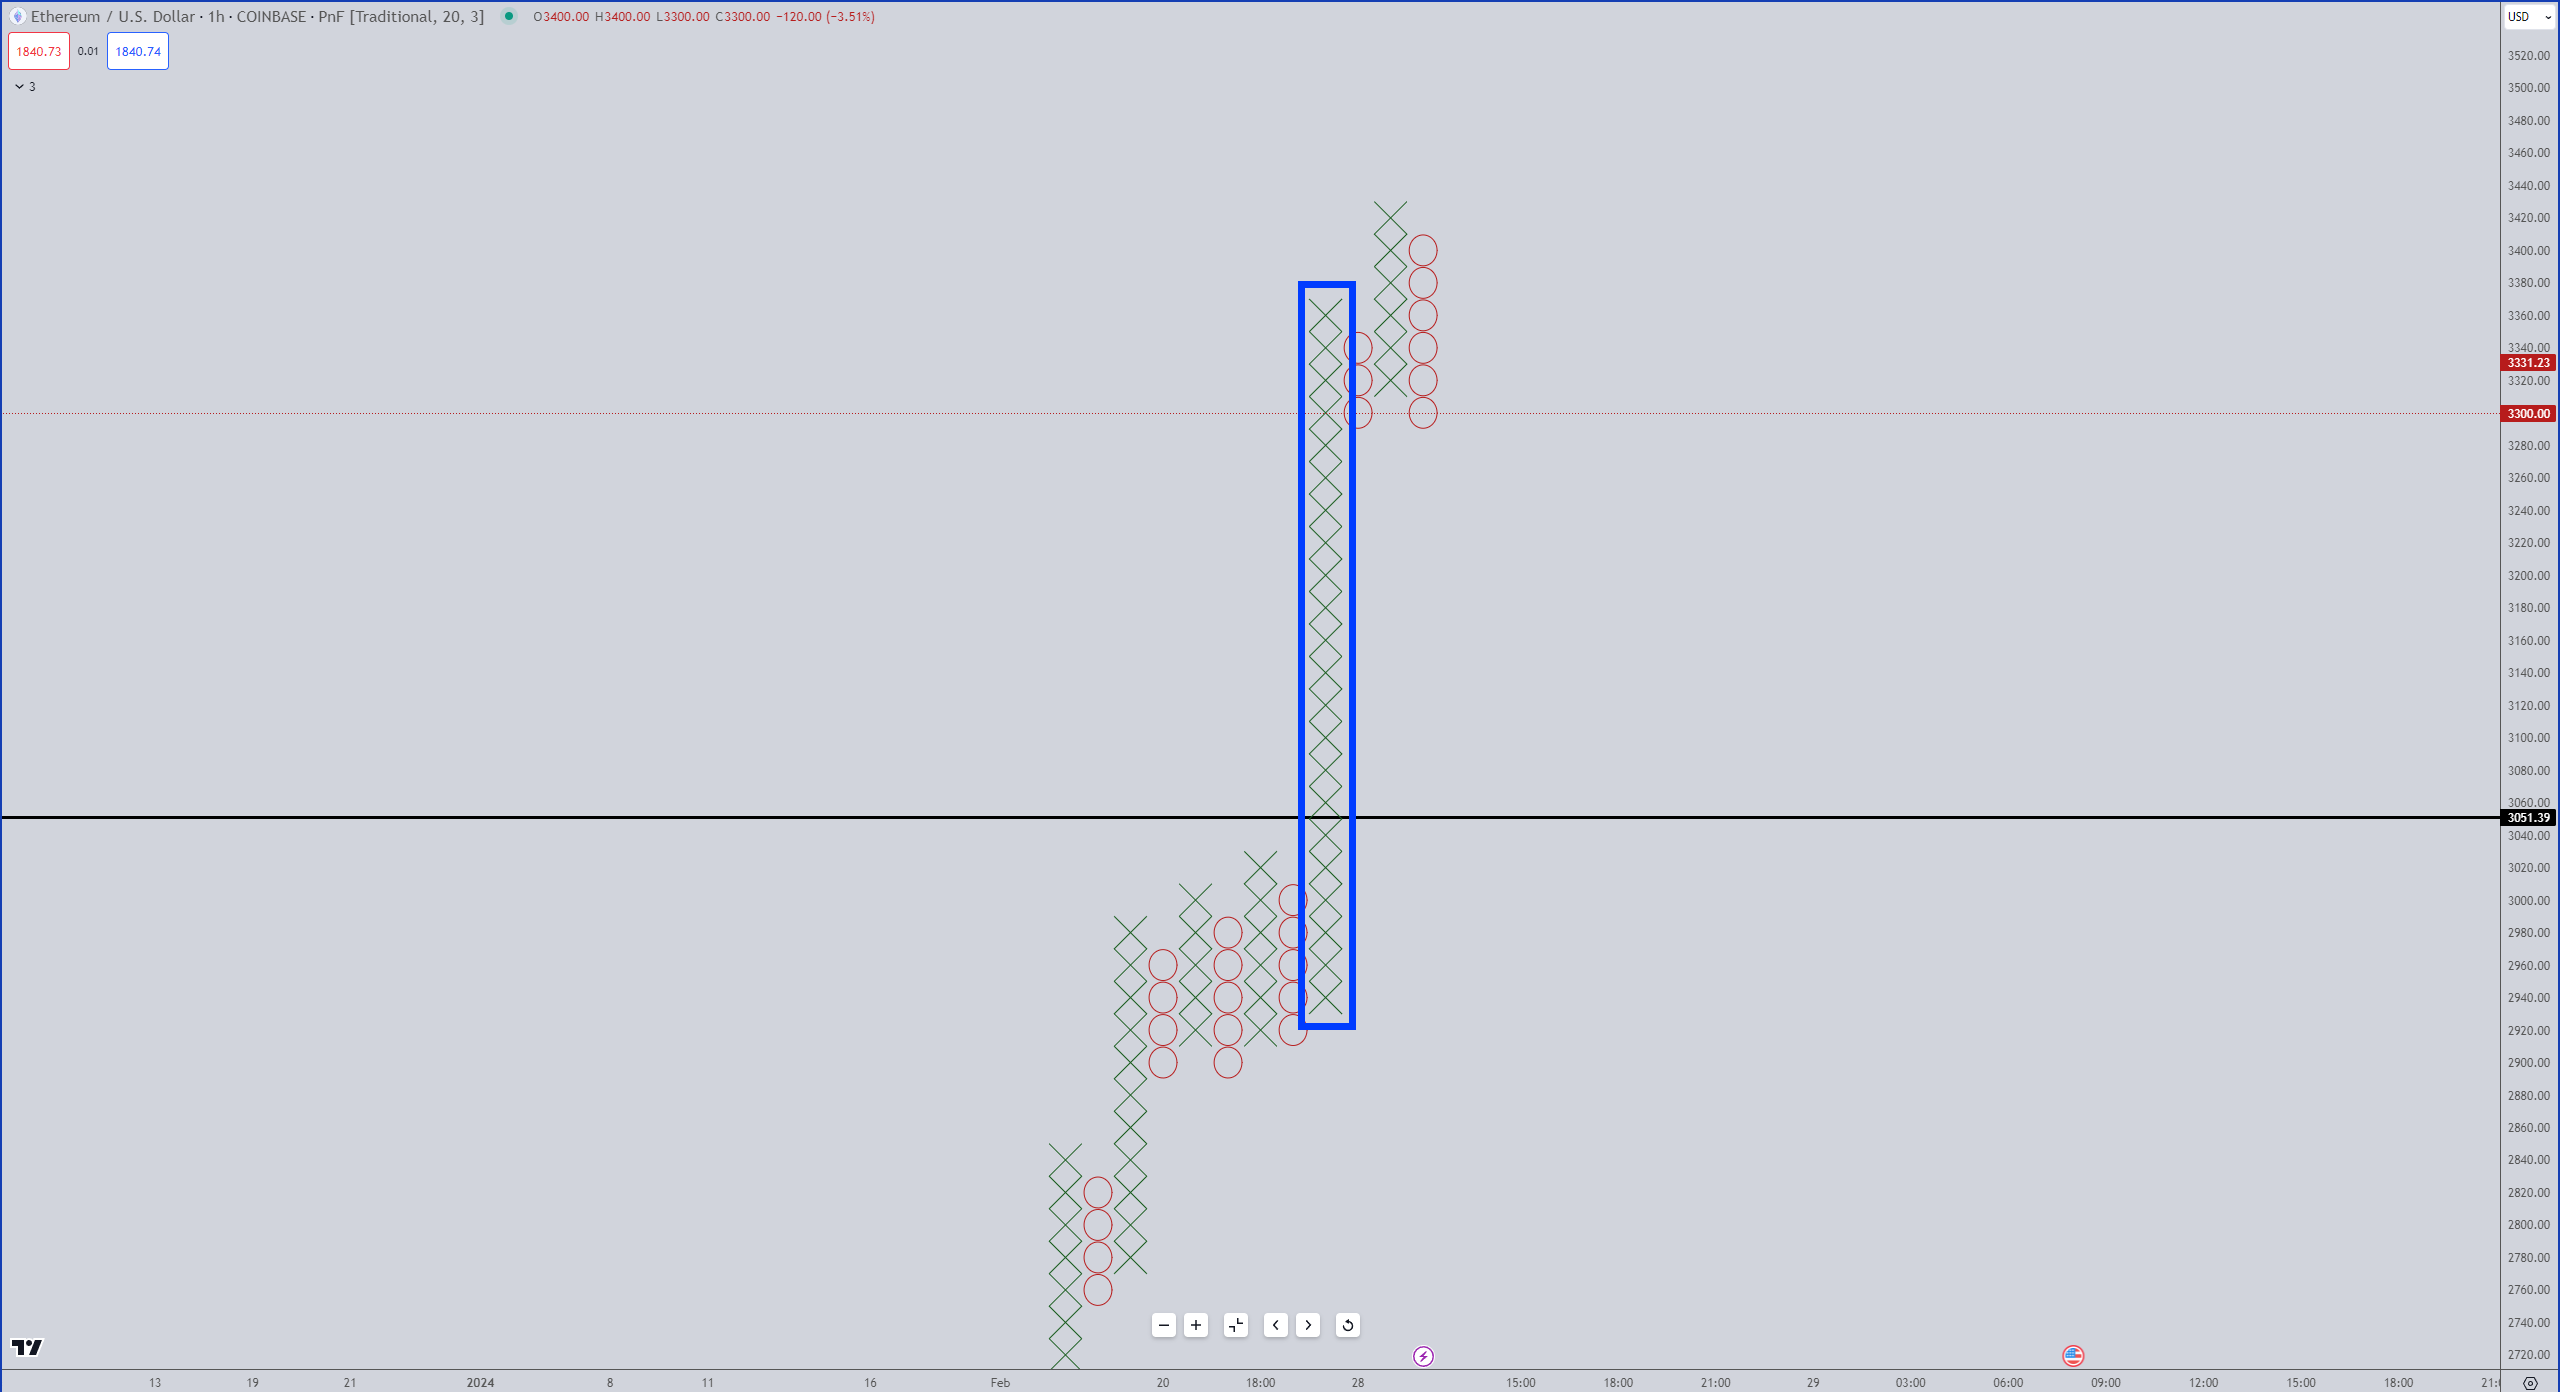
How bad could the retracement get? No idea. I know that a common retracement from a Spike Pattern is 50%. For Bitcoin, that’s a return to $57,500. For Ethereum, that’s a return to $3,150.
But let’s be honest here – the initial moves at the beginning of a new crypto expansion phase can be insane – so while the technical retracement is commonly 50%, crypto’s bull runs are anything but common. 🧠