
- Veteran commodities trader Ole Hansen said gold faces the risk of a deeper correction if it breaks below the 50-day moving average.
- Analysts point to a stronger U.S. dollar as a key driver of gold’s decline, with the U.S. Dollar Index rising over 2% since the Middle East conflict began.
- According to data from the CME FedWatch tool, there is a 98.9% probability of the Fed keeping the rates steady on Wednesday.
Gold prices are sliding, on track for a sixth consecutive session of losses, despite rising geopolitical tensions stemming from the war in the Middle East. This is an unusual trend for bullion, which is typically seen as a safe-haven asset, and it is currently flashing three signals that could potentially point towards a deeper pullback.
At the time of writing, spot gold (XAU/USD) fell more than 0.3% to $4,990 per ounce, while futures for May 2026 deliveries traded around 0.3% lower at $5,013.6 per ounce.
Since the war between the U.S., Iran, and Israel broke out on February 28, spot gold prices have declined nearly 6%.
The divergence is a reflection of a market that is increasingly being driven by macro forces rather than safe-haven flows.
Three Signals Point To Weakening Momentum
First, the precious metal is now testing its 50-day moving average (DMA) for the first time since early February. Secondly, the metal has been forming a pattern of lower highs on its daily chart, which indicates fading buying pressure. Spot gold formed a lower high on the daily chart on February 2 and fell nearly 5% in the following session.
Veteran commodities analyst Ole Hansen of Saxo Bank noted that gold continues to “struggle for momentum.” In a post on X on Wednesday, Hansen said the bullion faces the risk of a deeper correction if it breaks below the 50-day moving average near $4,978 per ounce, while a move above $5,080 an ounce could point to underlying strength.
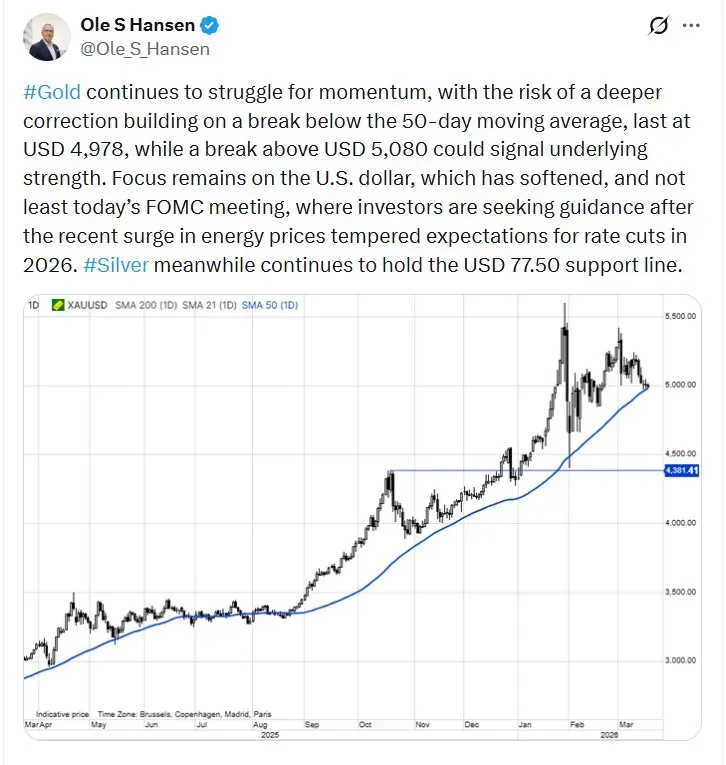
“Focus remains on the U.S. dollar, which has softened, and not least today’s FOMC meeting, where investors are seeking guidance after the recent surge in energy prices tempered expectations for rate cuts in 2026,” Hansen added.
He also added that silver continues to trade over its support at $77.5 an ounce. Spot silver (XAG/USD) was up 0.7% at $79.8 an ounce while contracts expiring in May 2026 fell 0.1% to $79.8 per ounce. Spot prices have declined around 17% since the war began.
And thirdly, the near 6% fall in gold prices since the Iran conflict began, could raise concerns that the current pullback may be more than a short-term dip.
Stronger Dollar Keeps Investors On The Sidelines
The U.S. Dollar has strengthened over the past few weeks, with the U.S. Dollar Index (DXY) gaining more than 2% since the war began. The DXY measures the greenback’s strength against a basket of six key currencies: the euro, Japanese yen, pound sterling, Canadian dollar, Swedish krona, and Swiss franc.
Rebecca Christie, a senior fellow at Bruegel, told Al Jazeera on Wednesday that a stronger dollar can make it harder for investors to drive gold prices higher, since the metal is priced in U.S. currency.
“Also, a rising dollar provides an alternative safe-haven choice, and higher oil prices probably will lead to higher inflation, which also will make the dollar more attractive,” Christie said.
All Eyes On Fed Rate Decision
Investors will also keep an eye on the U.S. Federal Reserve’s rate decision later on Wednesday, amid rising inflation risks driven by the Middle East conflict.
According to data from the CME FedWatch tool, there is a 98.9% probability of the Fed keeping the rates steady and a 1.1% chance of a 25-basis-point rate increase. A week back, the figures stood at 99.9% and 0.1%, respectively.
Gold Miners Track The Weakness
Meanwhile, major gold miners Barrick Mining Corp (B) and Newmont Corp. (NEM) fell 0.4% and 0.7%, respectively, in pre-market trading on Tuesday. B shares have declined around 10.6% and NEM stock has shed around 11.6% since the war began.
Meanwhile the SPDR Gold Shares ETF (GLD) was down more than 1% in pre-market trading, having shed 5% since the close of trading on February 27. Year-to-date, it has gained more than 14%.
For updates and corrections, email newsroom[at]stocktwits[dot]com.