Palladium Perks Up

While we’ve already touched on gold moving to fresh all-time highs over the last two weeks, other precious metals are also catching a bid after a rough few years. πŸ‘€

Below is a chart that technical analysts have been eying this week as palladium futures attempt to reverse their downward course. The weekly line chart goes back to 2010 and shows prices bouncing back from the $800 to $900 region, which has served as a transition area for buyers/sellers over the last 14 years. πŸ“Š

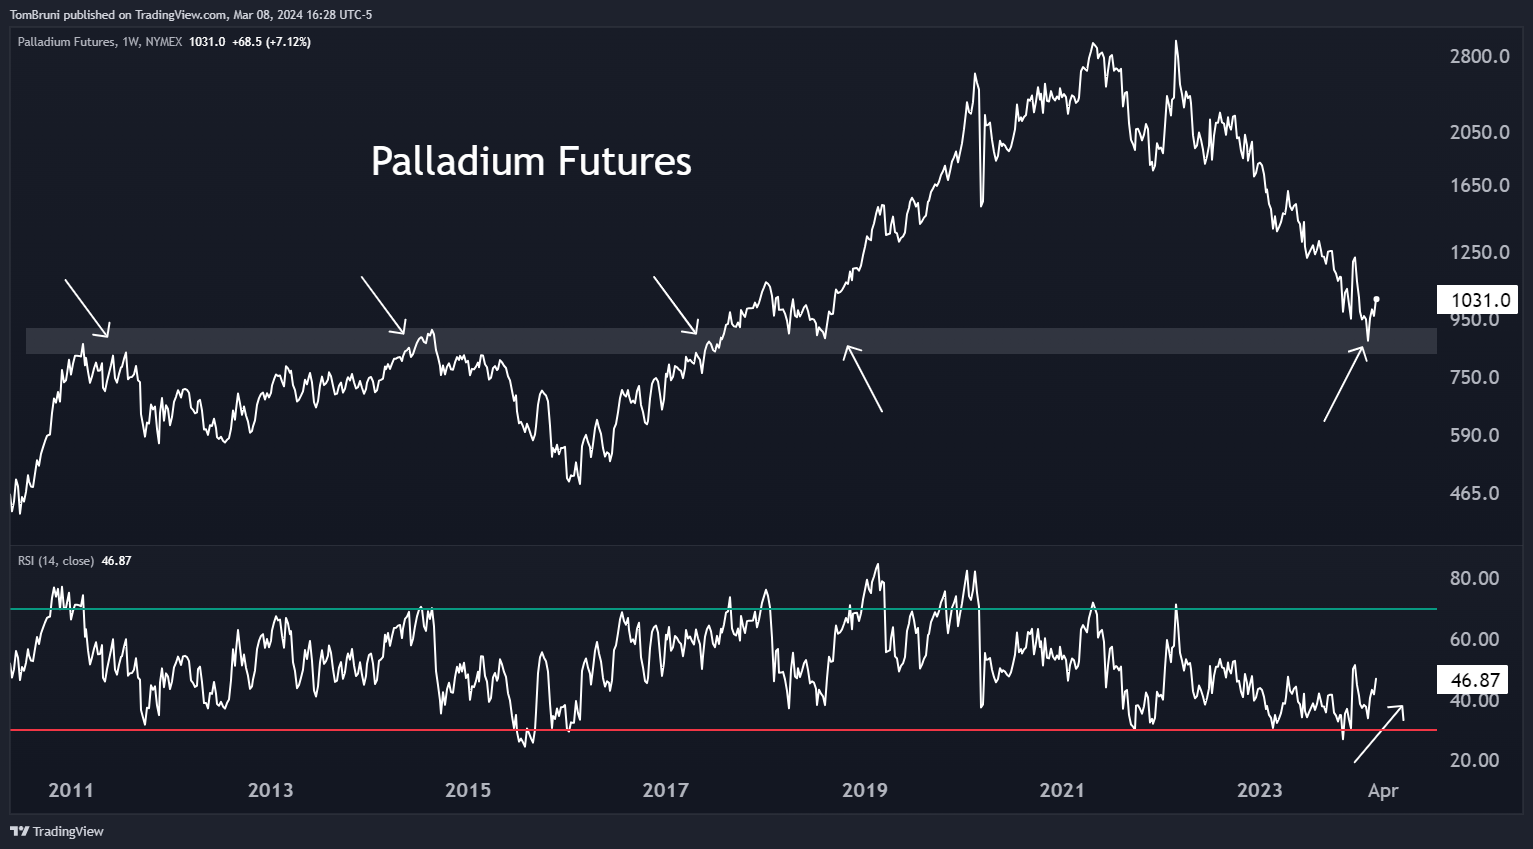
Additionally, technical analysts say the relative strength index (RSI) shows momentum improving even as prices made new lows earlier this year. This is what they refer to as a “bullish divergence” and is often looked at as a signal of a coming trend reversal. πŸ”Ί

In addition to the improving price action and momentum, some traders say speculators are positioned poorly for this market, holding record short positions. That means commercial hedgers, who are the actual companies dealing with physical palladium on a daily basis, are loading the boat long. And they wouldn’t be doing that unless they had a hunch that prices were heading higher. πŸ€”

Now, commercial hedgers have very deep pockets and are often way early to trend reversals. But, analysts say the combined factors above paint a compelling case for prices to continue rising from here…especially if the rest of the precious metals space continues to perform well, too. 🀷

Learn More About...

Trees Revolt As Lumber Roars Back

It’s Friday afternoon, and we’re sure your brains are melting from all the earnings and economic data this week. So let’s send you off into the weekend sunset with an under-the-radar chart. 🀫

That chart is of lumber futures.

Read It

Gold Shimmers Around $2,000/Oz

Precious metals have not gotten much fanfare lately, especially with palladium in a downtrend and platinum and silver stuck in messy ranges. πŸ’€

However, one that continues to pop up on investor and trader radars is gold, which is once again trying to break above $2,000/oz. Below is a chart showing prices stuck in a range for the last 2.5 years, each time failing to sustain a break above resistance. πŸ”

Read It

Natural Gas Is Moving Fast

Okay, maybe not fast. But it certainly is moving differently than it has been. After falling about 80% from its highs from August to March, natural gas futures have been taking the first step to reverse their trend…stop going down. ⏸️

Below is a daily chart of natural gas futures trading in a $2.00 to $2.65 range for the last five months. But this week, traders are putting it back on their radar due to its strength relative to the rest of the energy commodity complex. With crude oil, gasoline, and heating oil all falling several percent this week, natural gas’s nearly 5% gain certainly stands out. πŸ€”

Read It