Natural Gas Is Moving Fast

Okay, maybe not fast. But it certainly is moving differently than it has been. After falling about 80% from its highs from August to March, natural gas futures have been taking the first step to reverse their trend…stop going down. ⏸️

Below is a daily chart of natural gas futures trading in a $2.00 to $2.65 range for the last five months. But this week, traders are putting it back on their radar due to its strength relative to the rest of the energy commodity complex. With crude oil, gasoline, and heating oil all falling several percent this week, natural gas’s nearly 5% gain certainly stands out. πŸ€”

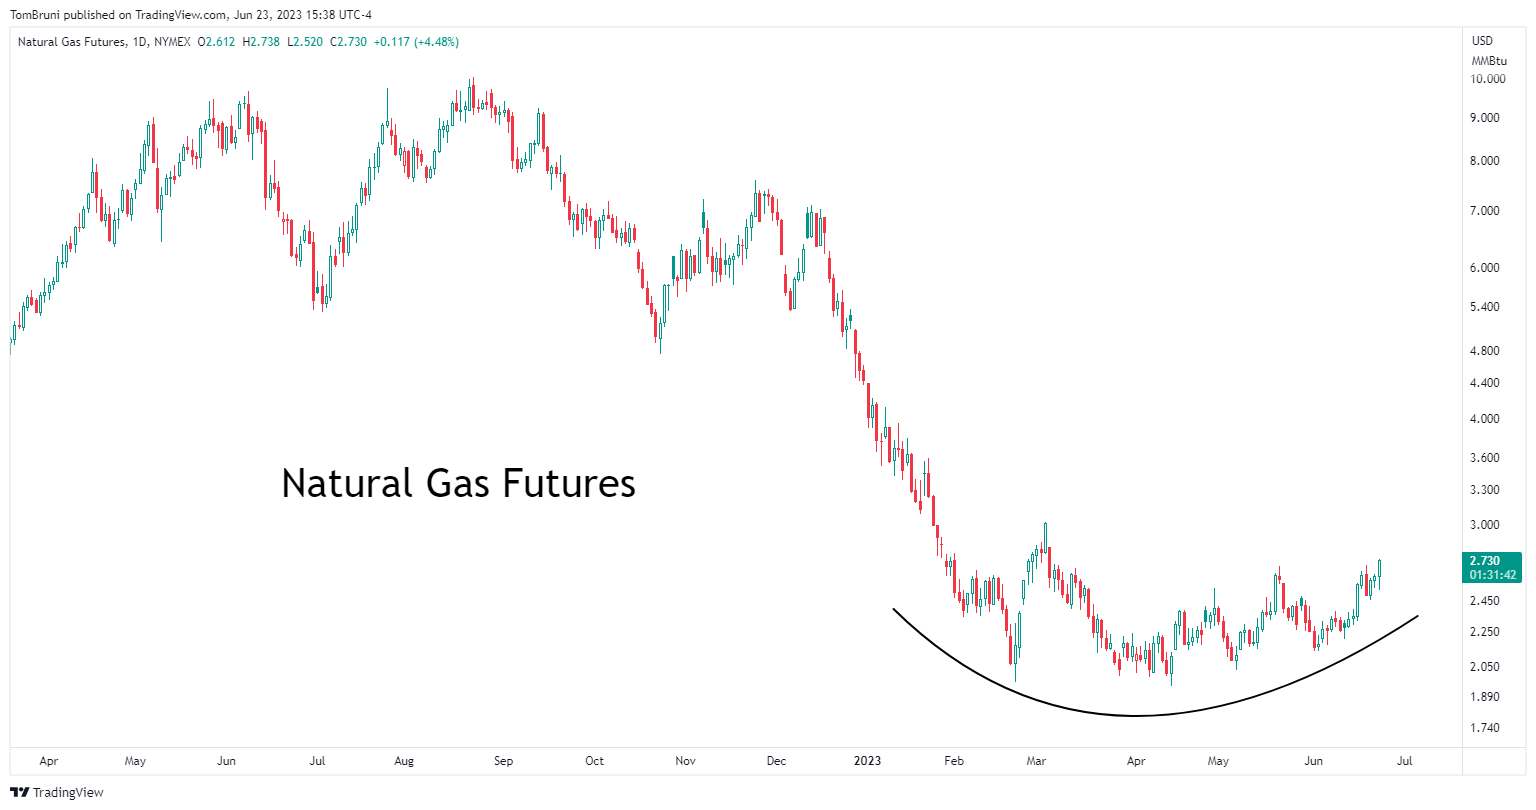
And from a long-term perspective, some investors and traders see the current area as an interesting one. The daily chart below shows prices stabilized above the $2.00 level that’s acted as an important support and resistance level over the last few years. For the non-technical analysts in the room, that simply means an area where there’s been a significant shift in supply and demand. 🧭

Earlier in the year, there was a lot of activity in natural gas on the short side. Inverse and leveraged ETFs were regularly trending on our streams as traders played the trend to the downside. But so far…there hasn’t been much activity as prices have started to move higher. πŸ”ˆ

That lack of interest is catching traders’ attention, who believe this week’s rally is the beginning of a new uptrend. Time will tell, as always. But we figured we’d point it out as an interesting, under-the-radar development in the volatile natural gas market. πŸ‘€

Copper Crumbles Amid Recession Fears

If you’ve been consuming financial market-related content for a while, you’ve probably heard the phrase “Dr. Copper” at some point. Well, the doctor was in today, so let’s hear what he had to say. πŸ‘‚

For those of you confused, market participants often refer to copper futures as “Dr. Copper.” The reasoning is that copper is an industrial metal critical for most aspects of global economic growth. As a result, investors and traders will often use copper futures as a liquid market to express their views of the economy. And for those that don’t trade it directly, they look at it as a barometer for the overall market’s economic outlook. 🧭

Read It

Oil & Gas Sector Loses Its Energy

After a strong run throughout the summer, it’s been a rough two weeks for energy-related commodities and stocks. Today, an accelerating decline helped bring the sector back to the forefront of investors’ conversation. Let’s take a look at why. πŸ‘‡

In very short-term fundamental news, gasoline inventories surprised to the upside today on weak demand. That caused the commodity to extend its recent selloff. But more importantly, we also saw heating oil and crude oil selloff in tandem after holding relatively strong during gasoline’s pullback.

Read It

Sugar Hits Sweet Spot As Gold Shines

It was a slow day out there, but several commodities caught traders’ eyes. Let’s see which ones. πŸ‘€

First up is sugar futures, which have experienced a nearly 30% decline since the beginning of November. While its major decline is one reason to be on people’s radars, technical traders say prices have reached the 20-20.50 area that served as an inflection point over the last two years.

Read It