Lot’s of movement out there; let’s dive right in and see what analysts are looking at for support and resistance with Hedera Hashgraph and XRP. 💦
As always, zip to the end of each crypto analysis if you want the TL;DR (Too Long; Didn’t Read) version and want to avoid the nerd speak.
Hedera Hashgraph
$HBAR has been on a tear all year so far, easily one of the best-performing assets of the year – and it’s been very quiet about it, too.
From the perspective of the Ichimoku Kinko Hyo system, one bullish event from last week’s close extended into this week: The Chikou Span in ‘Open Space’.
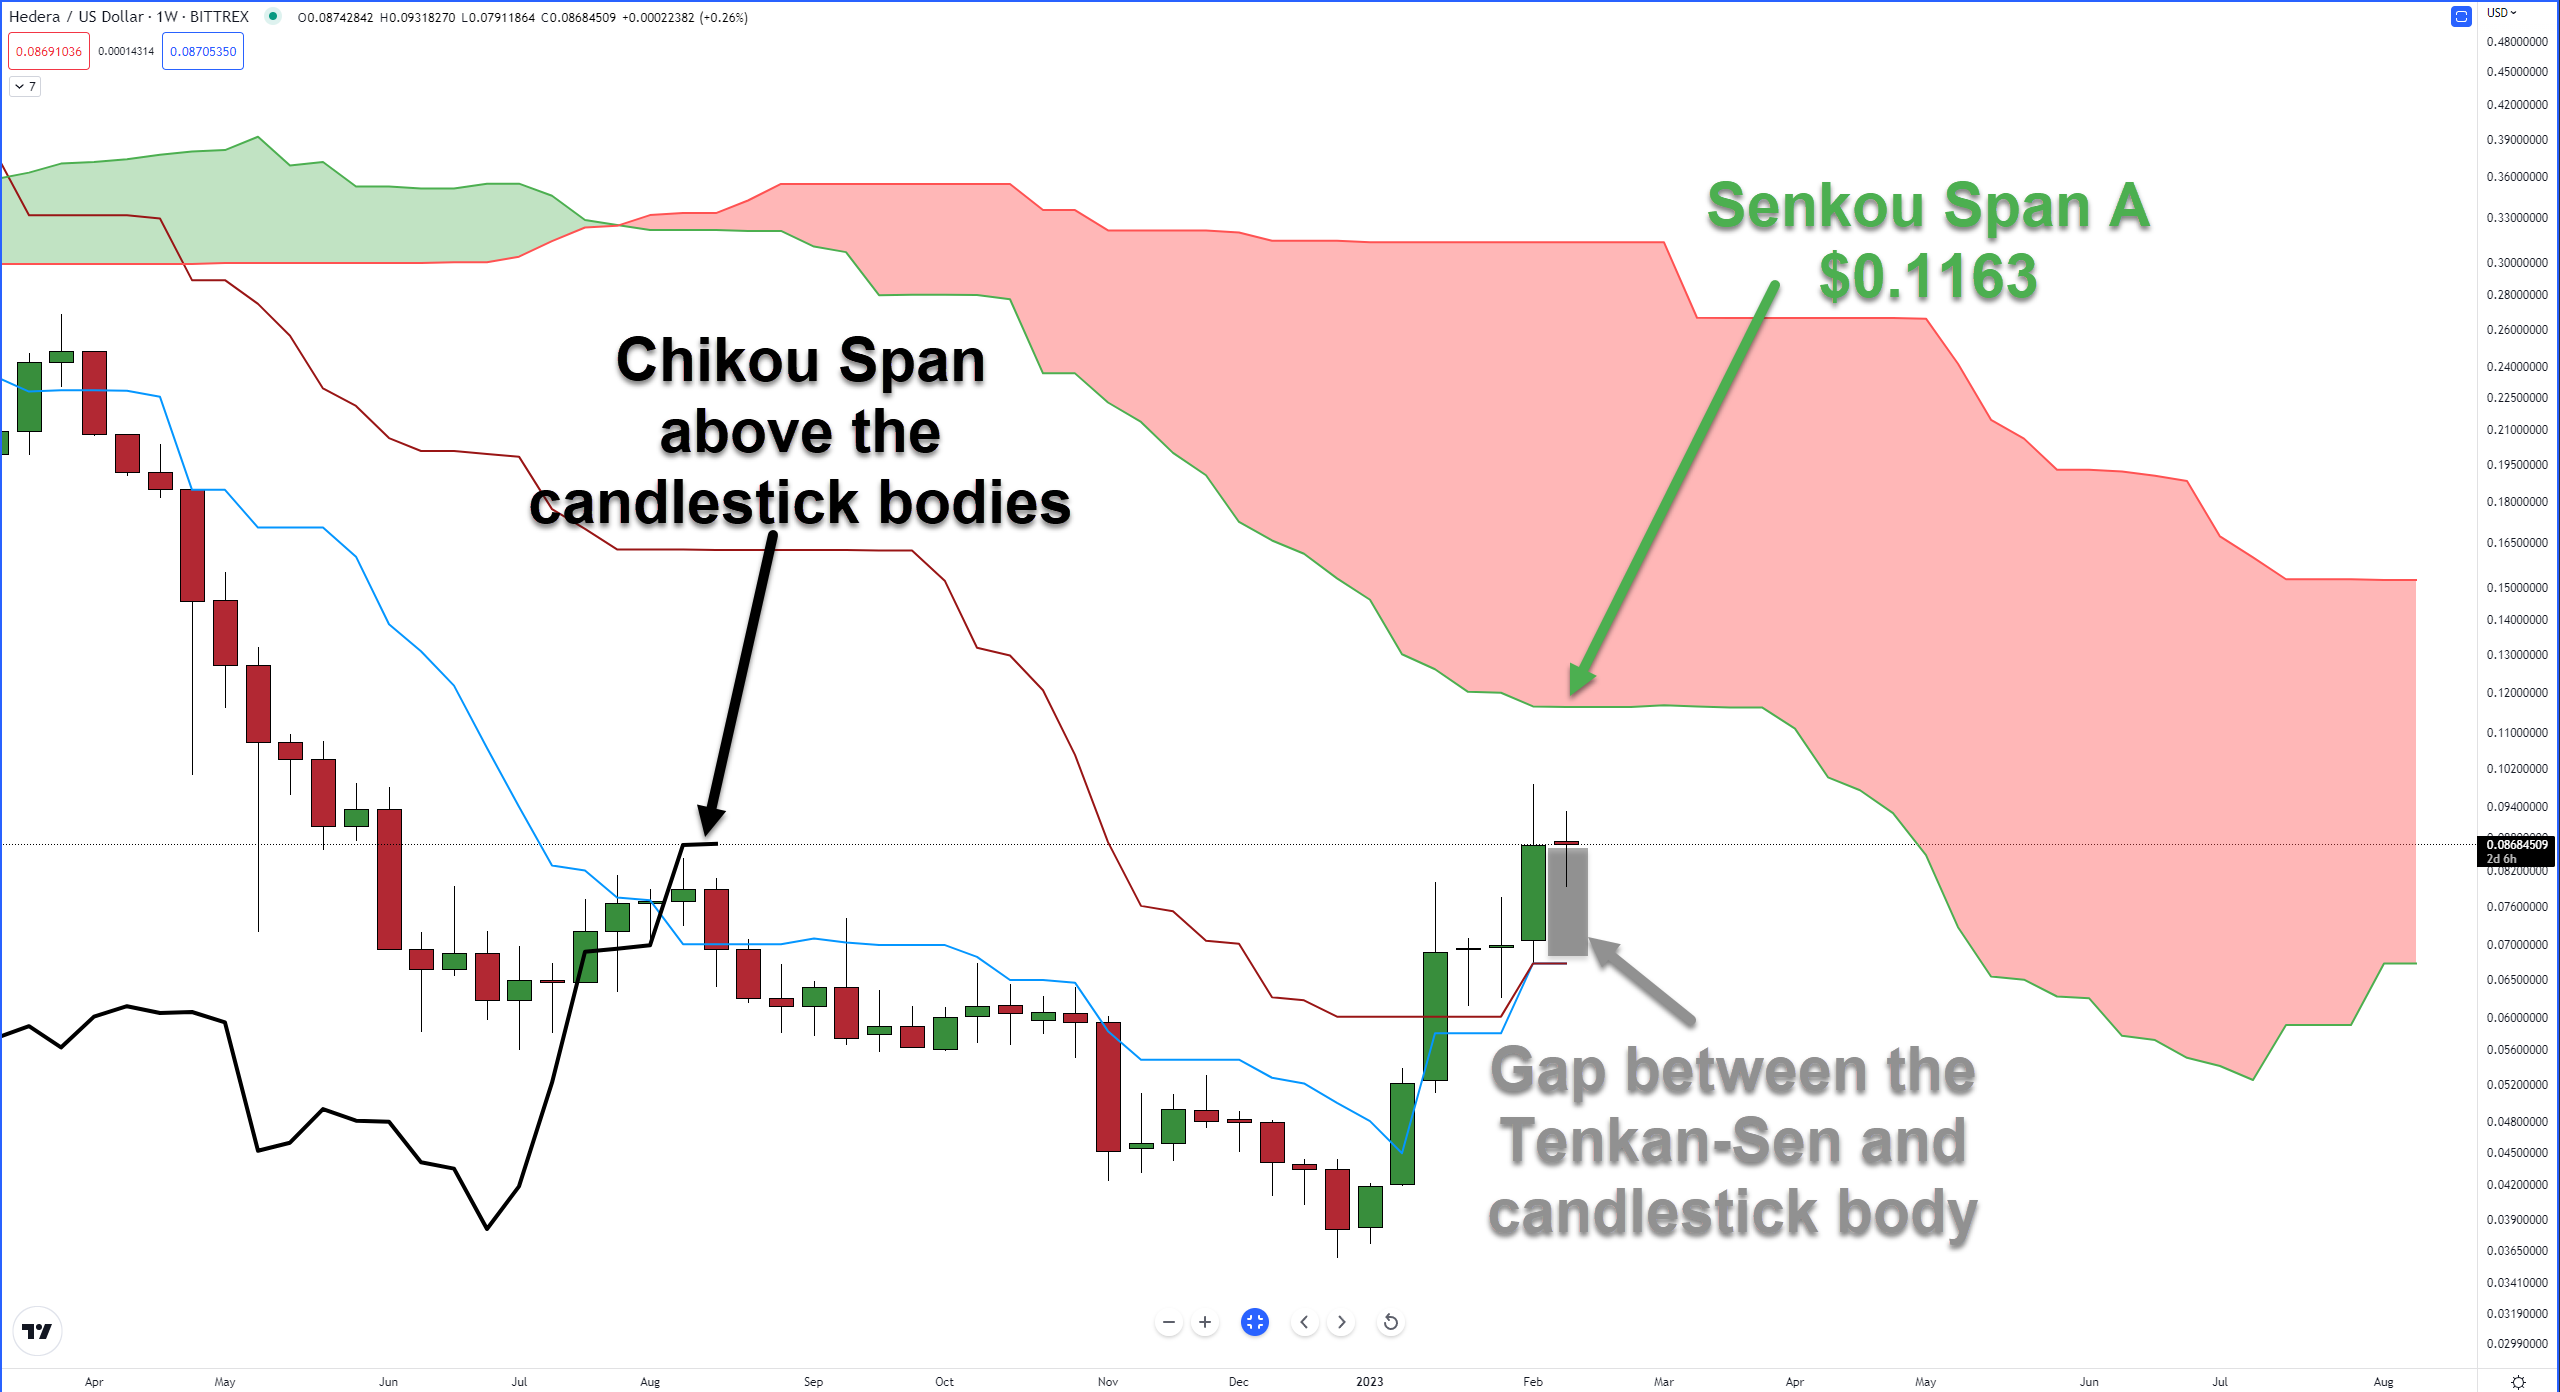
‘Open Space’ is a condition (created by Manesh Patel) where the Chikou Span won’t intercept the body of any candlesticks over the next five to ten periods – it’s a sign that there is minimal resistance ahead and price action, theoretically, has an easier time moving higher.↗️
On the weekly chart, the next resistance level within the Ichimoku system doesn’t occur until the bottom of the Ichimoku Cloud (Senkou Span A) at $0.1163.
Additionally, this is the first week where there is a noticeable gap between the Tenkan-Sen and the body of the candlestick – not an immediate issue of weakness, but a warning that the market is currently out of equilibrium in price and time.
Dropping the Ichimoku system and going into more traditional Western analysis highlights some of the ‘top heavy’ warnings analysts see.
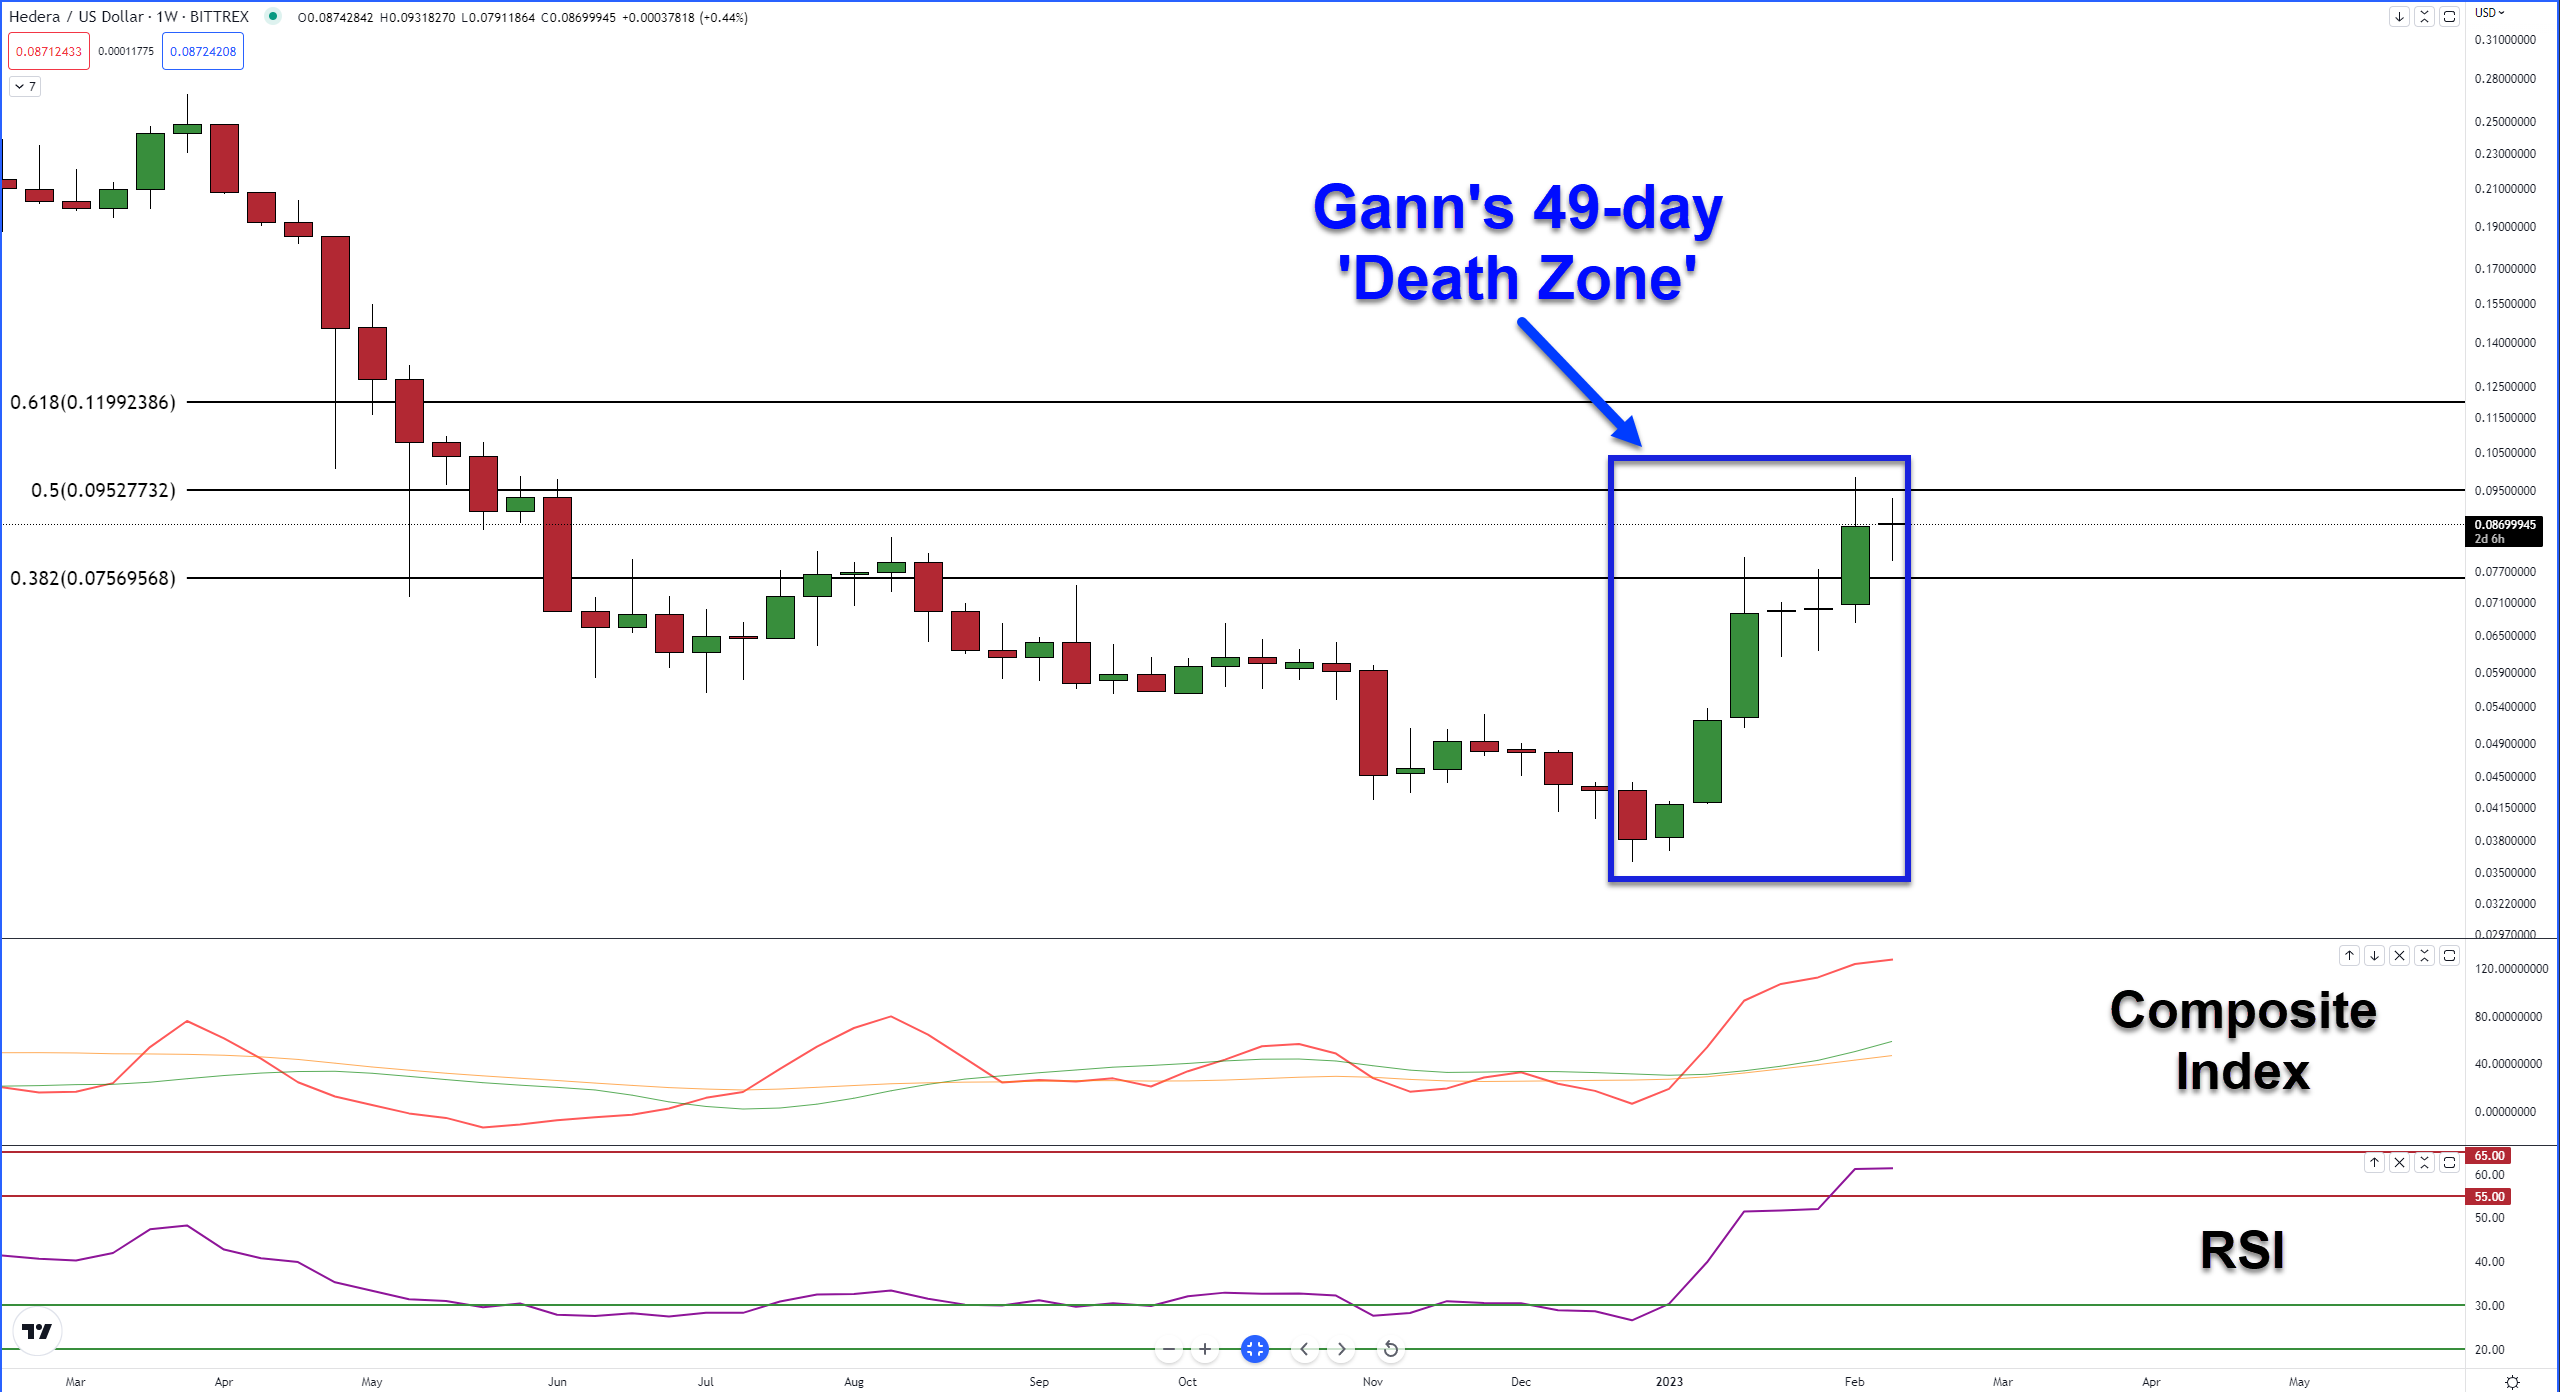
Last week’s and this week’s price action saw movement towards the $0.09 value area halt against the 50% Fibonacci retracement at $0.095.
Note the 61.8% Fibonacci retracement level of $0.12 is close to Senkou Span A ($0.1163).
Using Gann’s Cycles of the Inner Year, Hedera is inside what Gann called his ‘Death Zone’ – a 49-day (seven-week) cycle. Gann warned that any instrument trending strongly in a single direction over 49-52 days has a high probability of facing a strong and swift corrective move. ☠️
Contributing to what analysts see as at least a temporary halt in Hedera’s spike is the Relative Strength Index and Composite Index oscillators.
The RSI on Hedera’s weekly chart remains in bear market conditions (Oversold 30 and 20, Overbought 55 and 65). If you want an idea of how beat up HBAR has been, the current RSI level tell us all we need to know.
The current RSI level of 61 is the highest since the week of November 15, 2021. That’s 65 weeks.
Similarly, the Composite Index is trading at an extreme high. How extreme? Pretty damn extreme – it hit a new all-time high on its weekly chart.
TL;DR
Does this mean Hedera is poised for a total price collapse? Not at all. Given the positive momentum that still exists in the space, analysts expect some minor profit-taking and sidewise price action in the near future. 👀
Resistance level(s) analysts see: $0.1163 – $0.12
Support level(s) analysts see: $0.673
XRP
It’s been a while since we’ve looked at $XRP.
We’ll start looking at XRP’s price action with a price behavior in Gann Analysis known as a Foldback. But first – what the heck is a Foldback?
A Foldback is a theory that markets repeat the same swing structures – not the same price levels or the exact time in a swing, but the same structure.
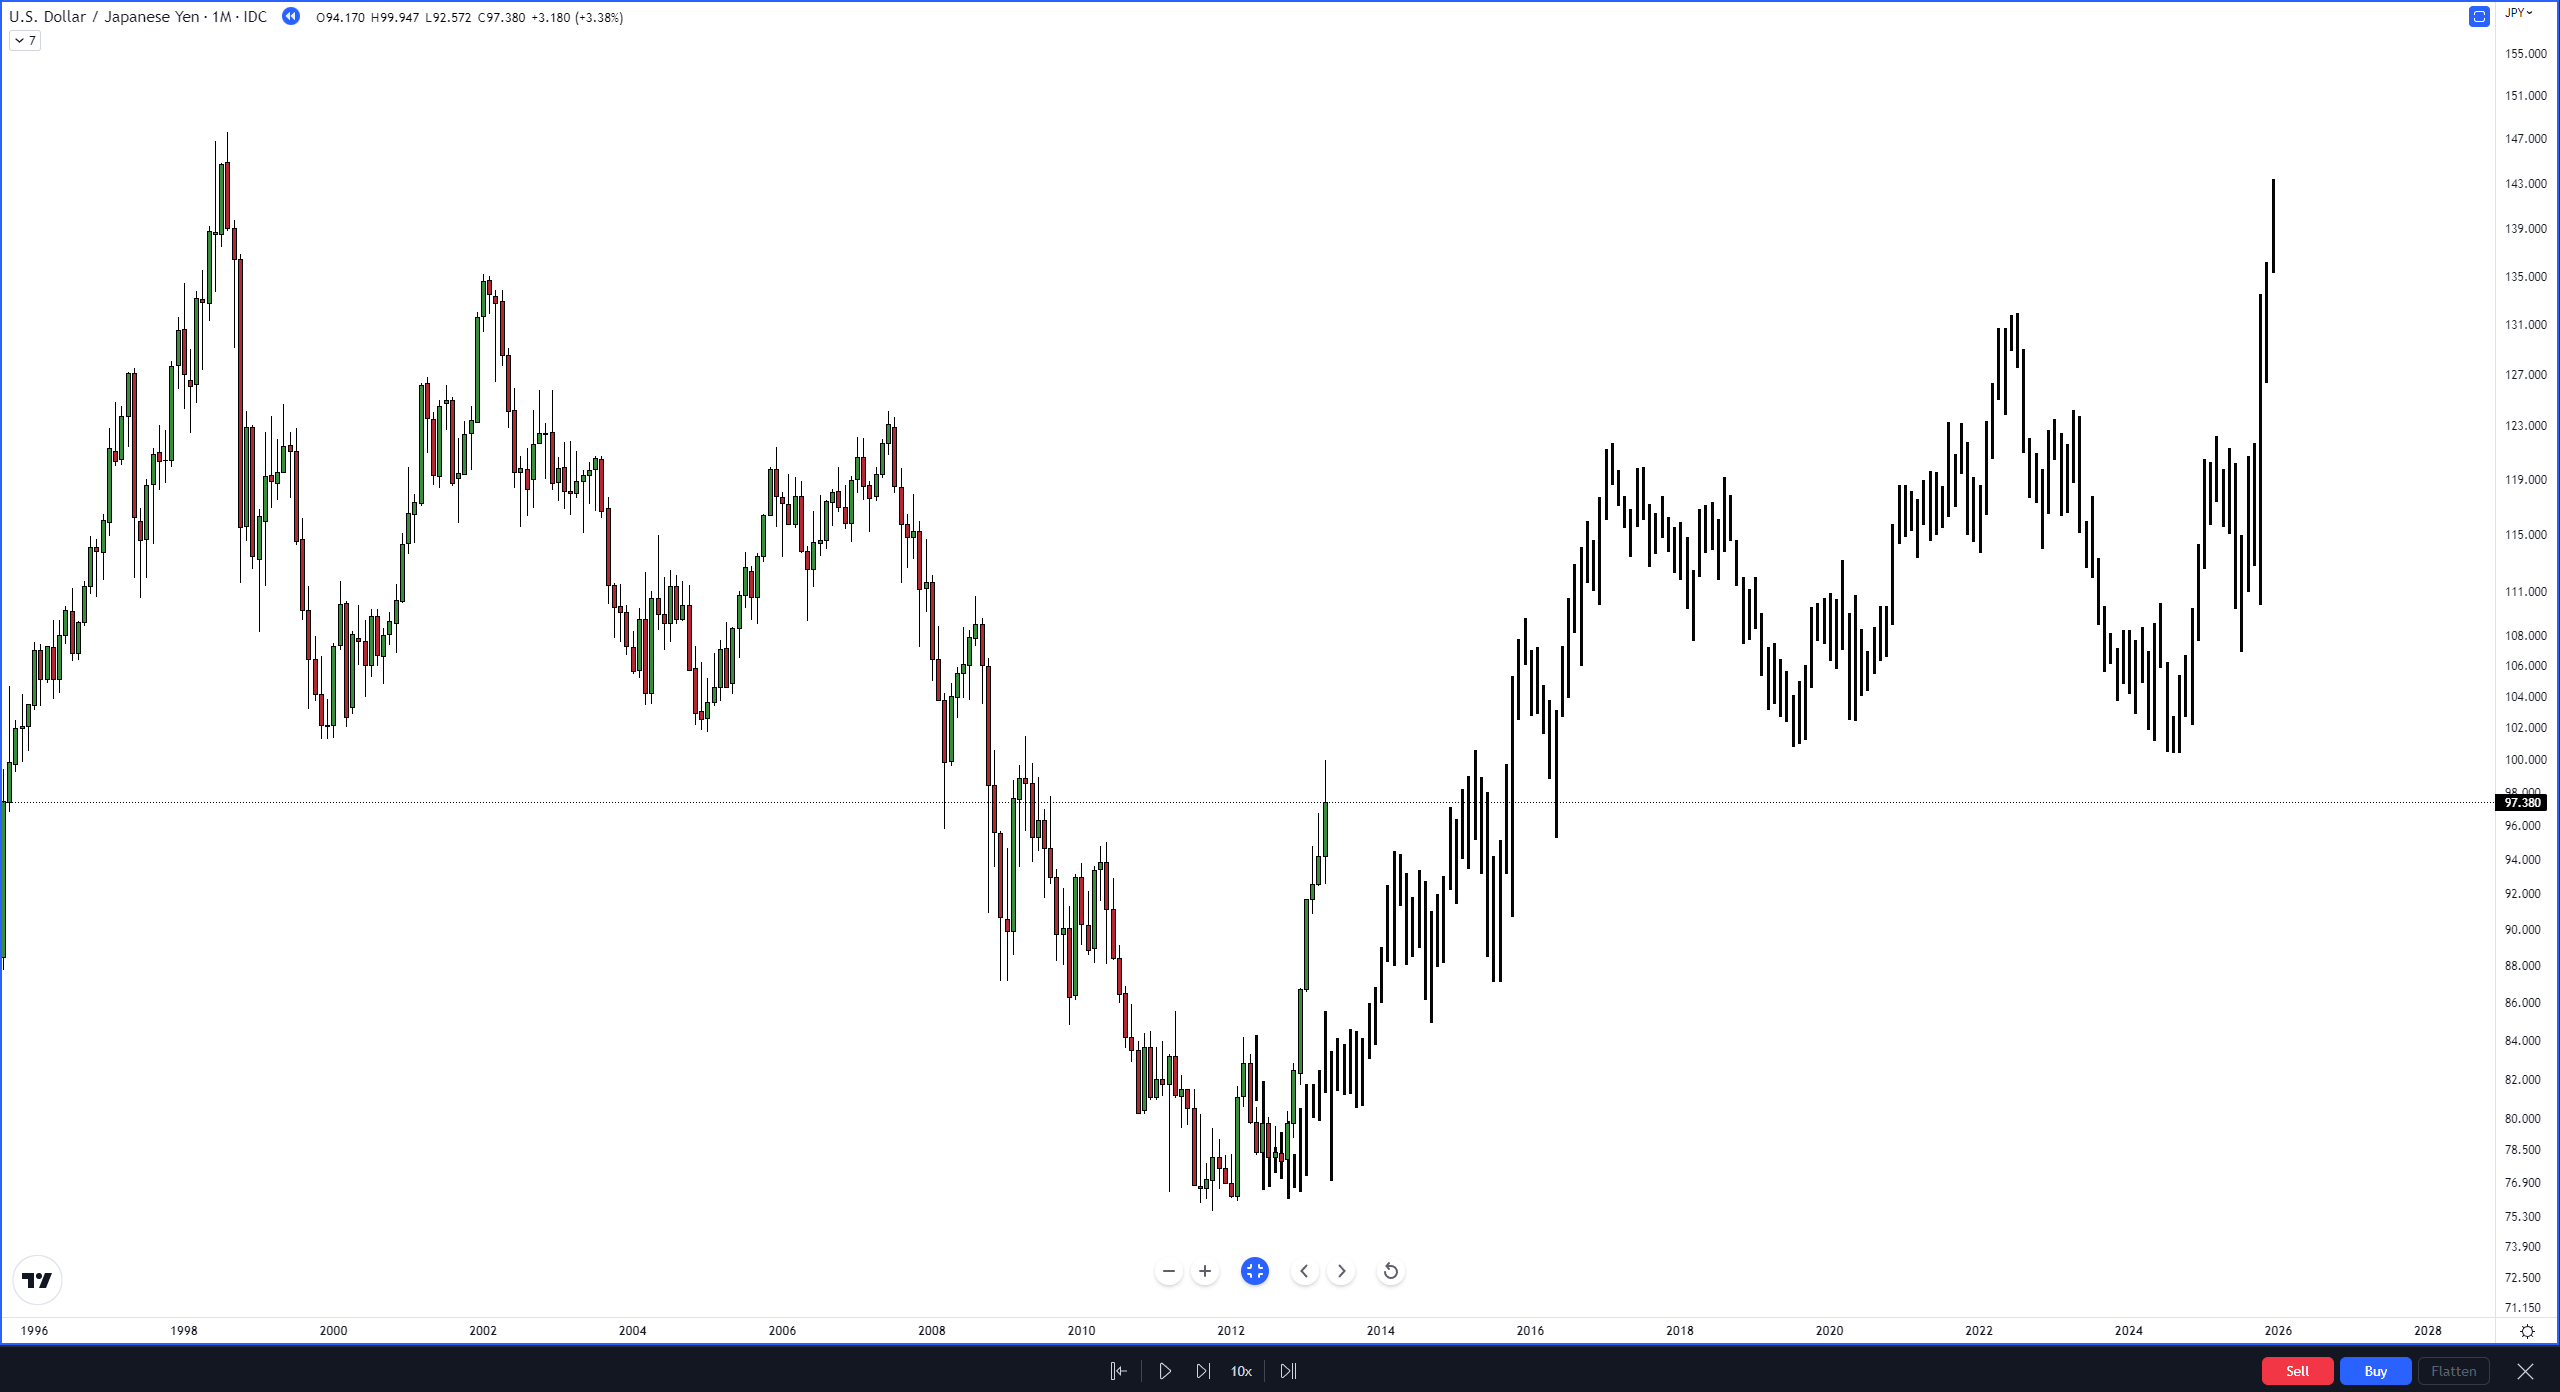
Take the $USDJPY Forex pair as an example:
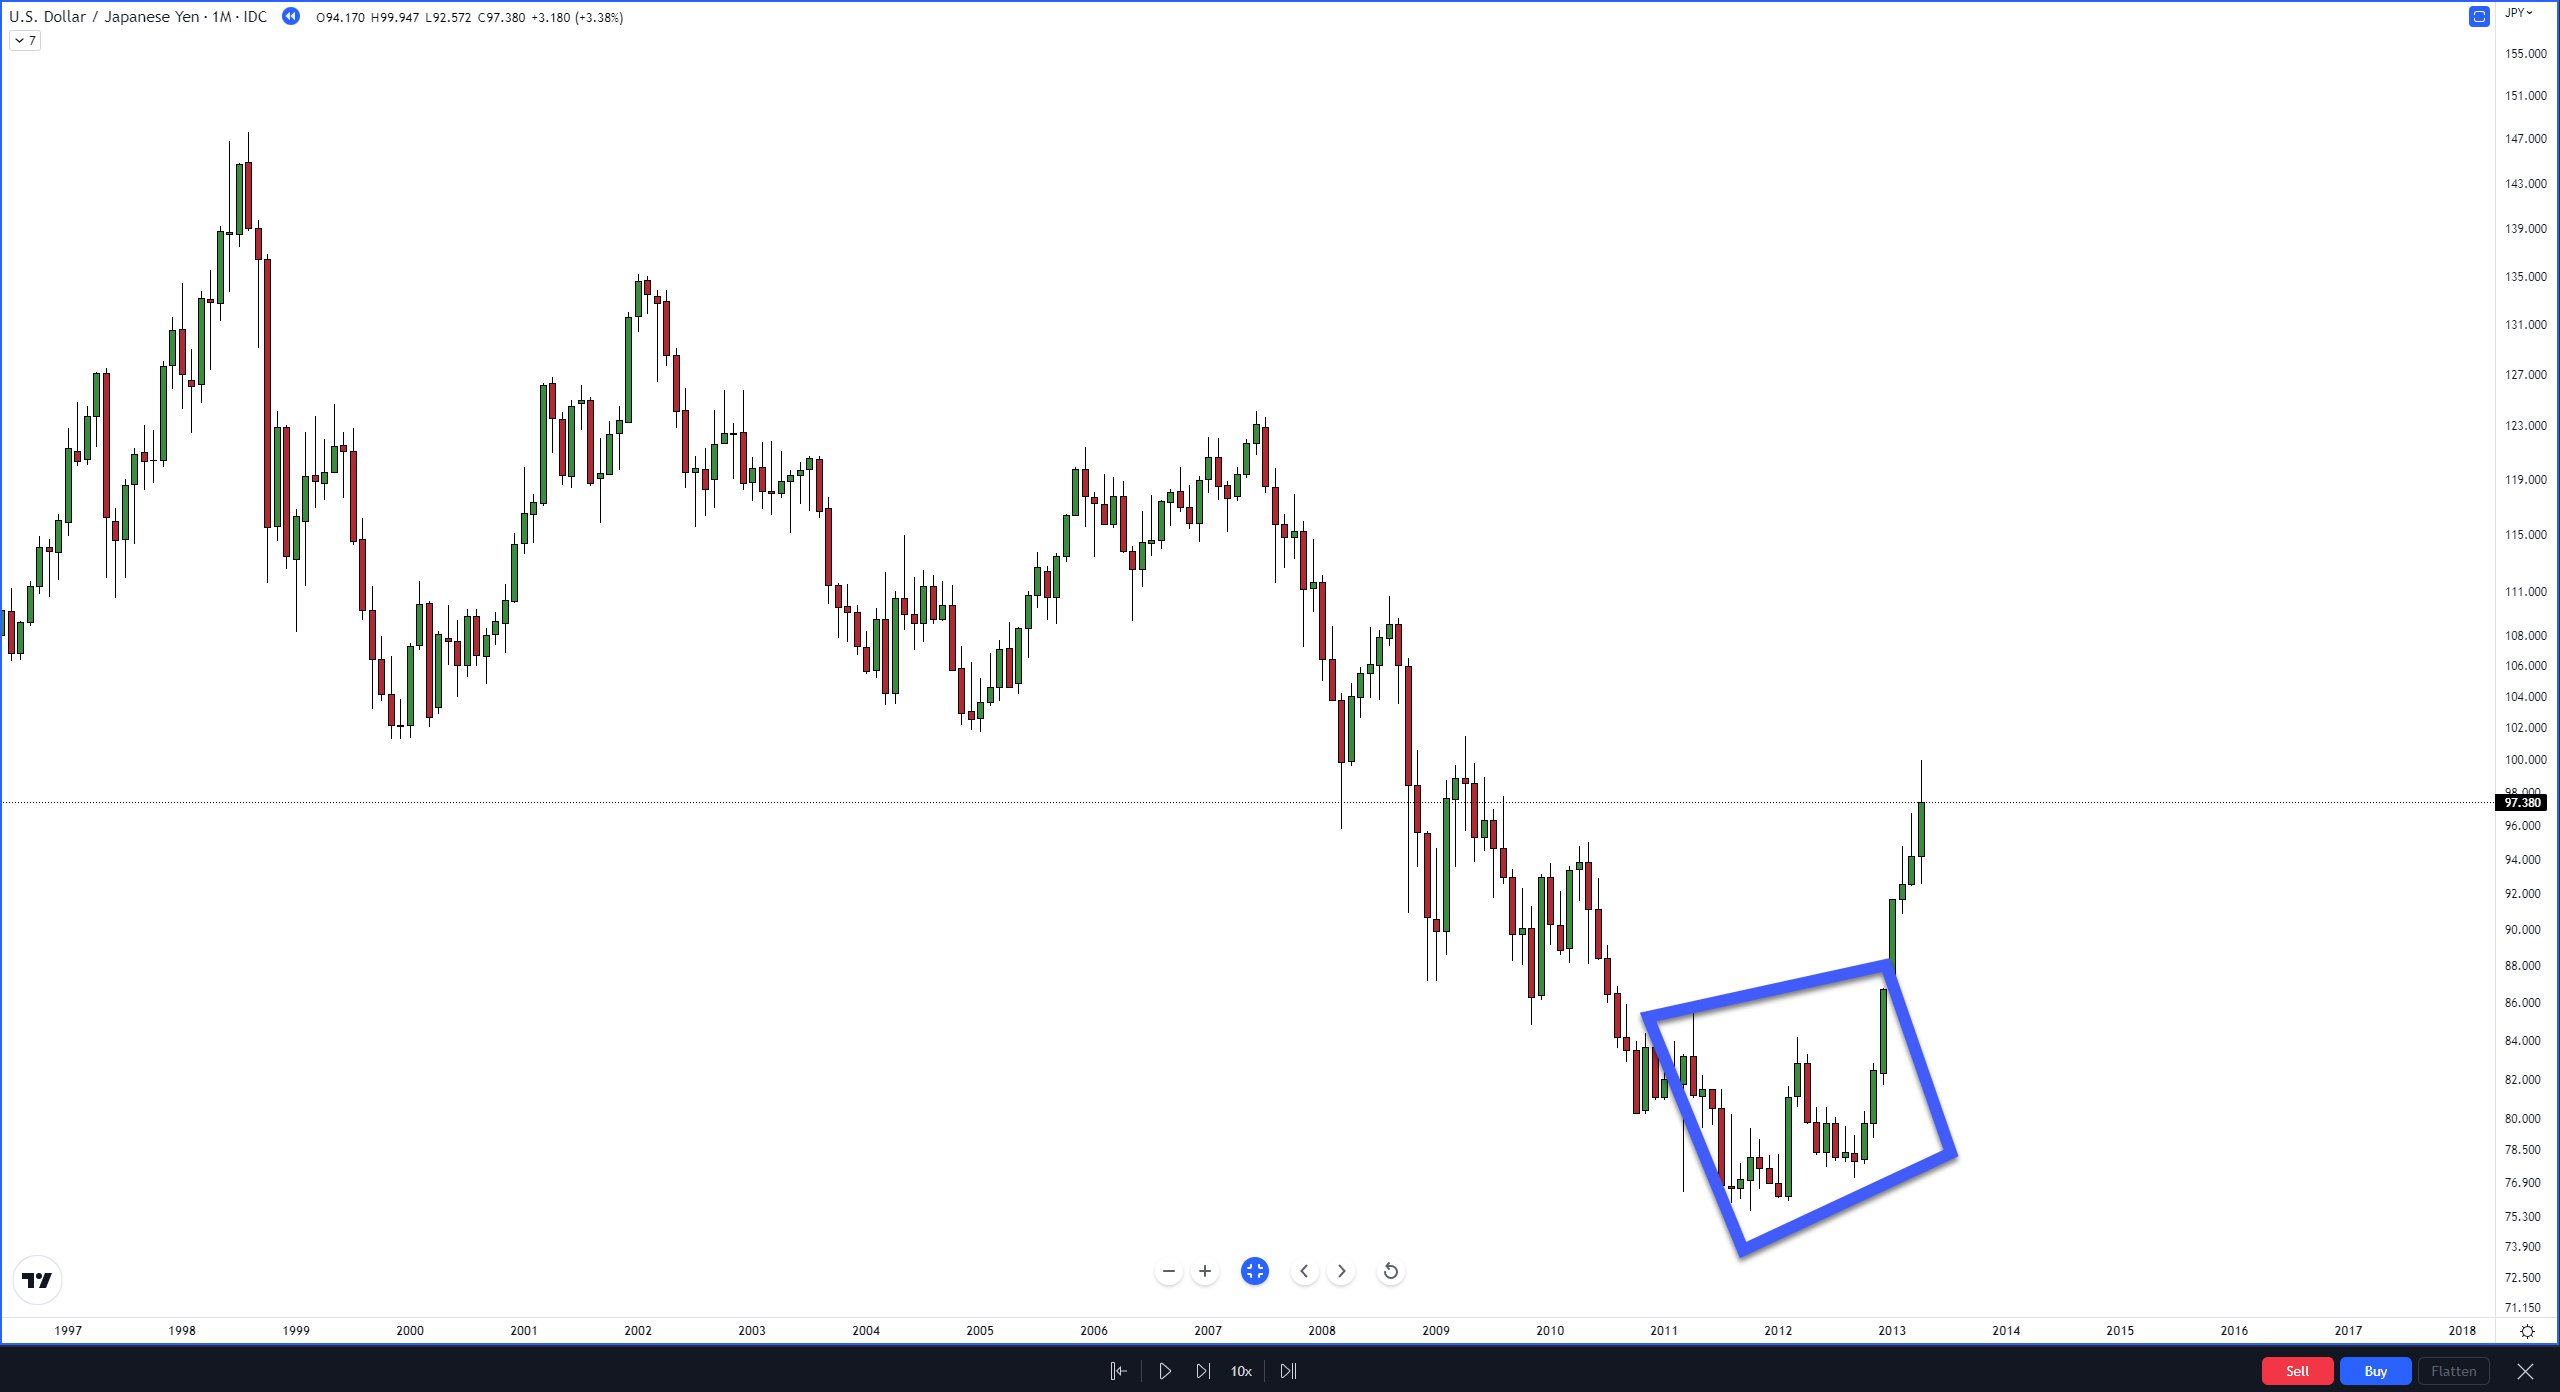
The USDJPY chart image above goes from the tail end of 1997 to April 2014. The boxed-in zone highlights two similar (not exact) price movements.
Then, we copy the prior price action, displayed as black hash marks:
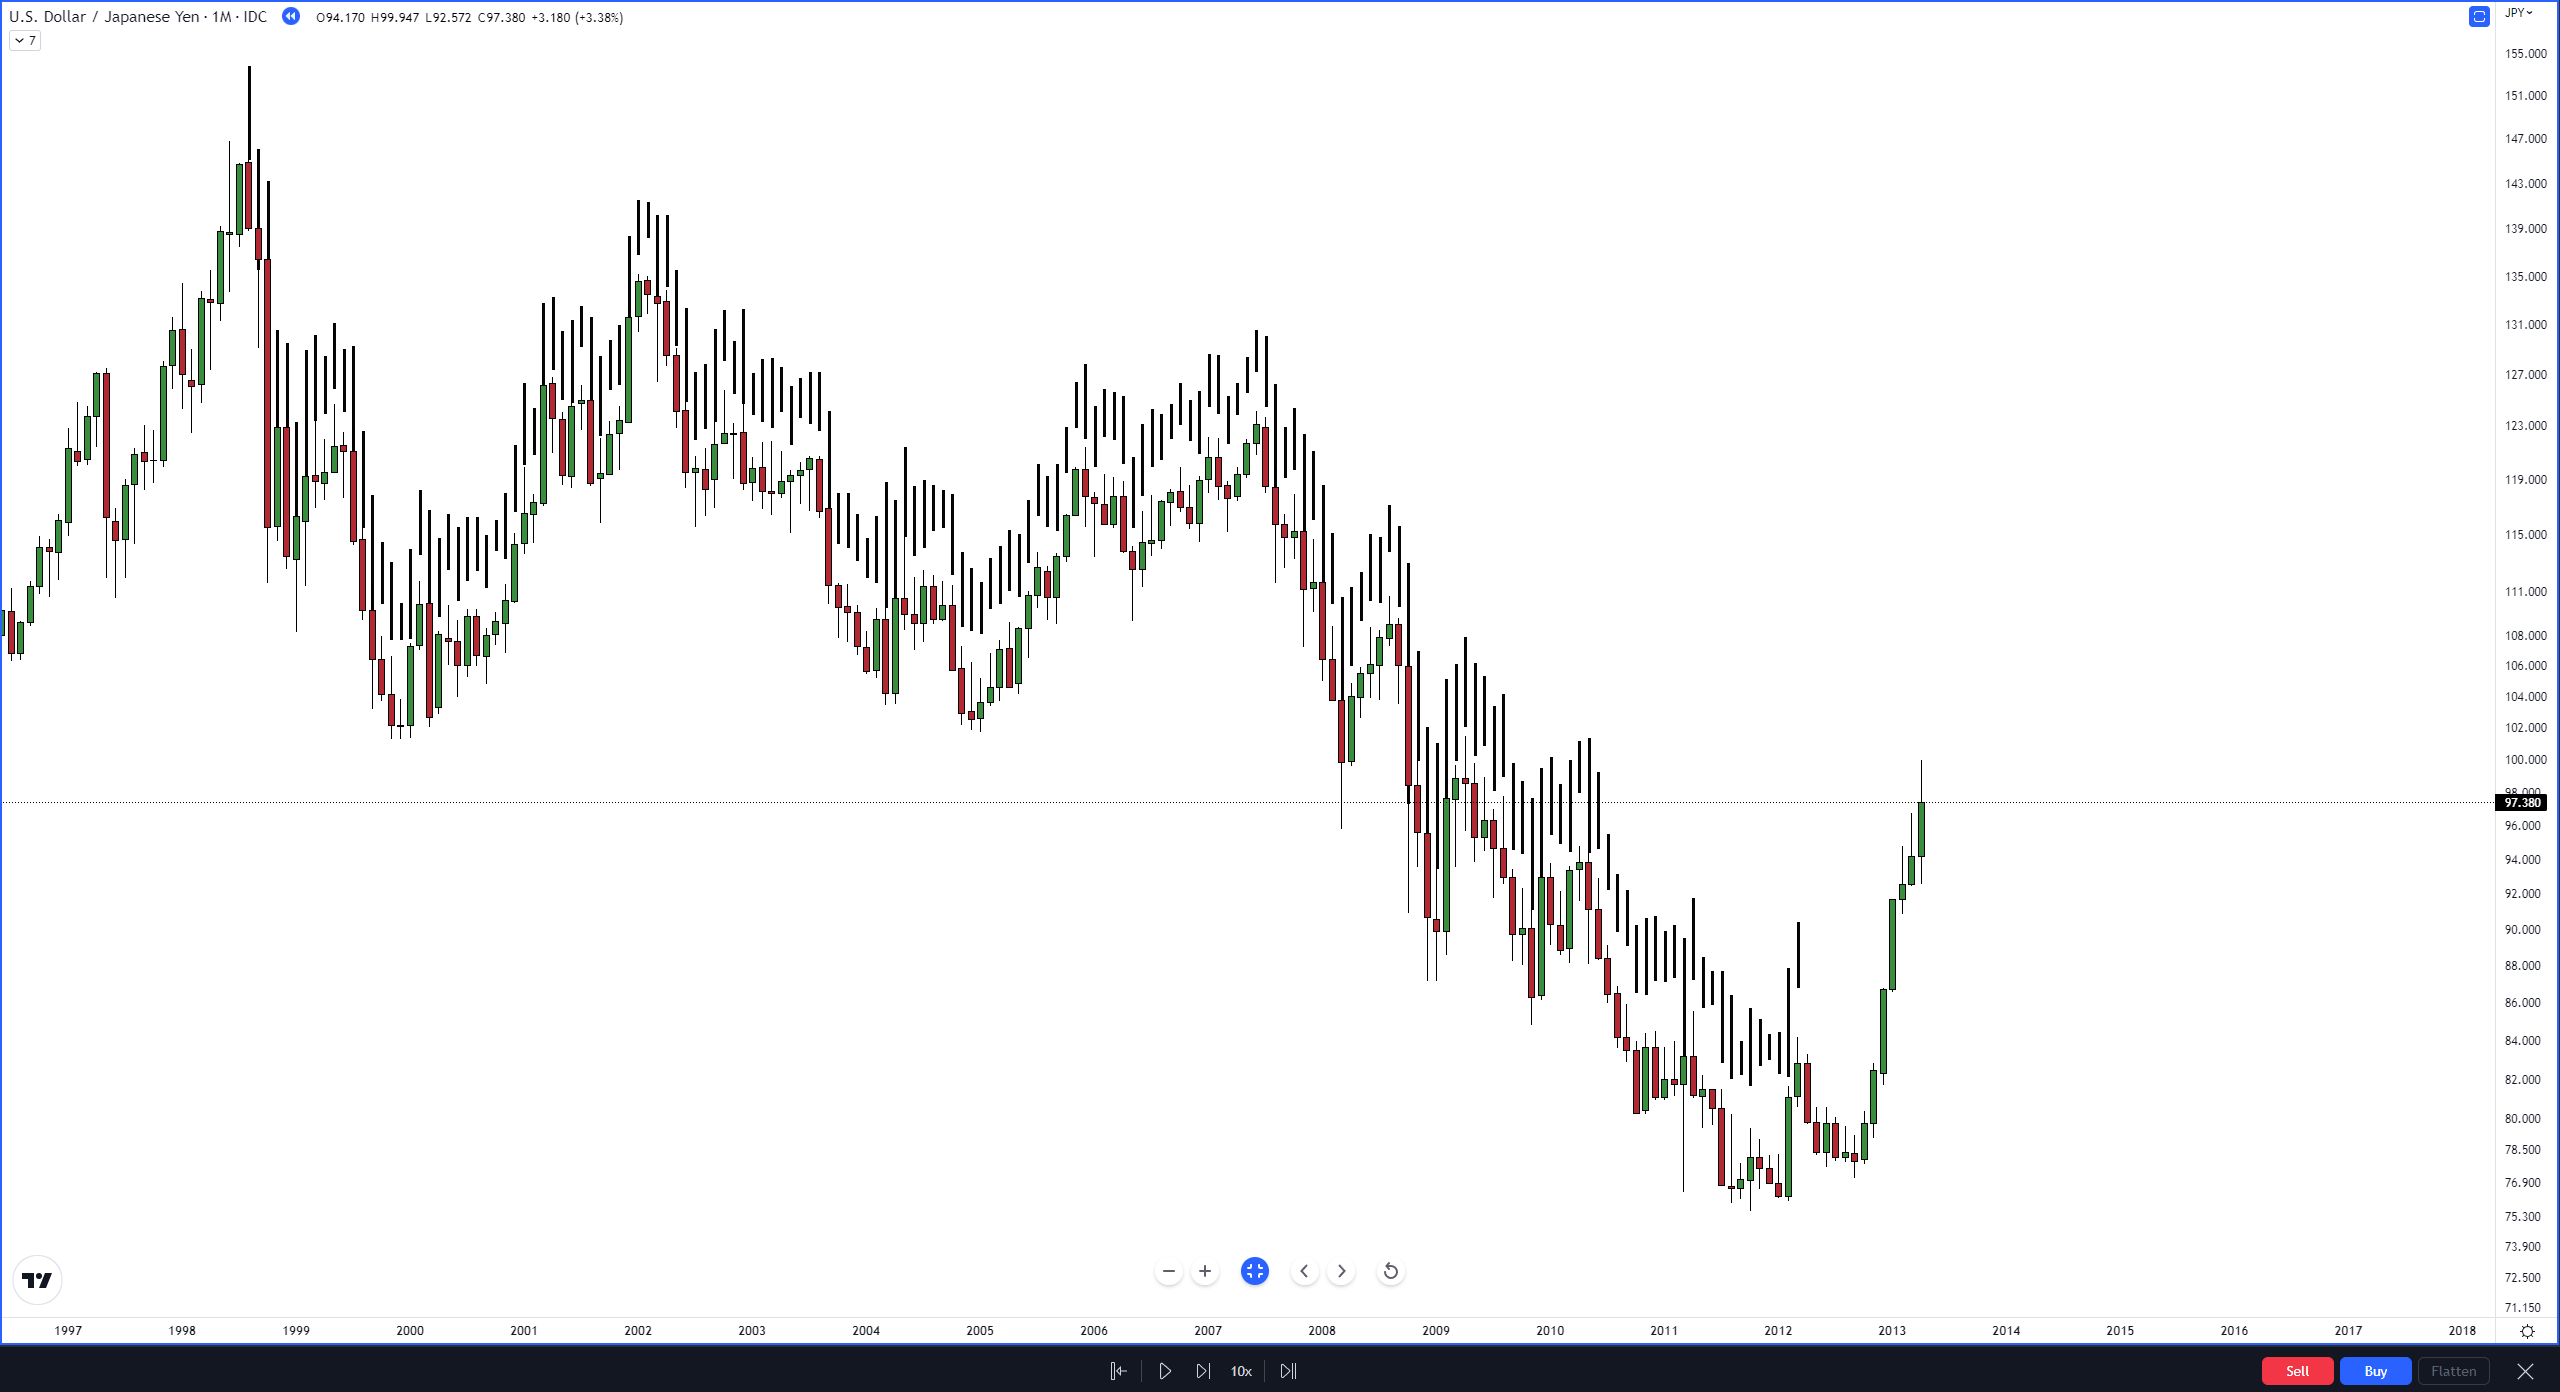
Then we ‘flip’ the hash marks, like turning a page in a book so that it’s almost like a mirror. 📖
The Foldback Theory tells us that we should expect to see the same swing structure repeat in the future.
I drew a combination of major and minor swings on both sides.
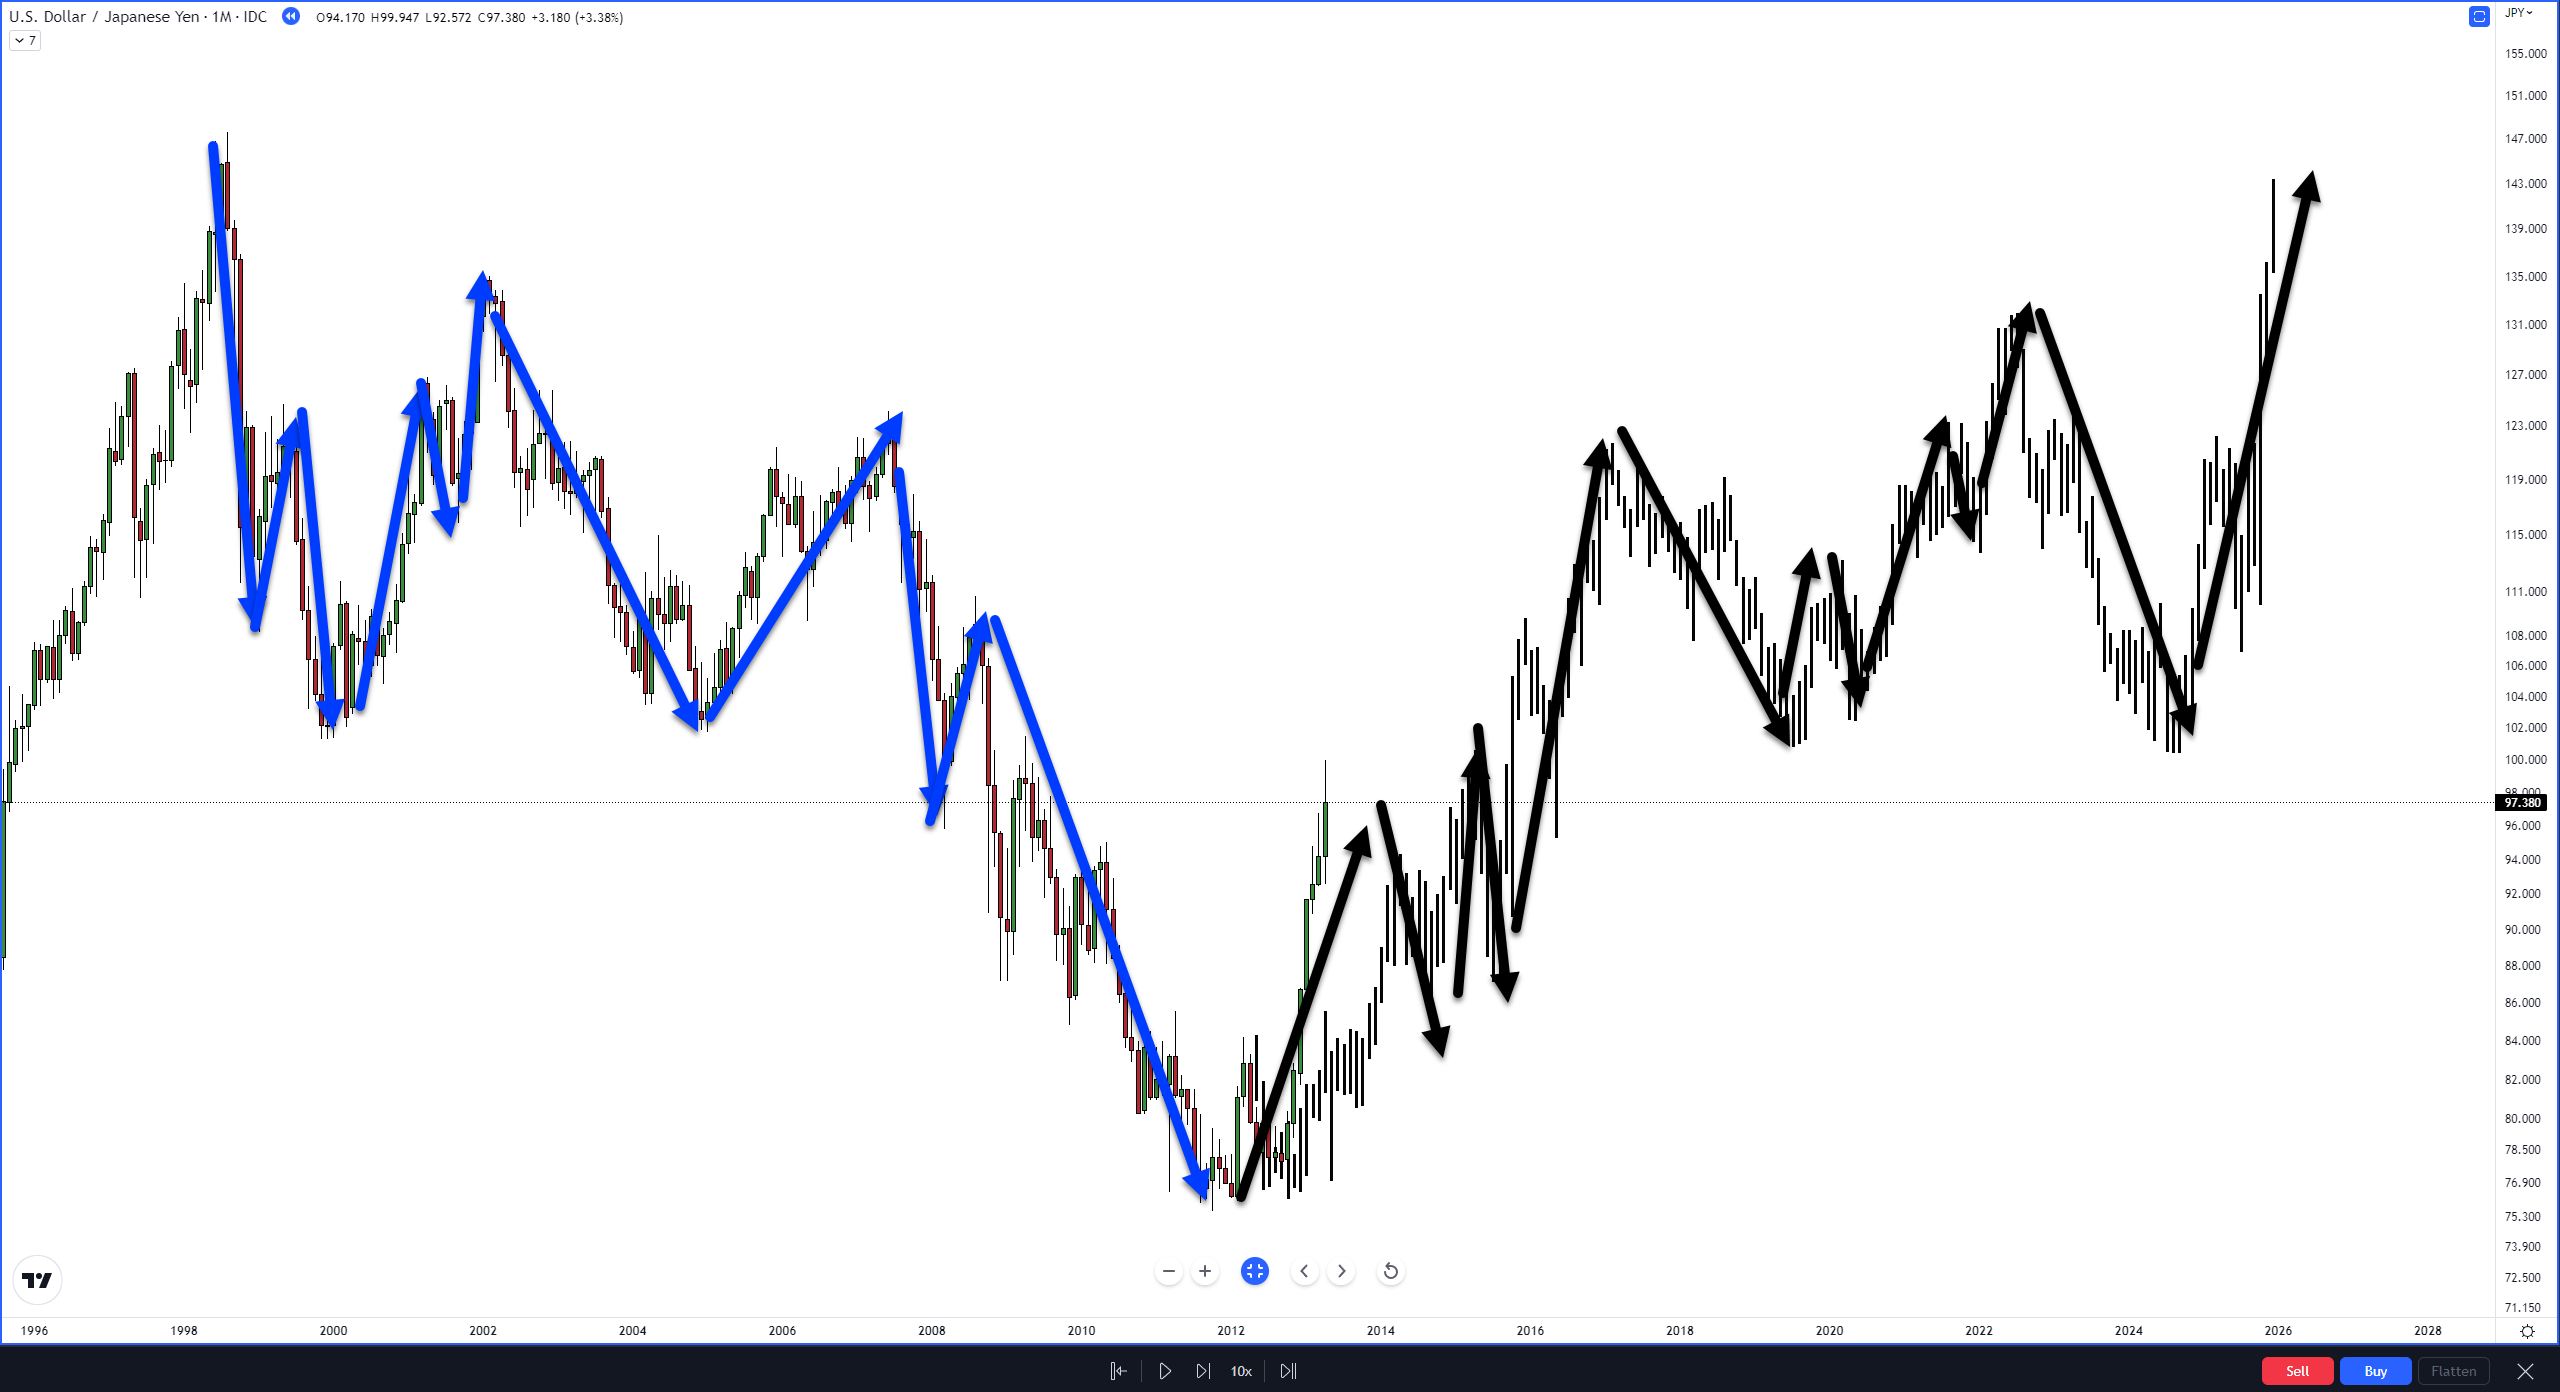
Now, let’s populate the chart and see what happened:
Did the same swing structure repeat? That’s up to everyone to decide on their own.
Inevitably, someone will ask a question such as, “wait, what about the minor swings that go up, but then the future price swing moved down?” That’s a Mirrored Foldback – still the same swing structure, just the inverse.
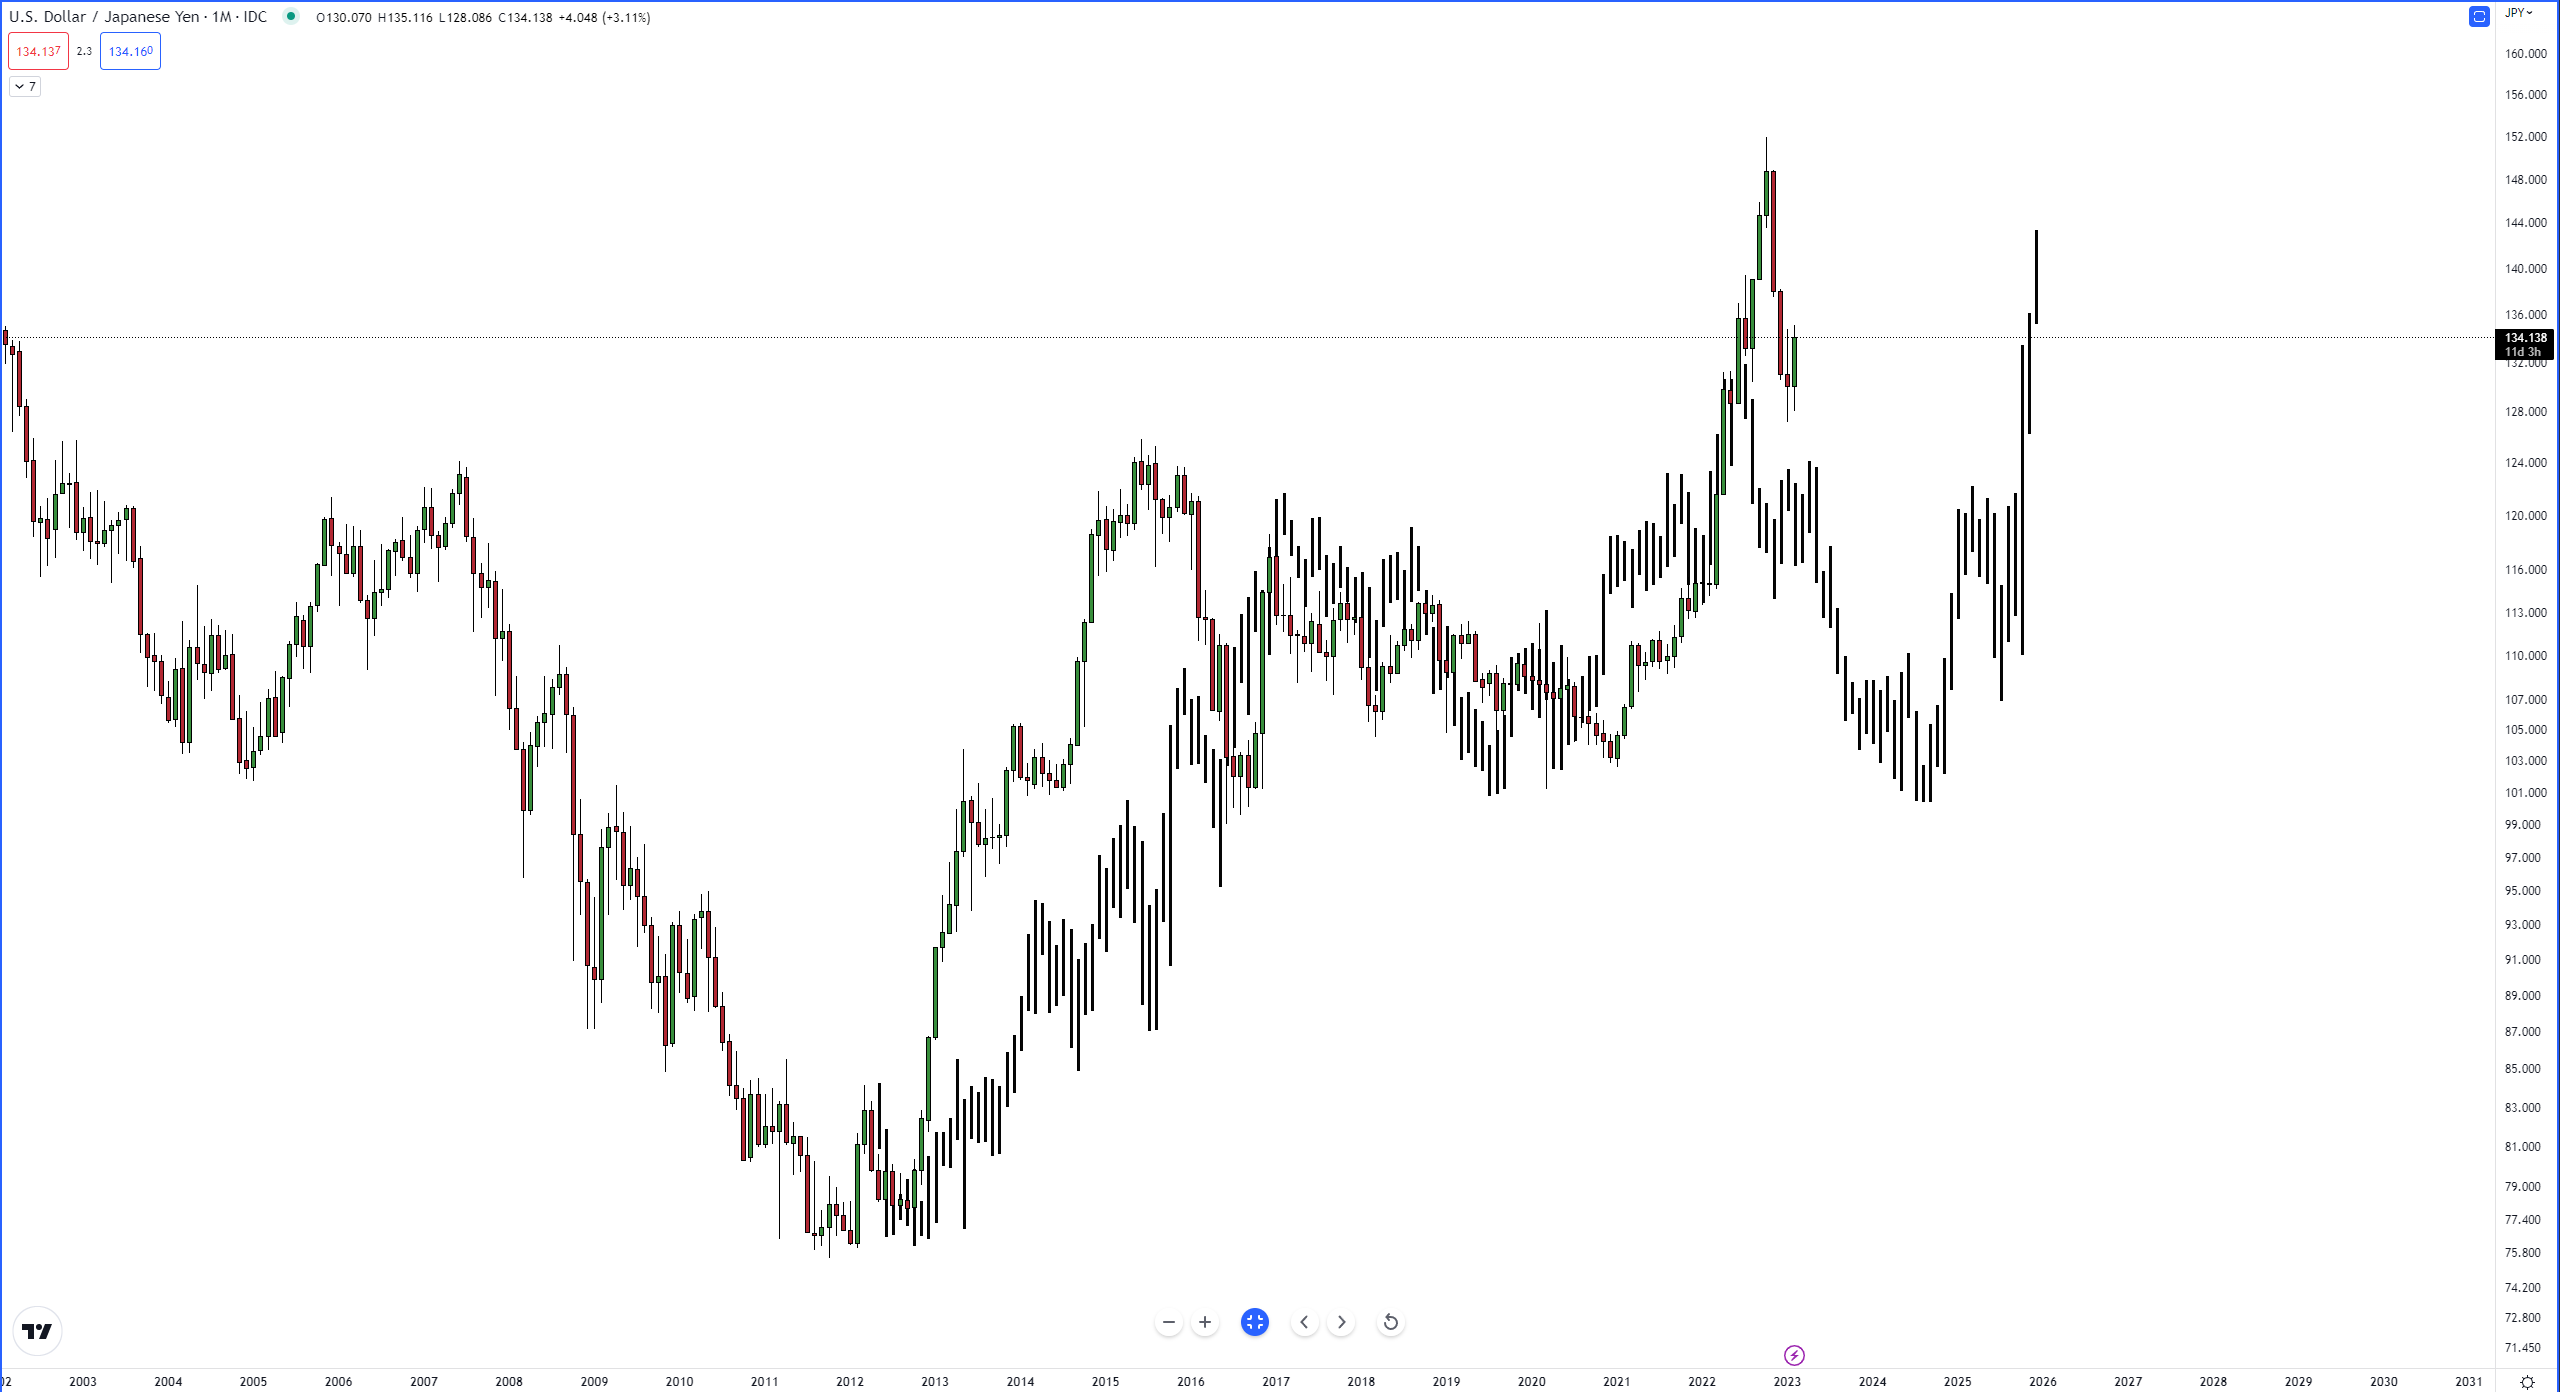
Now let’s apply this to XRP’s chart.
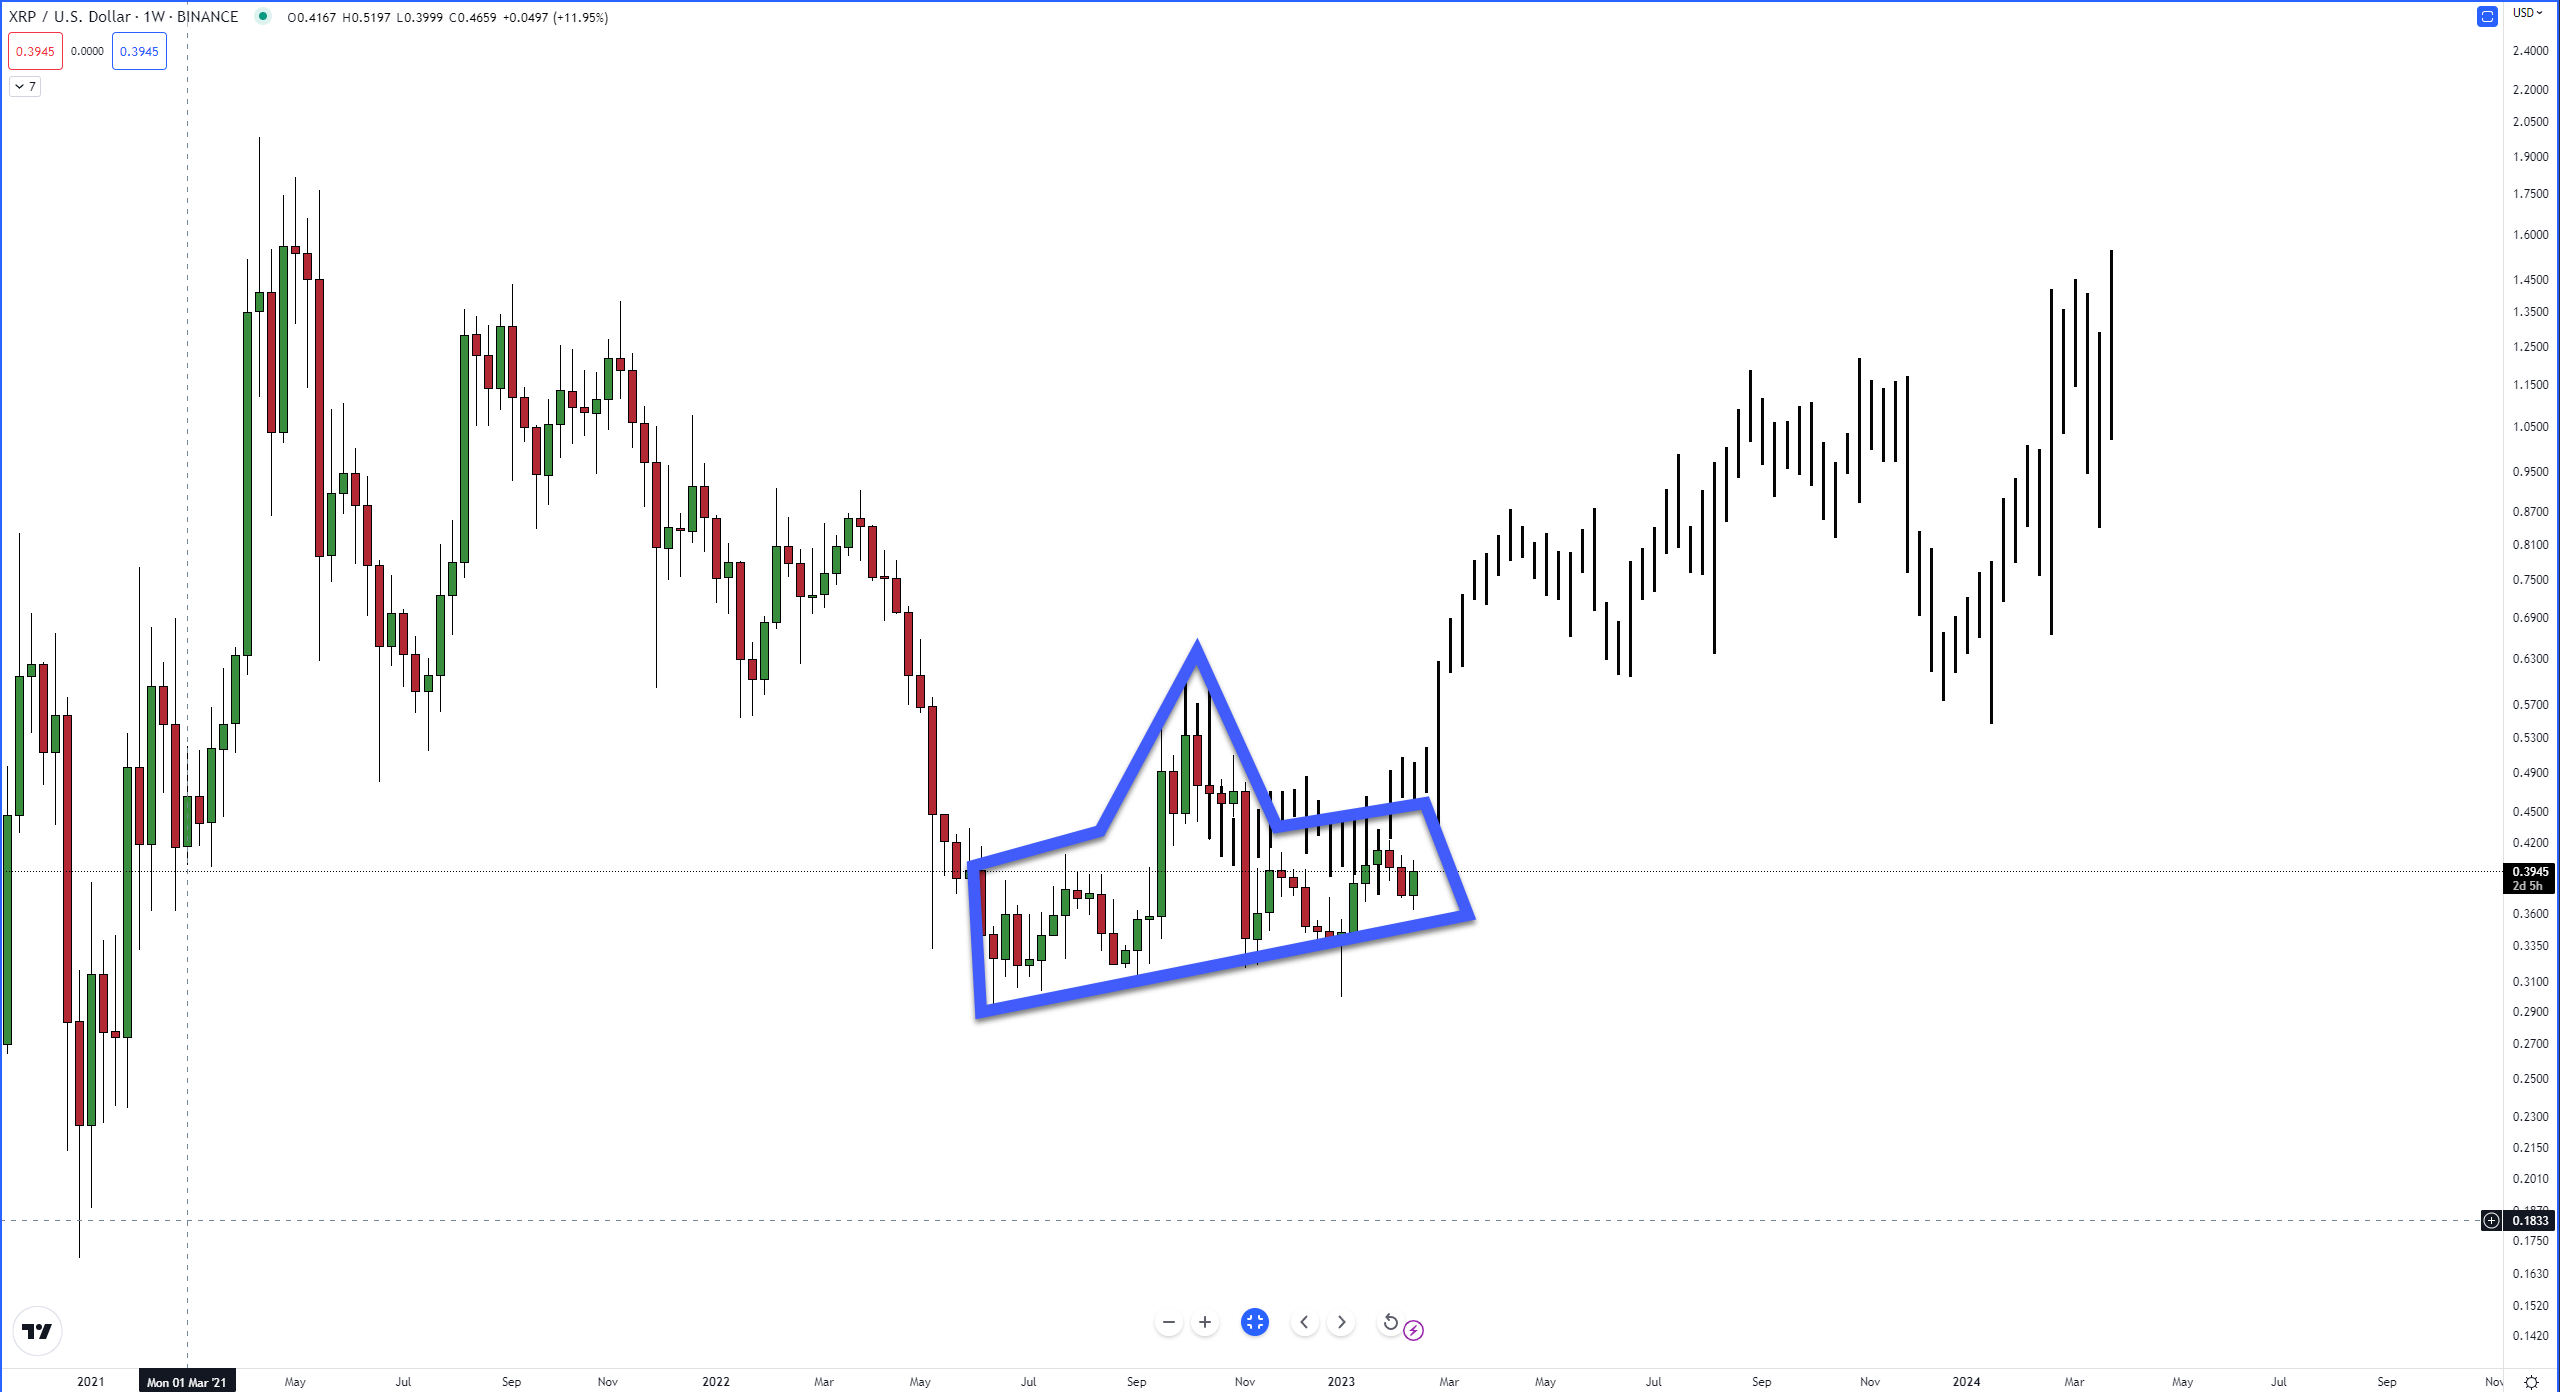
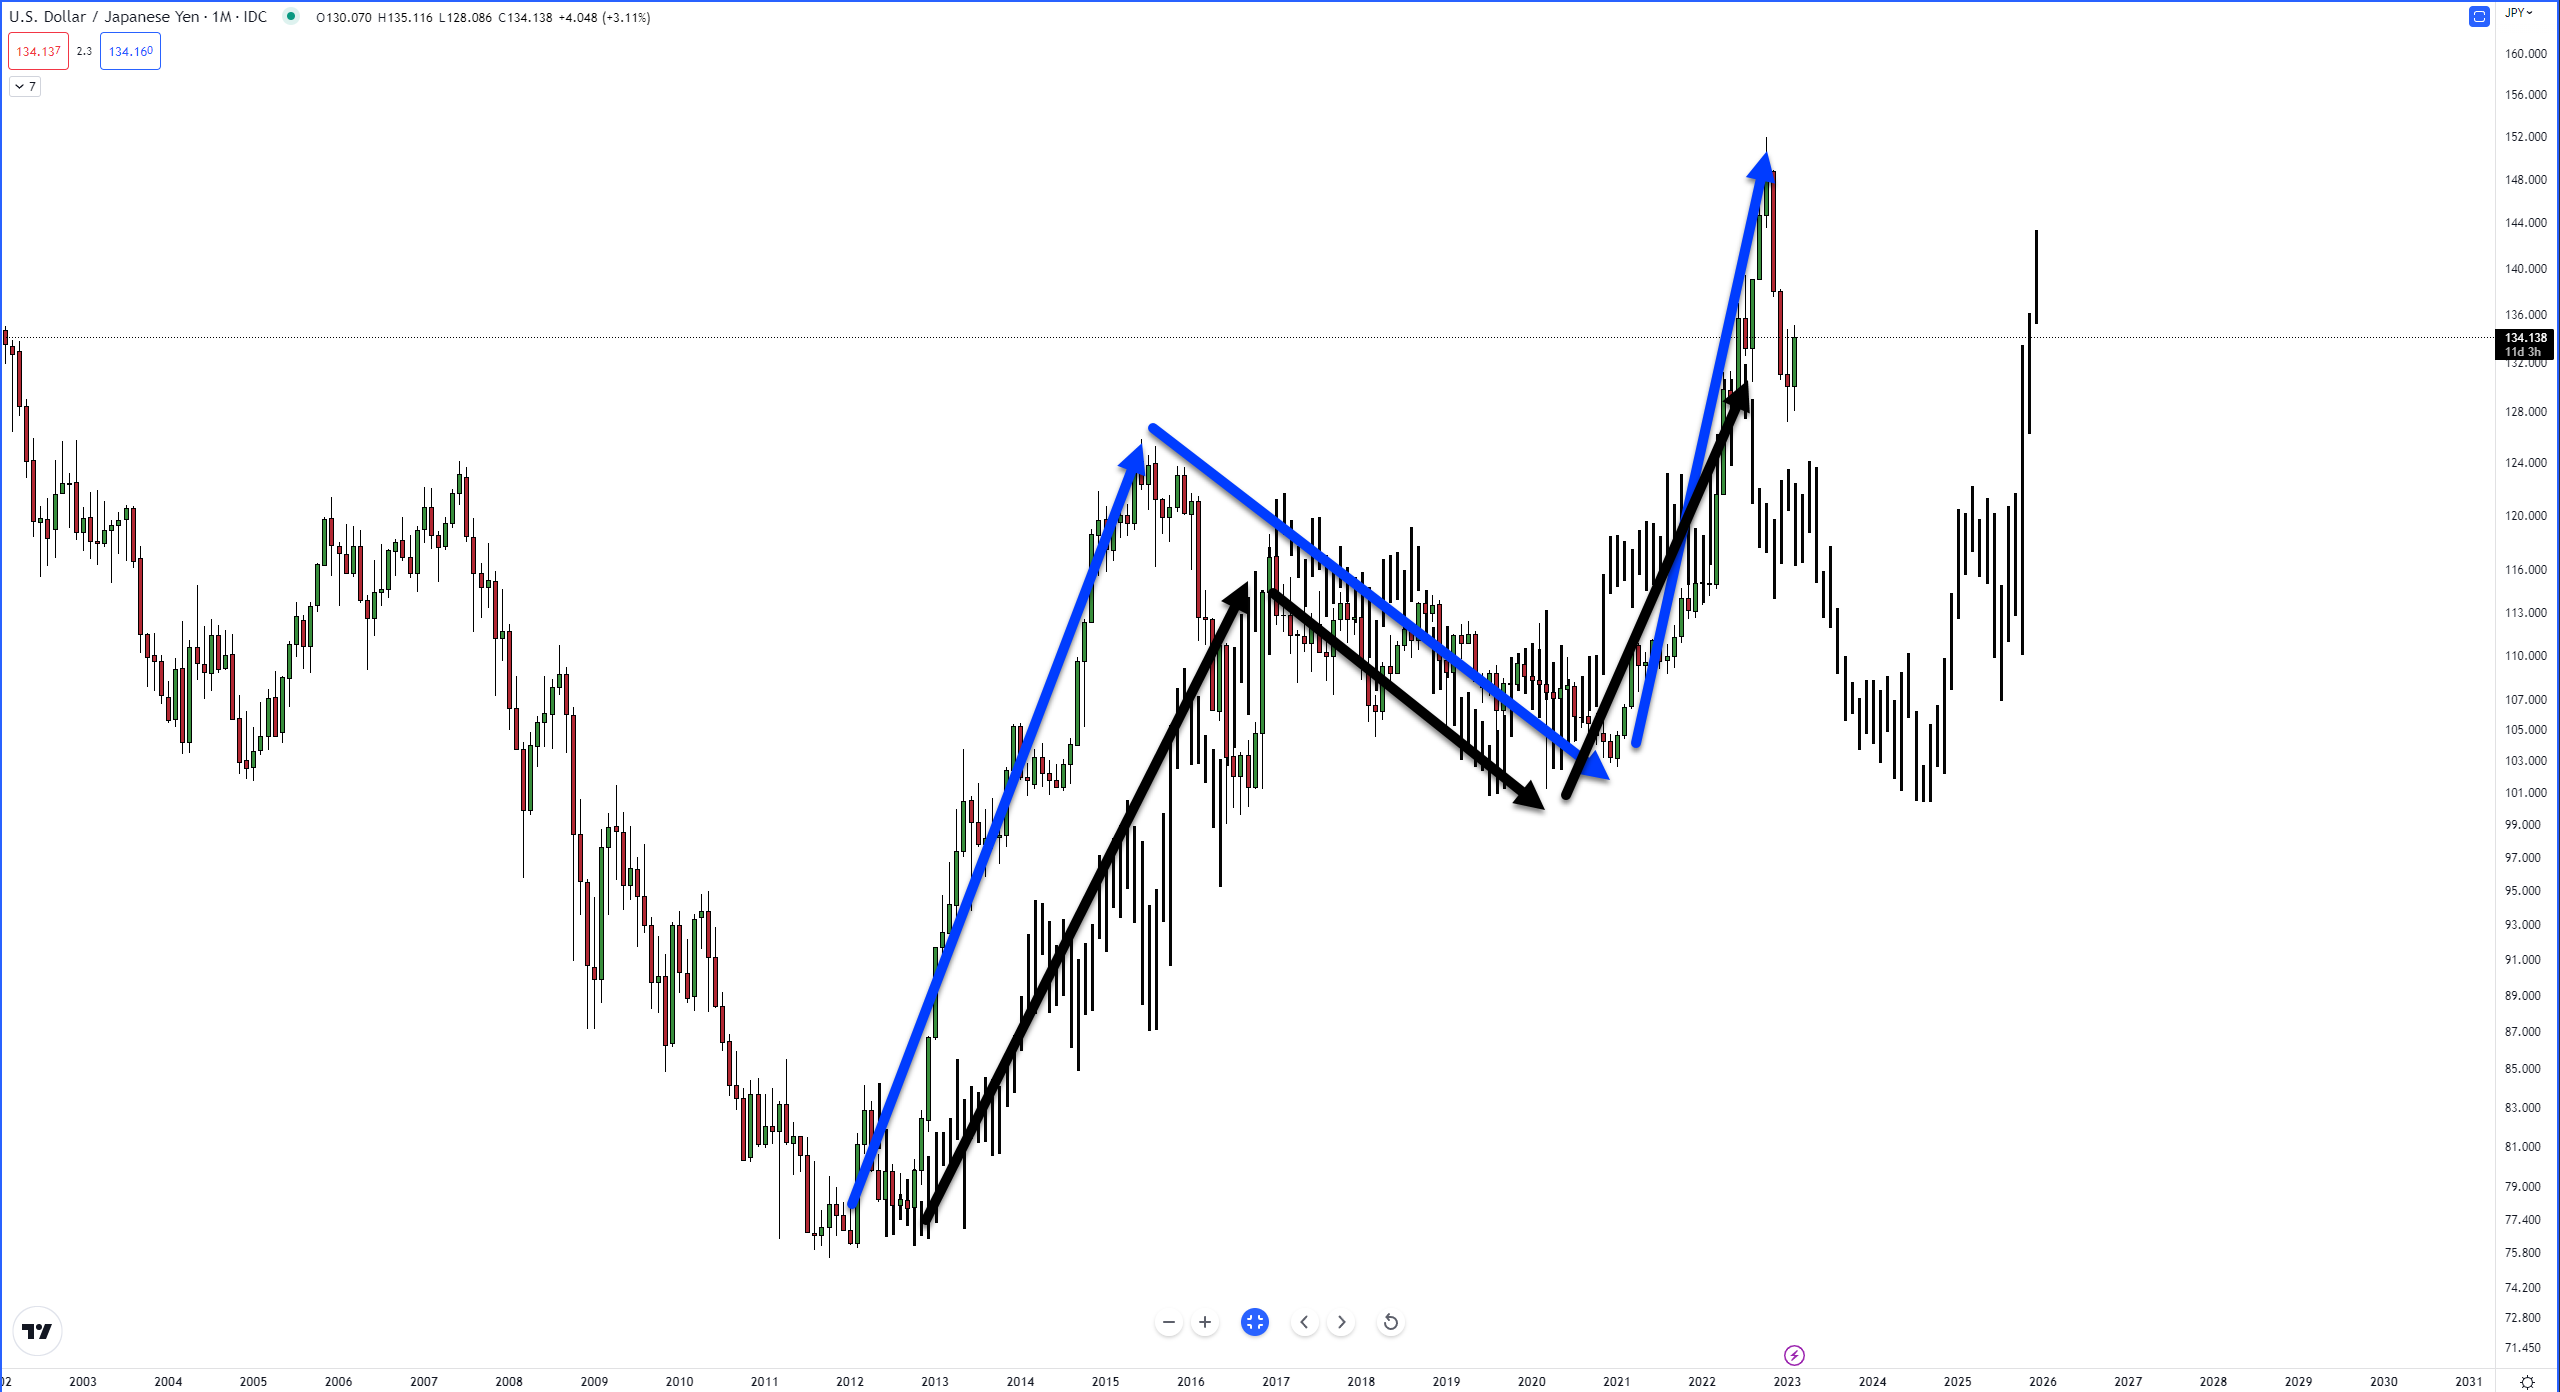
As with the USDJPY example above, the blue zone highlights two similar price movements.
According to the Folback Theory, a fairly strong trending swing is next – higher or lower, though that’s the big question. 🤔
On XRP’s daily chart, price action is close to completing one of the most sought-after bullish confirmation setups within the Ichimoku system: the Ideal Bullish Ichimoku Breakout.
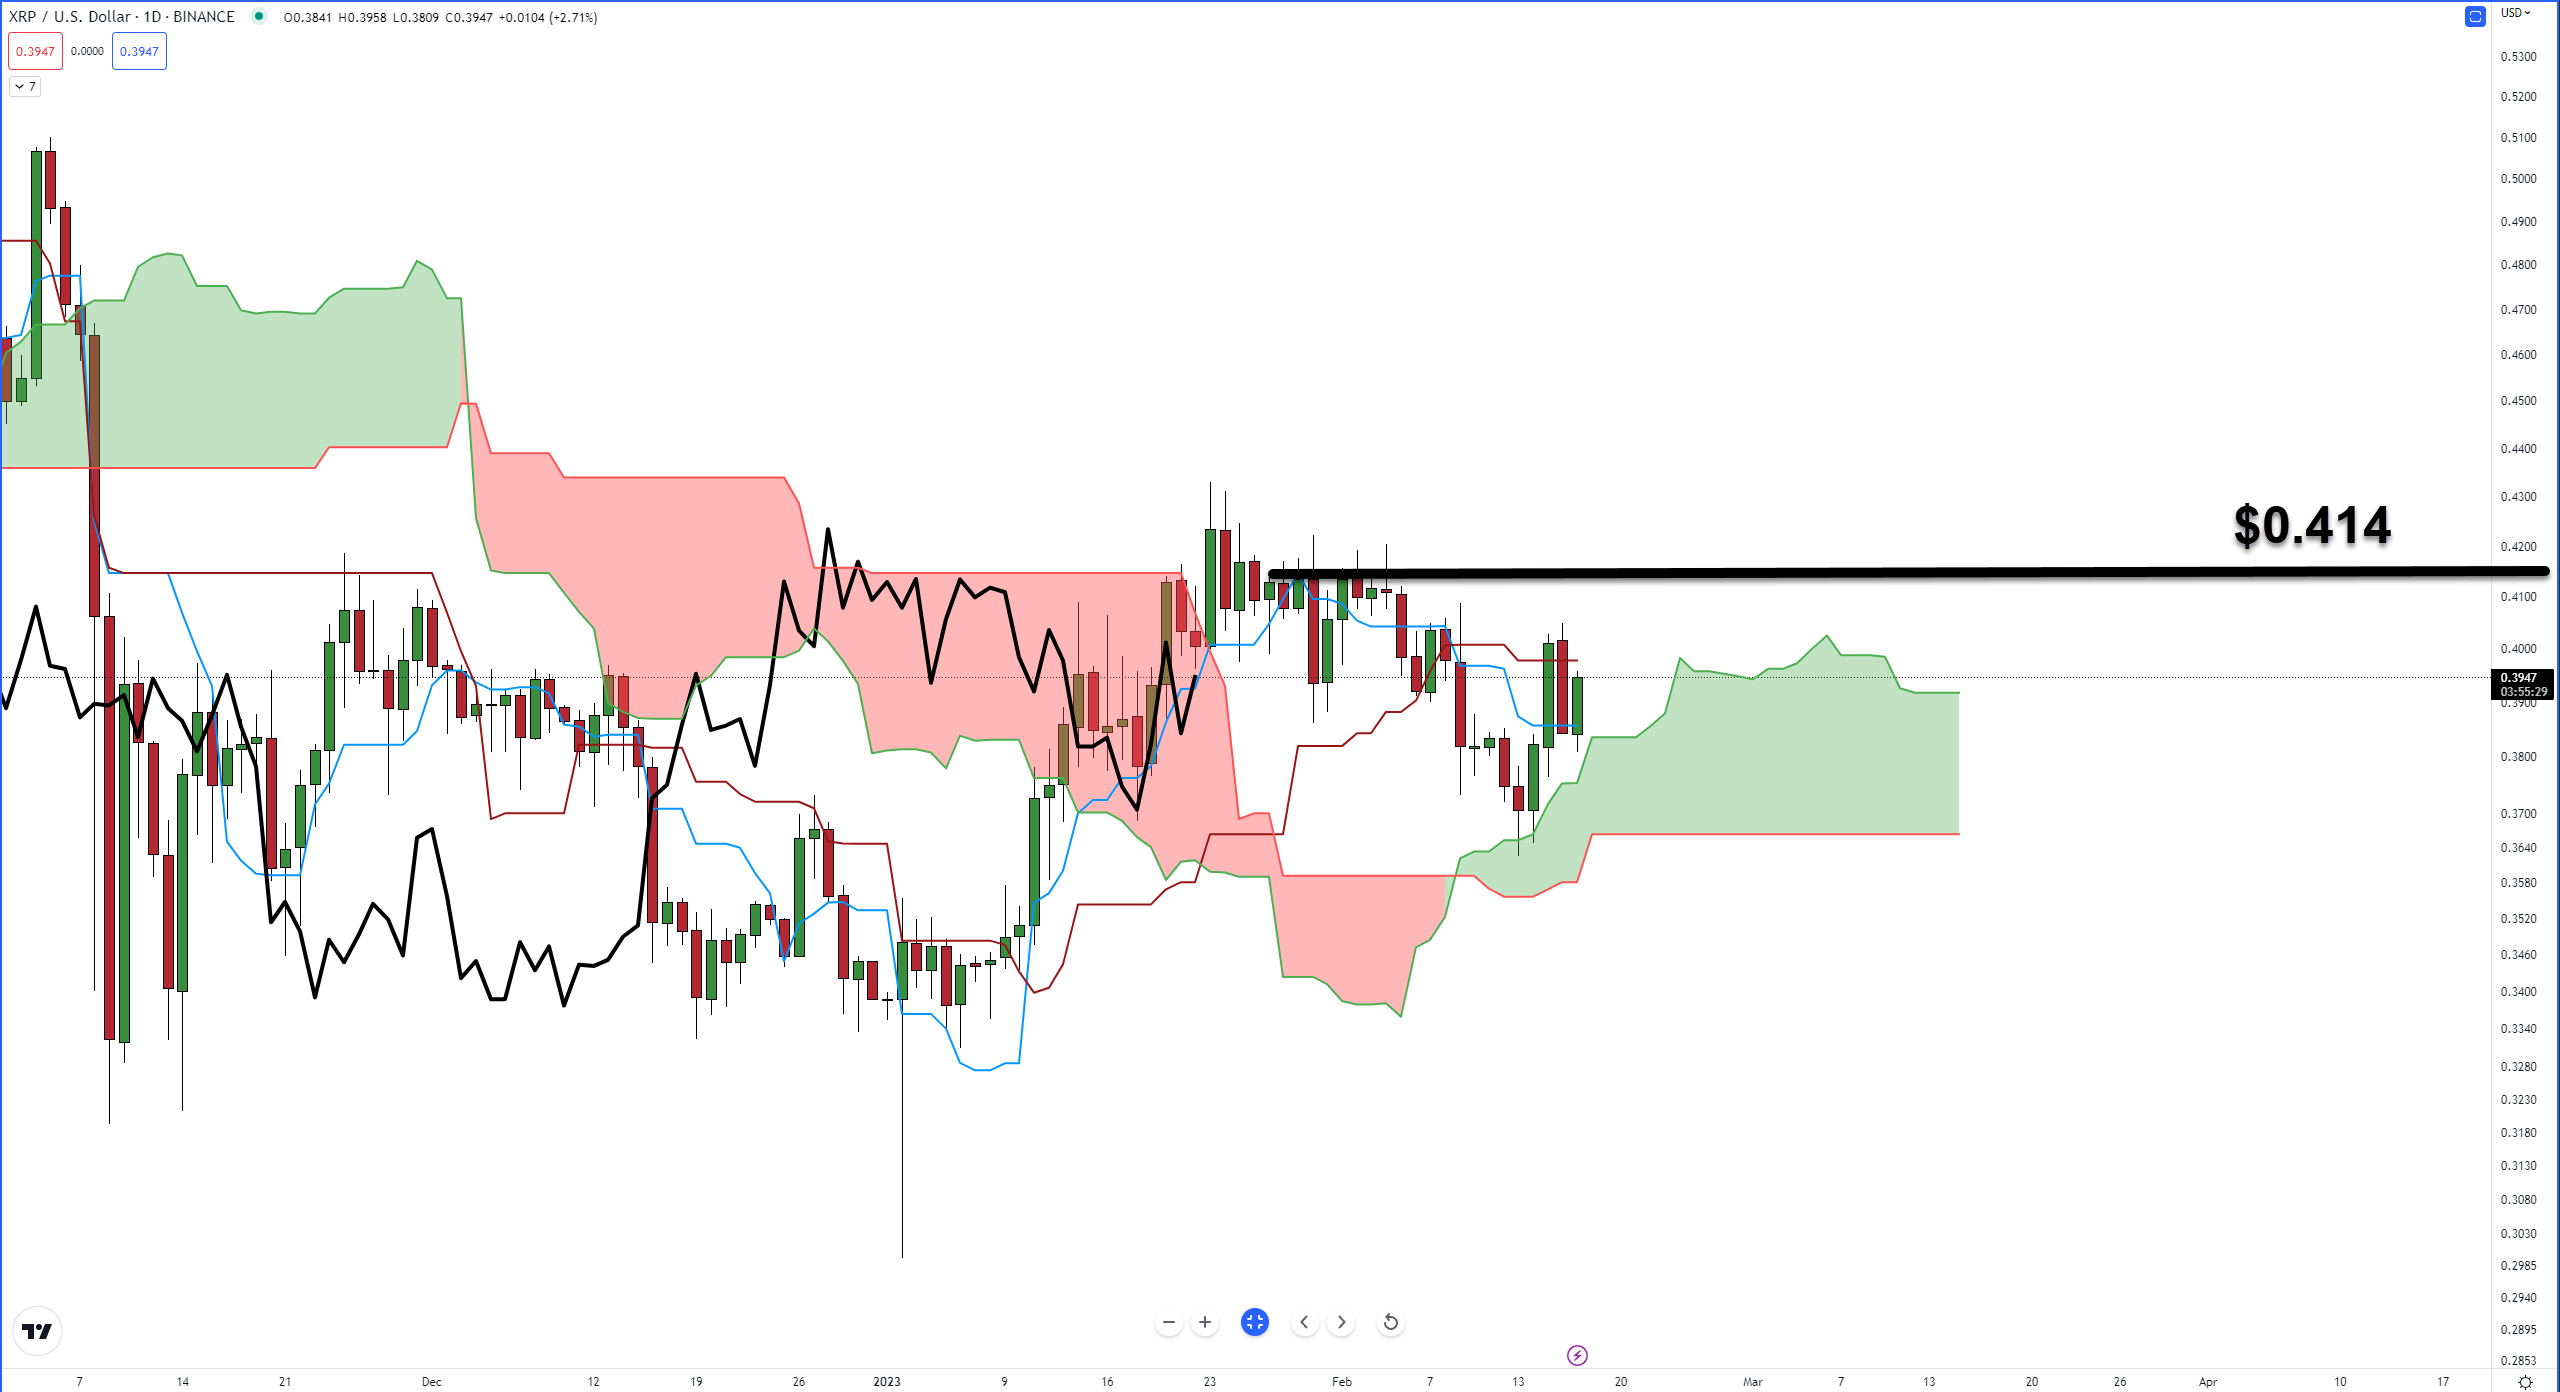
It must meet these criteria:
- Price above the Cloud, Tenkan-Sen, and Kijun-Sen.
- Tenkan-Sen above the Kijun-Sen (or, Kijun-Sen is flat with the Tenkan-Sen pointing up).
- Future Senkou Span A above Future Senkou Span B.
- Chikou Span above the bodies of the candlesticks and in open space.
Without going into a ton more detail, the threshold that XRP would need to hit for all of the conditions above to be true is the daily chart closing at or above these levels on these dates:
February 18-19: $0.424
February 20- 21: $0.418
February 22 – February 28: $0.414
TL;DR
Gann Analysis suggests that a prolonged major swing is likely to begin soon. The critical price level XRP needs to stay at or above between now and the end of February is $0.42. 🔔
However, analysts warn that any daily close below $0.306 could trigger another massive leg south.
Resistance level(s) analysts see: $0.398, $0.43, and $0.476
Support level(s) analysts see: $0.368 and $0.36.
*our last Technically Speaking article from February 14 had the year in the title as 2021. It’s not 2021; it’s 2023.