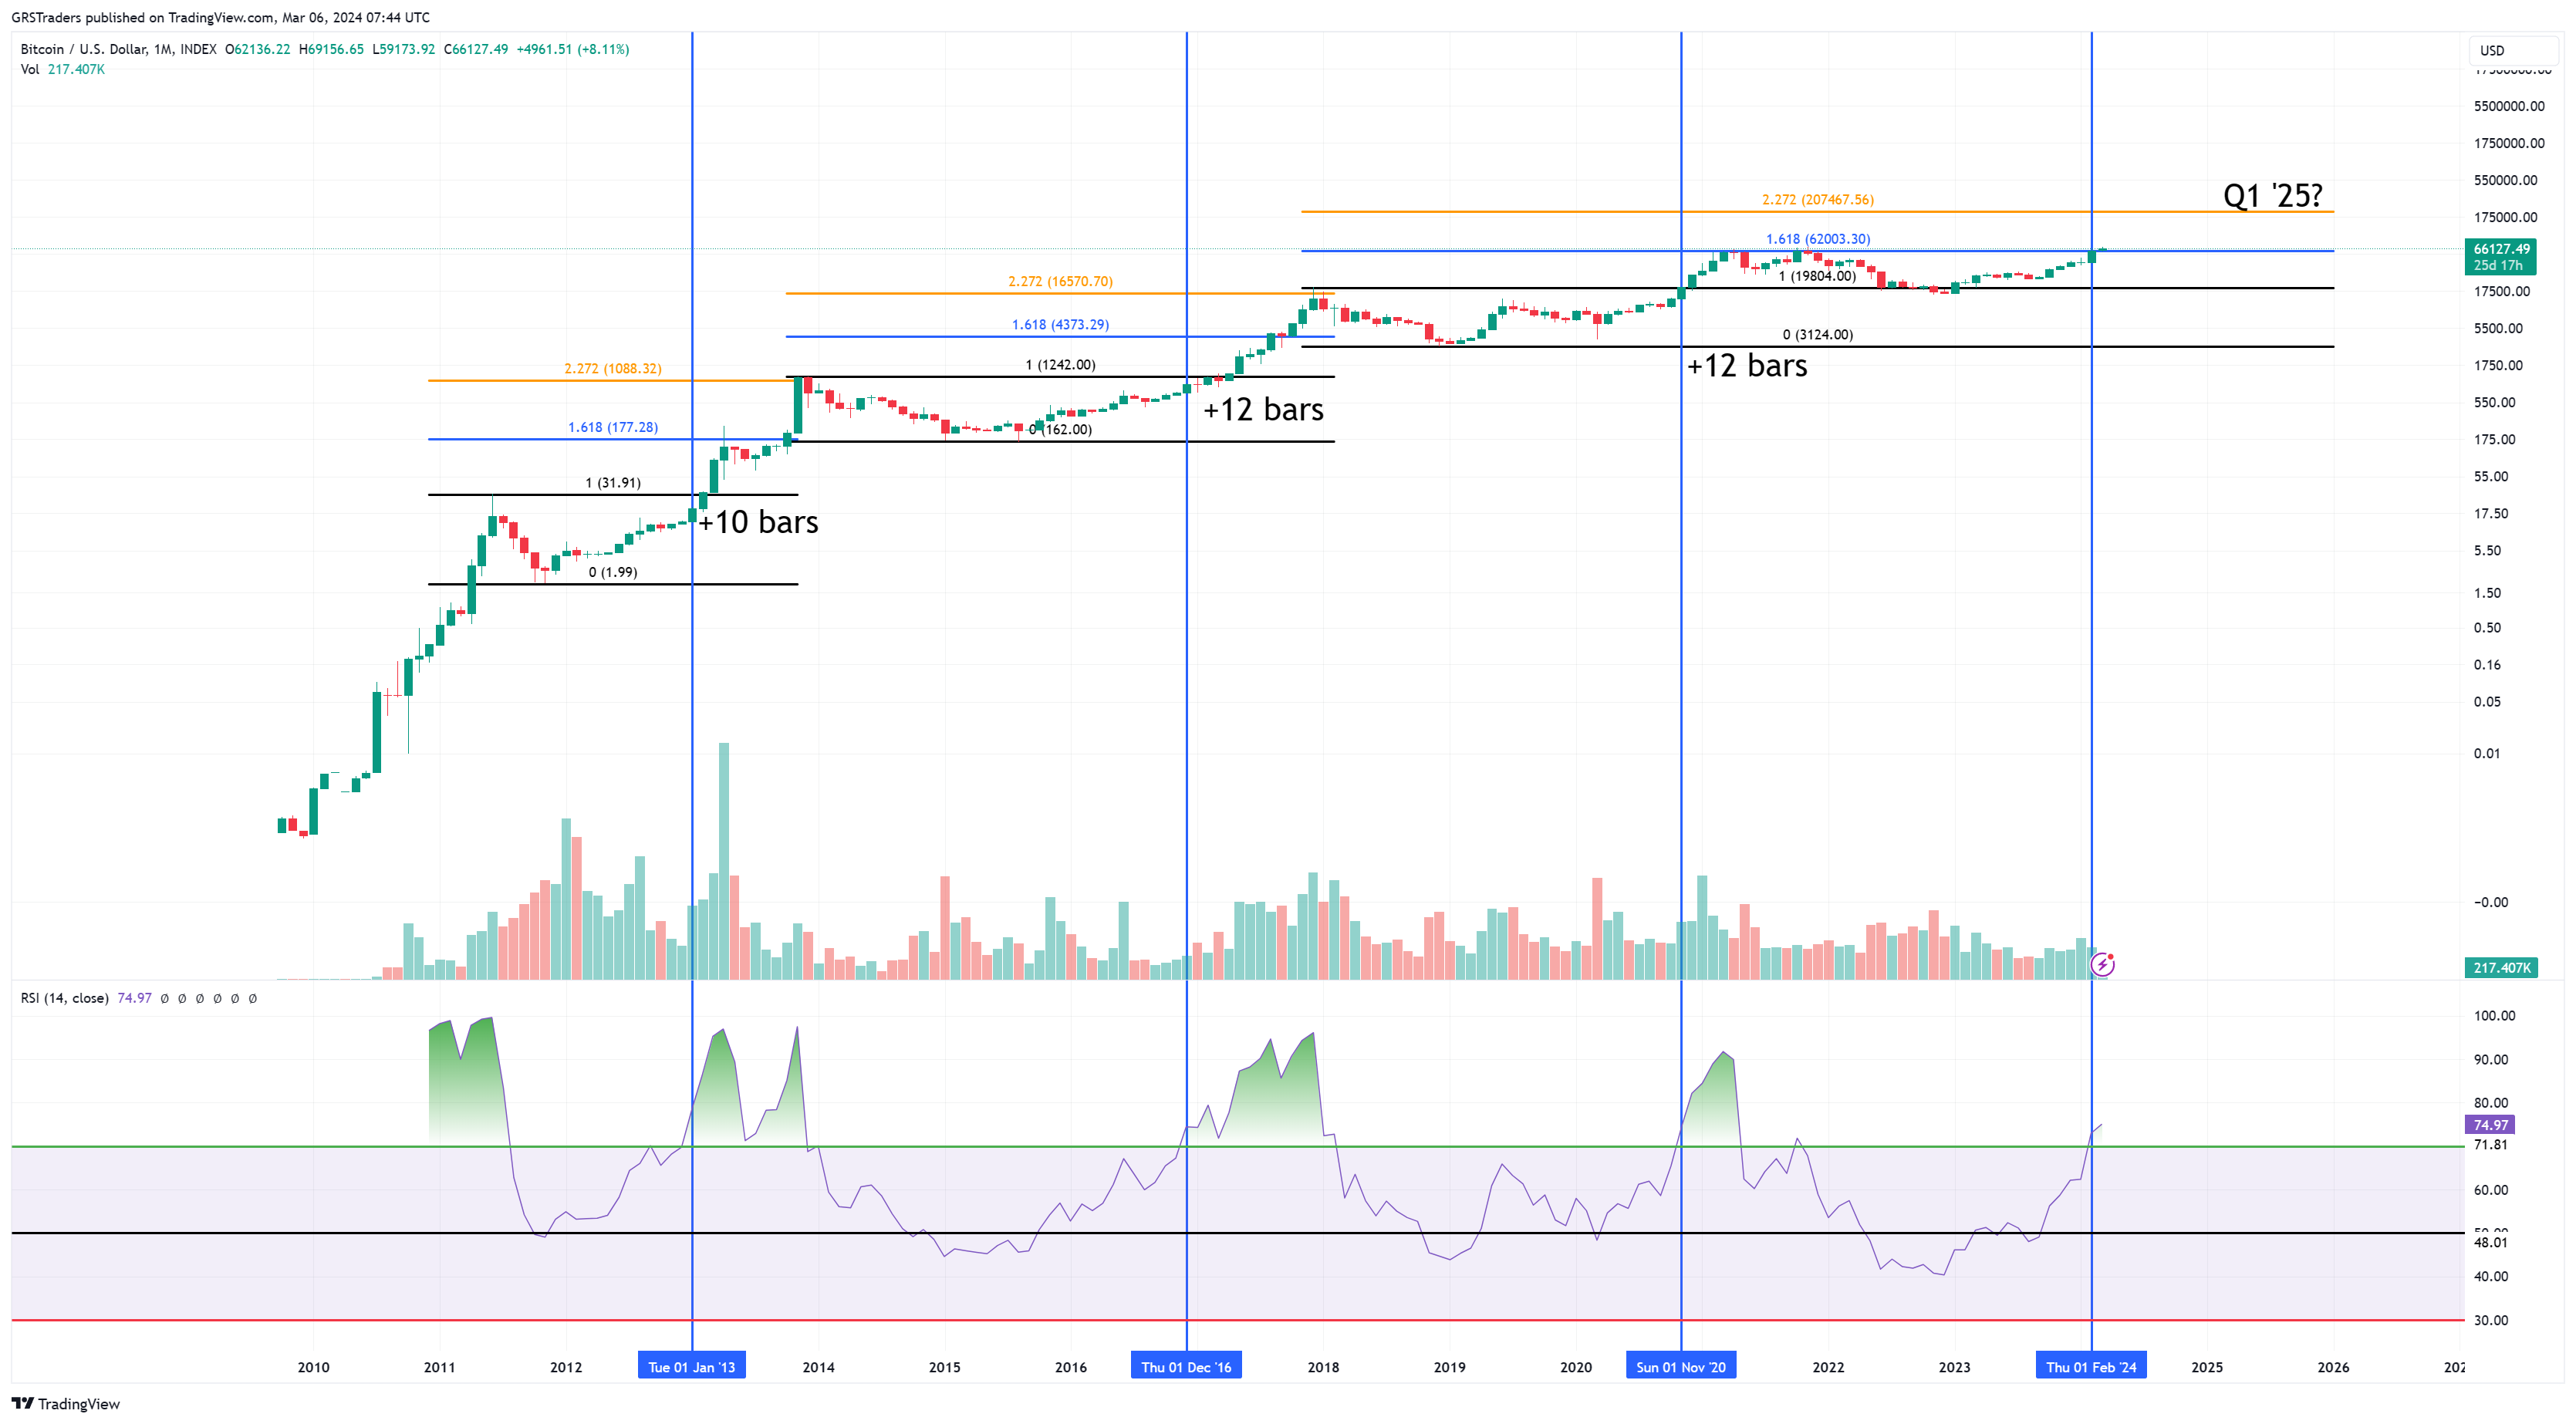
GetRichSlow shows off a beautiful logarithmic $BTC chart, hinting at $200k in Q1 2025.
His Fibonacci expansions highlight a series of projected price levels along with vertical blue bars highlighting when the RSI crosses 70.
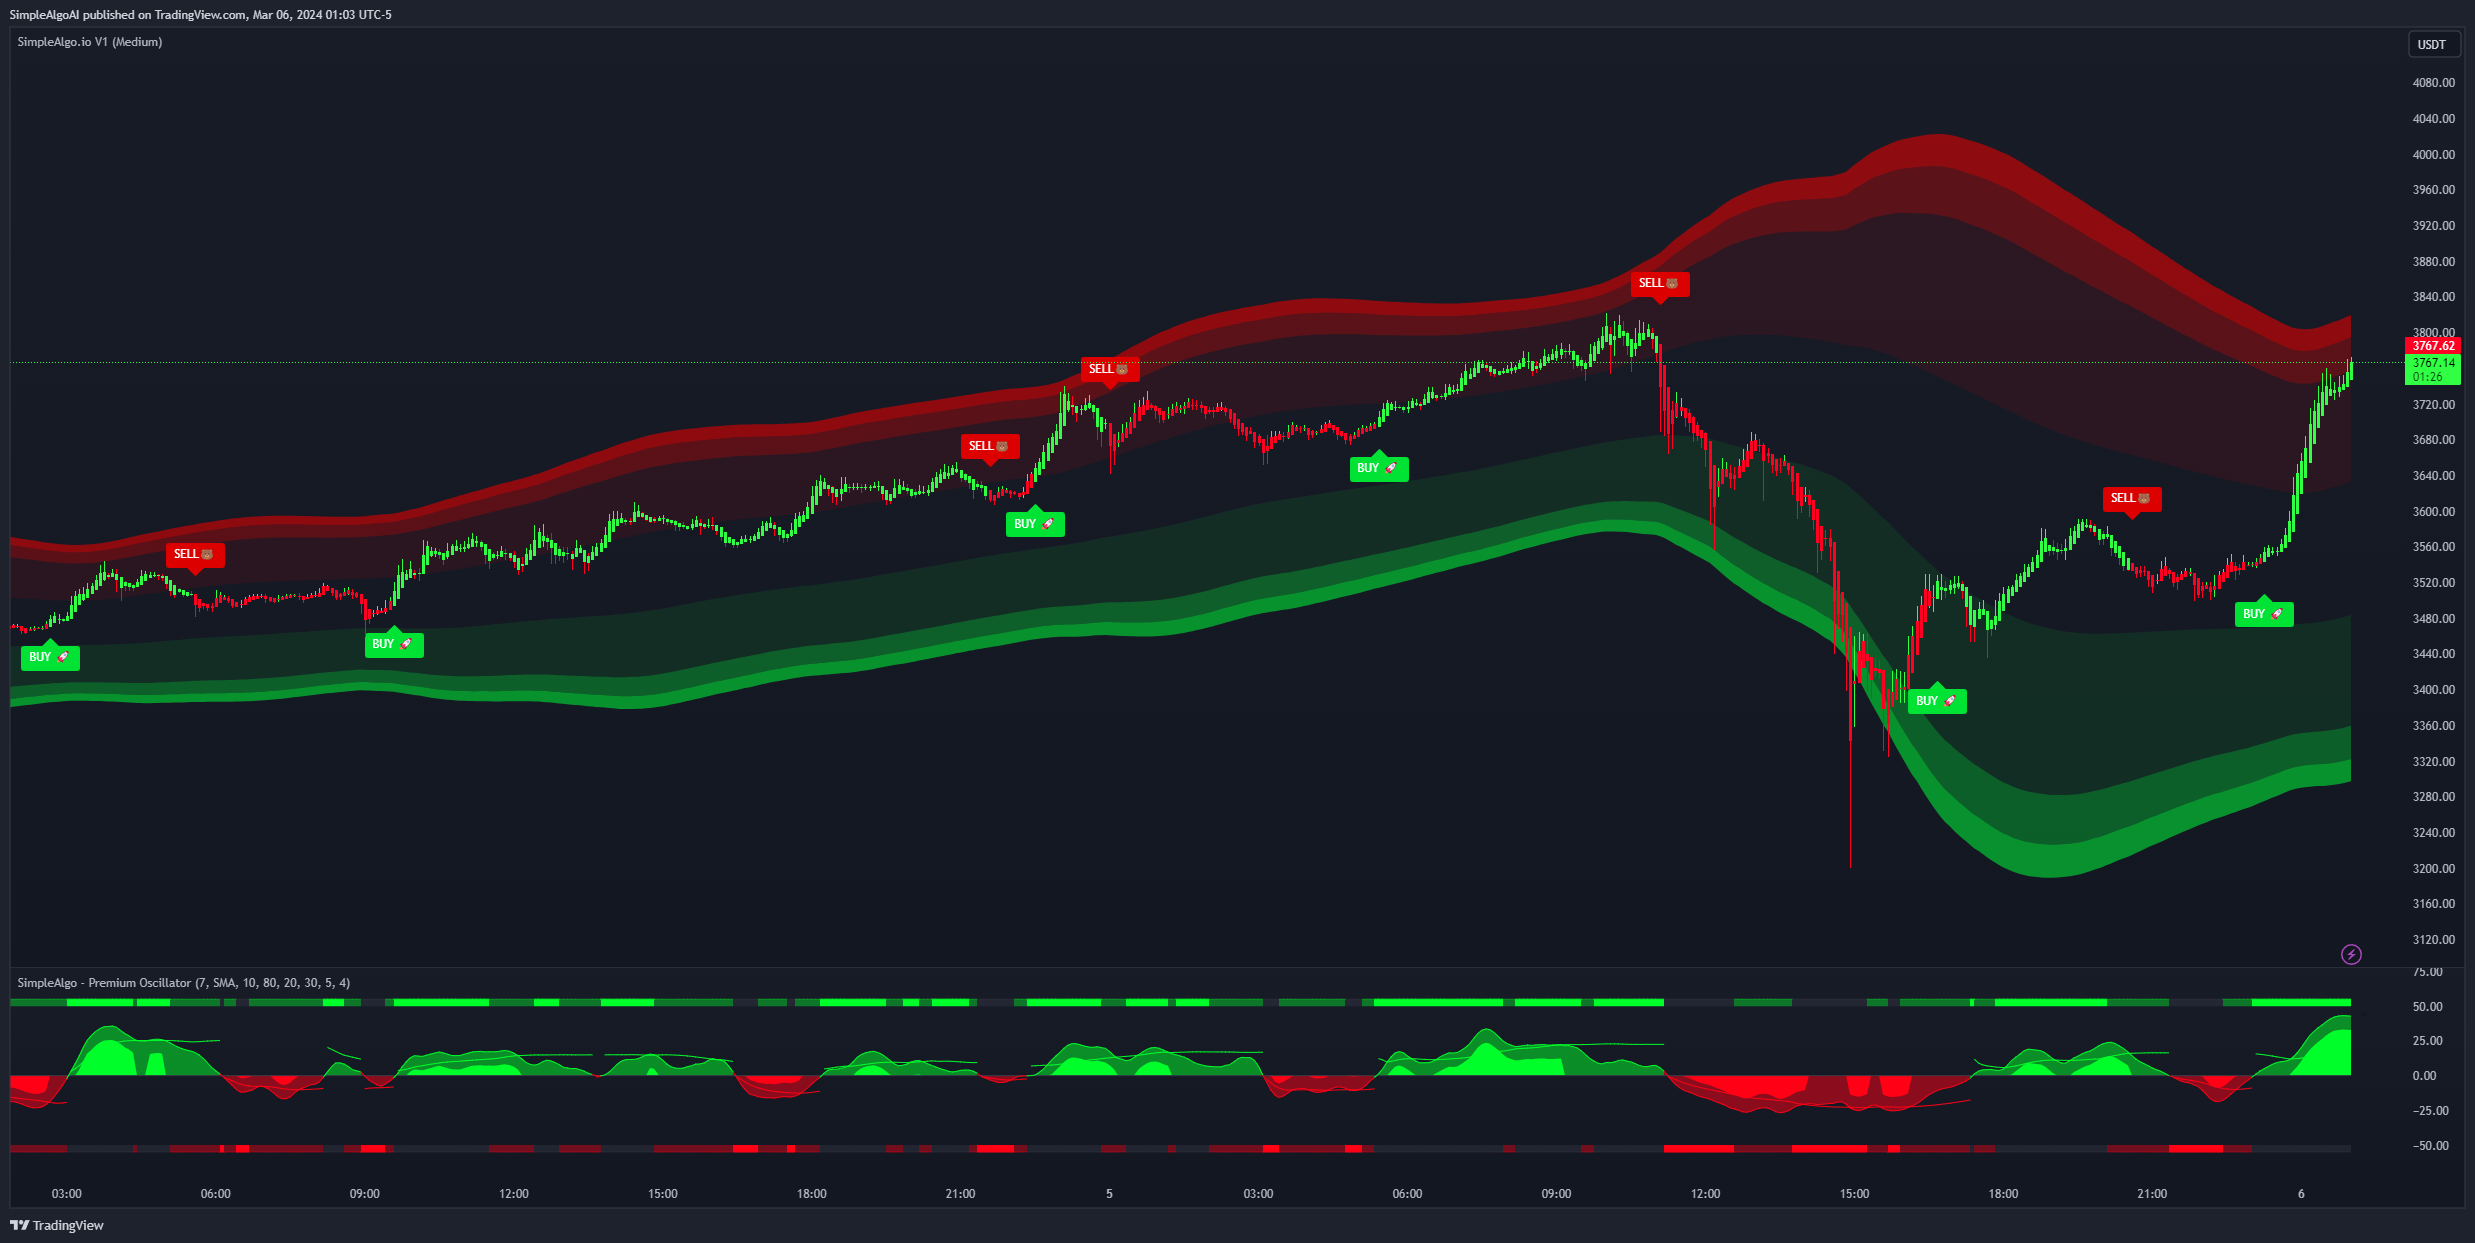
I have no idea what volatility bands realsimplealgo is using, but they’re pretty, and he’s calling out a buy signal on $ETH.
The chart shows either some form of Keltner Channels or a super-modified Bollinger Band; regardless, it almost certainly measures volatility. According to his modified Heiken-Ashi (essentially a Japanese version of a moving average), it flipped into his buy zone.
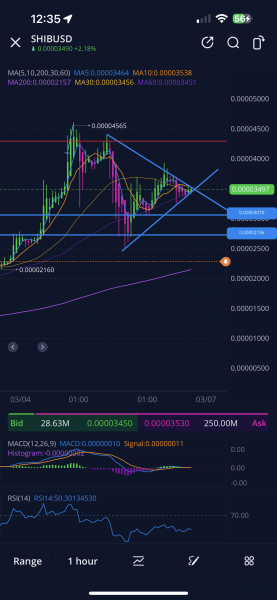
Finally, Spaghettisound1 braving his touchscreen to chart on $SHIB. Which makes sense because only a true Shiba Inu degen would chart on his phone.
Also using Heiken-Ashi, Spaghettisound1 identified a triangle pattern and the chart is right at the apex.