Q2 Is The Best Performing Quarter For Crypto

Bitcoin’s Quarterly Chart

On Bitcoin’s quarterly chart, two significant oscillator levels are present, which many analysts and experts believe could indicate a potential new bull run.

It is worth noting that, prior to Q1 2023, $BTC had experienced four consecutive quarterly losses, making it the longest such period in its history.

BTCUSD Quarterly Chart – Click to enlarge.

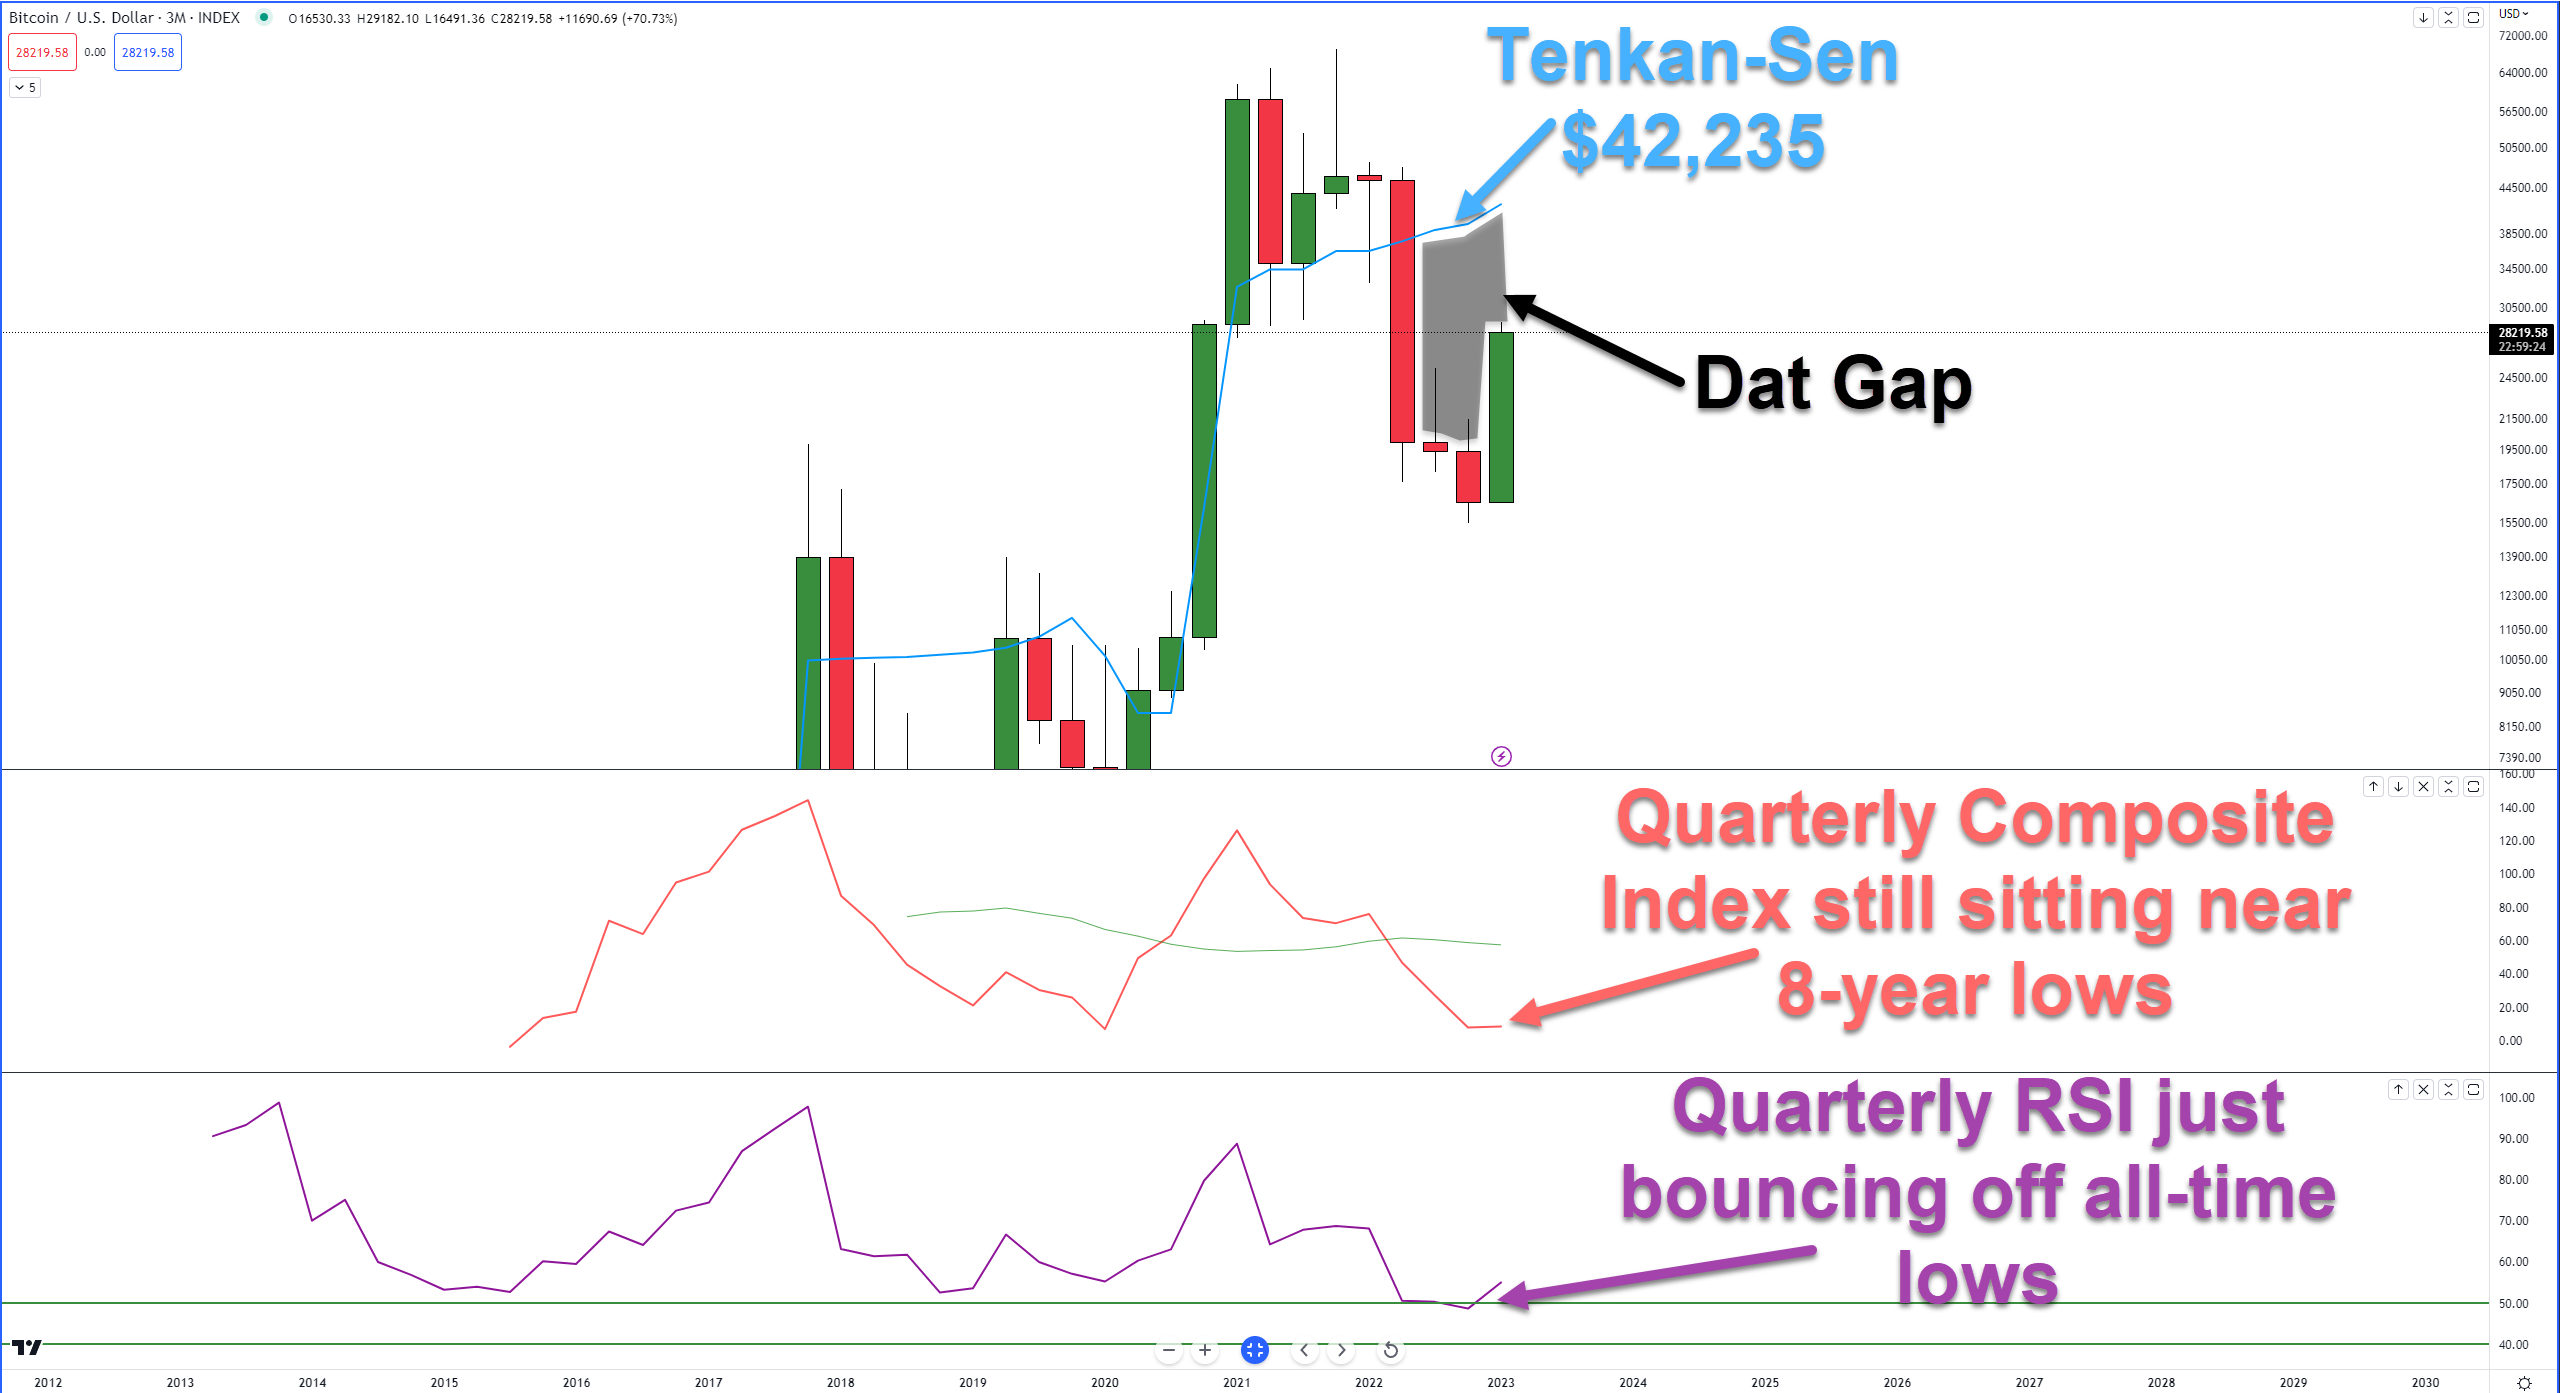
In Q4 2022, the quarterly RSI dropped below the first oversold level for the first time in a bull market, but bounced in Q1 2023. Meanwhile, the Composite Index has slightly increased after reaching eight-year lows.

When the gaps between the candlestick bodies and the Tenkan-Sen are considered alongside oscillator levels, it appears that there is a strong chance of a mean reversion towards the Tenkan-Sen, leading to a continuation of the current bullish price correction as the market price returns to equilibrium.

We will need to wait and observe how Bitcoin performs in testing the Tenkan-Sen, as the bears could potentially regain control if Q2 closes below the Tenkan-Sen and the quarterly oscillators display bearish divergence. 

Let’s see how Q2 goes!

More in   Crypto

View All

Ripple Gets A Big Win With Hinman

Ripple has achieved a small victory in its legal battle against the SEC as the agency’s attempt to seal the “Hinman Speech documents” was denied. 🎉

These internal files contain drafts and emails about a speech given by William Hinman, former Director of the SEC’s Division of Corporation Finance, over four years ago, saying $ETH is not a security. The documents are sought after by Ripple’s legal team to understand how the SEC arrived at its conclusion that Ethereum was not a security at the time, which could impact the classification of Ripple’s $XRP cryptocurrency.

Read It

Technically Speaking – May 26, 2023

We’re going to revisit two of our previous Technically Speaking articles and evaluate how they’ve performed since their date of publishing. Call me a big nerd, but it’s fun to track the market’s progression and how it does or doesn’t follow the technical analysis theories applied.

The especially interesting aspects are the theories underpinning technical analysis—some of which have their roots more than a century ago—were conceived long before cryptocurrencies even made their debut on a candlestick chart. This offers us an extraordinary opportunity to transpose these time-tested theories onto a new market and to observe first-hand how they function and manifest. This is precisely what we will be doing in our discussion today.

Read It