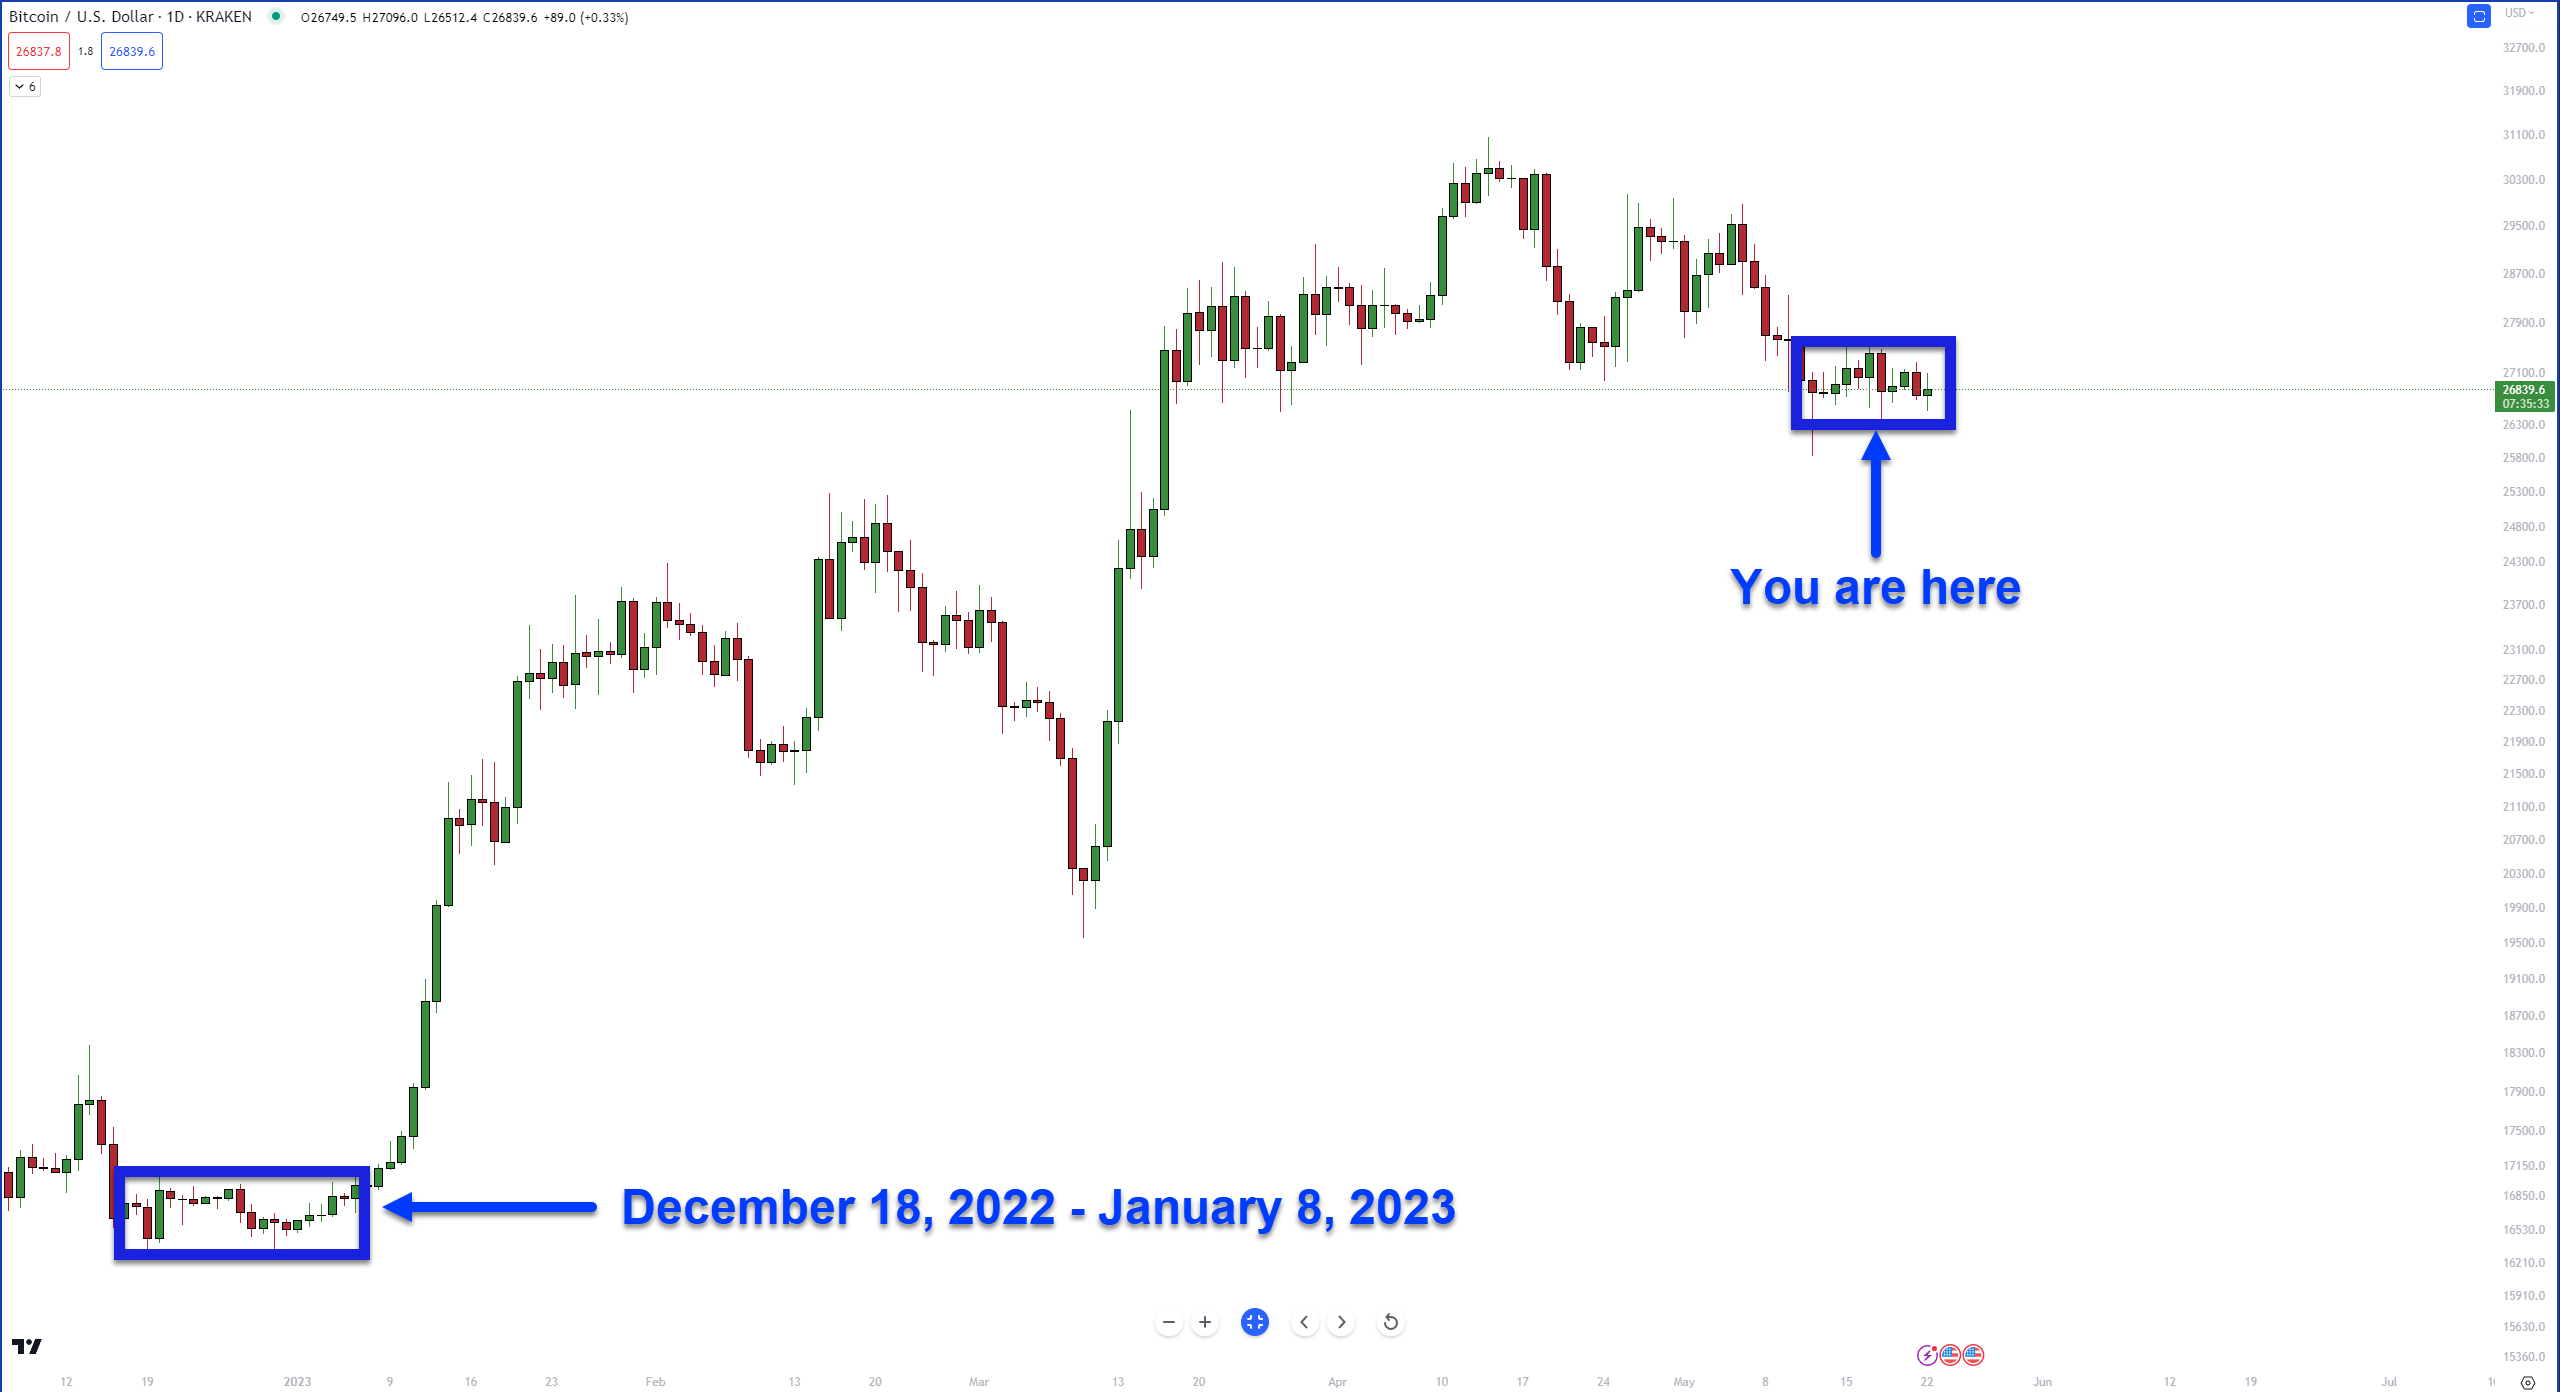
$BTC, and the broader market is more congested than a herd of penguins at a revolving door convention. 🐧
The last time this market was stuck in a congested environment like we are experiencing today was the last half of December 2022 to the first week-ish of January 2023.
Oof. Not fun. Look at $ETH‘s chart below. Get rid of the wicks, and this is what this shite show of a trading range looks like:
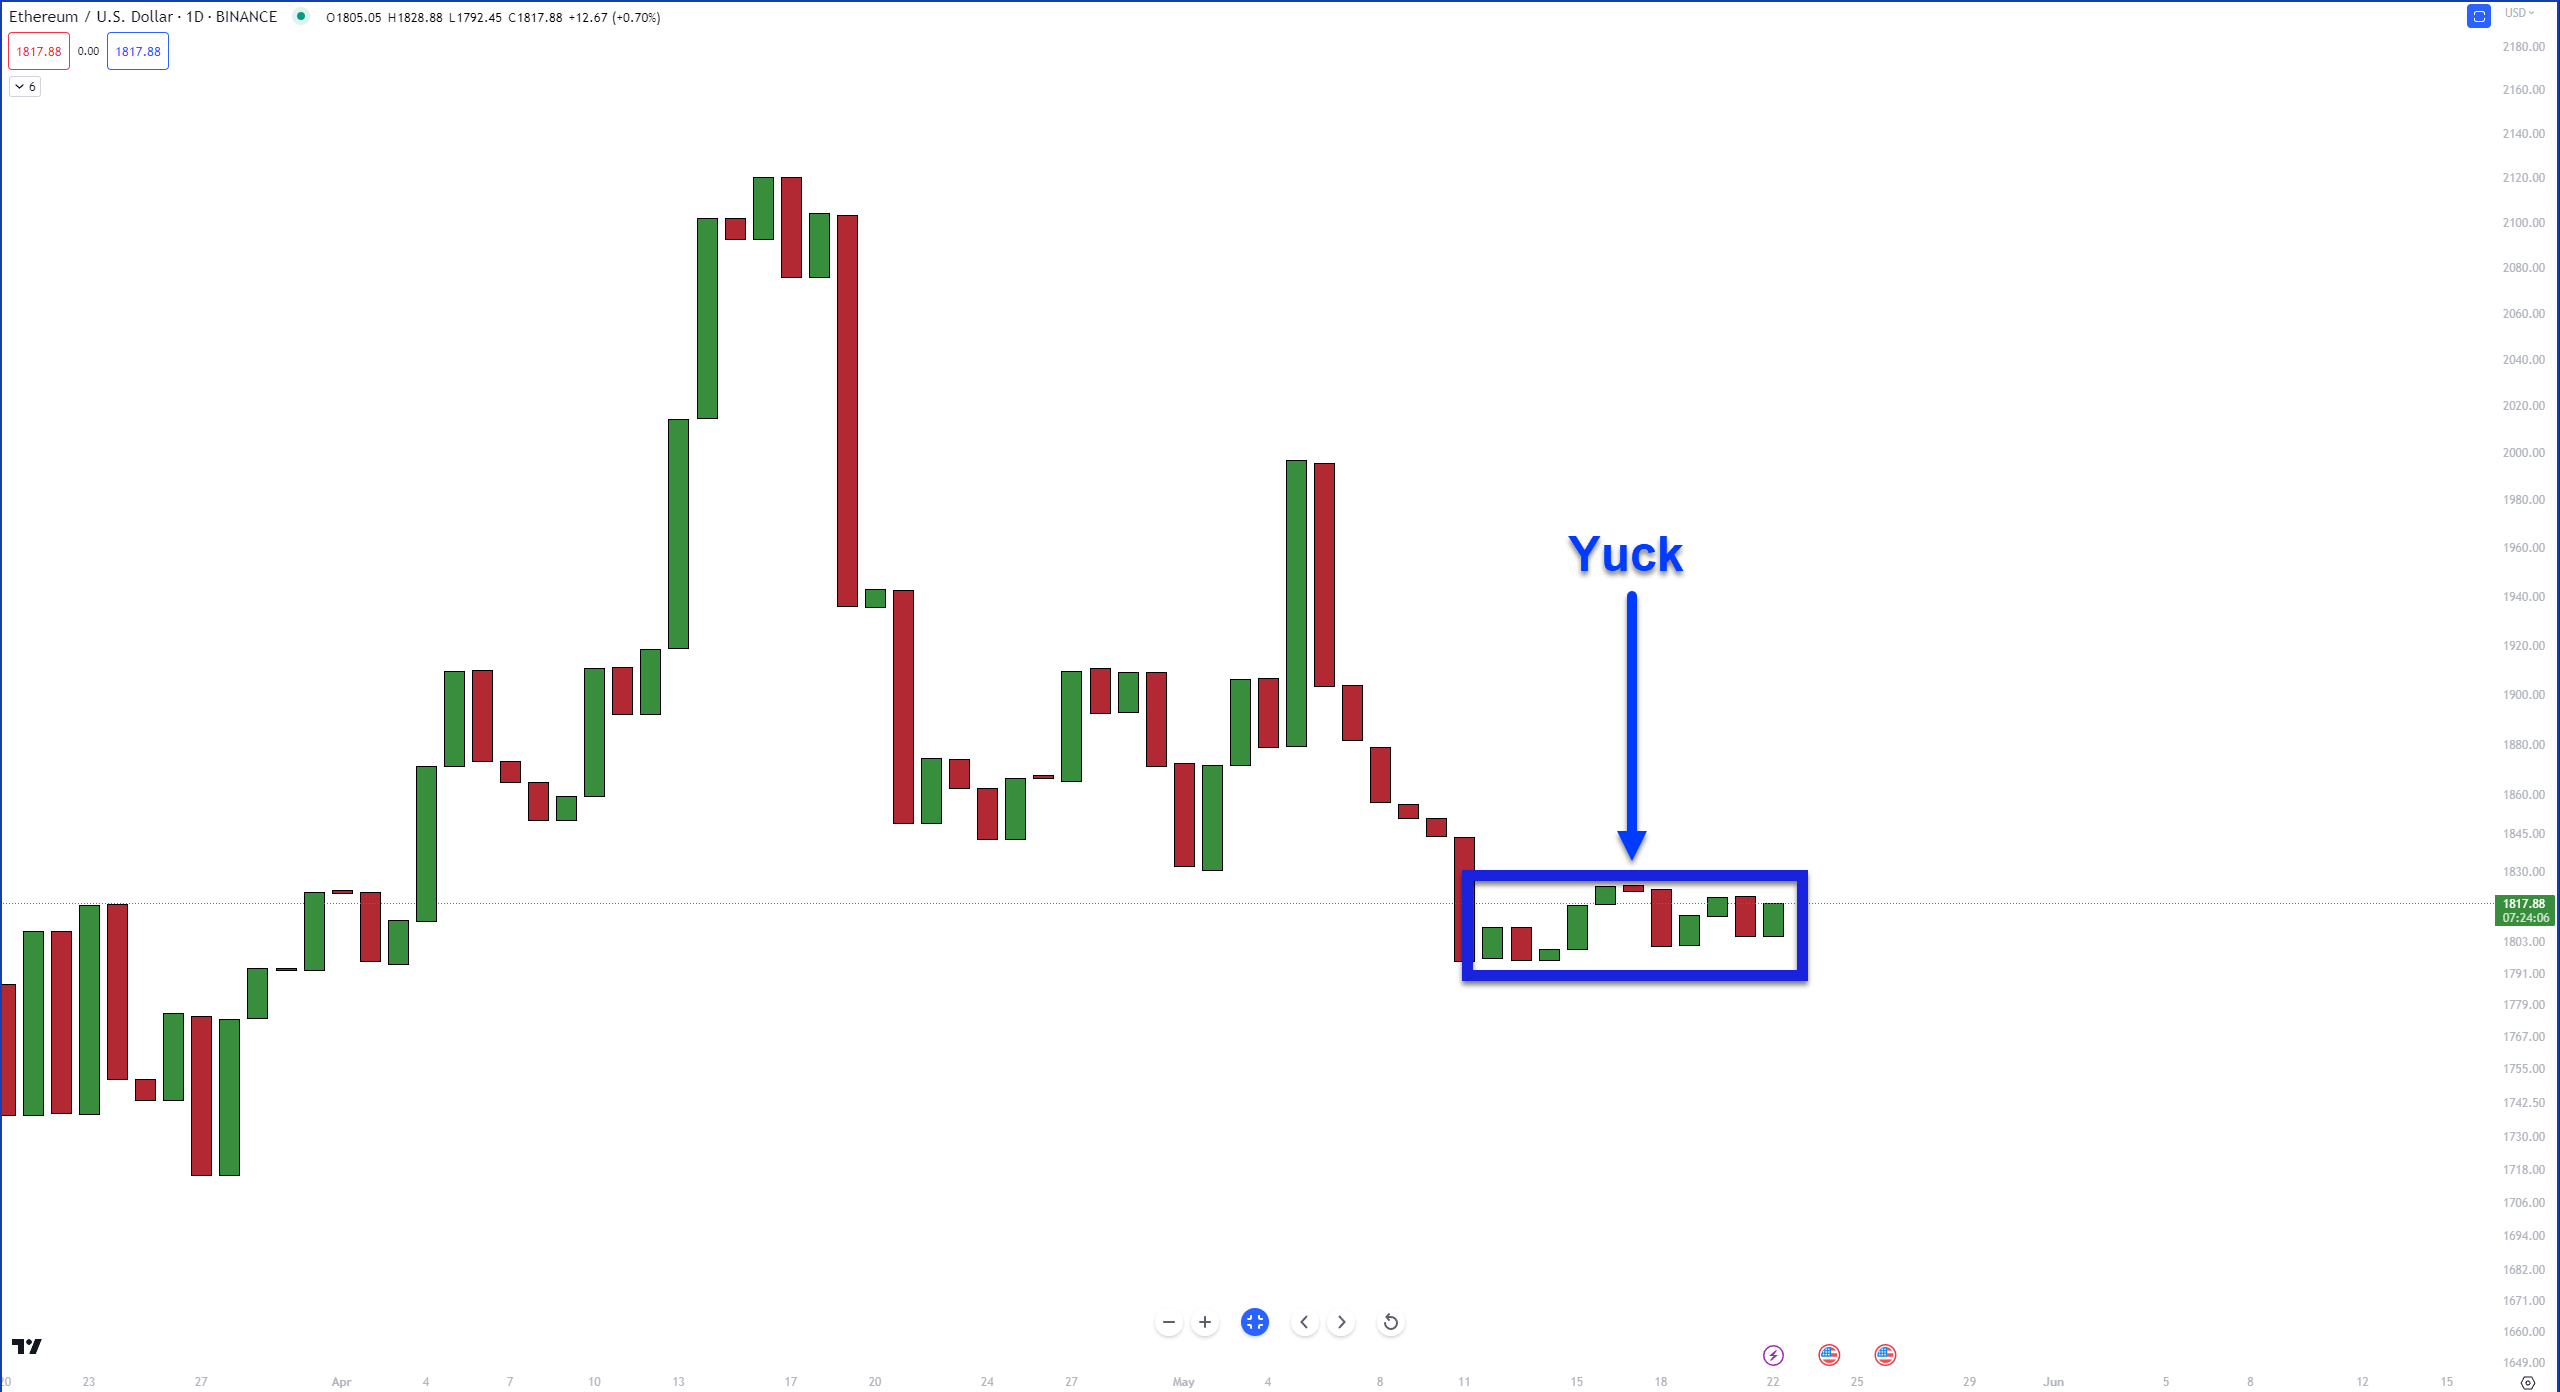
Ya, that’s a less than $30 range over the past ten trading days. Blegh. 🤢
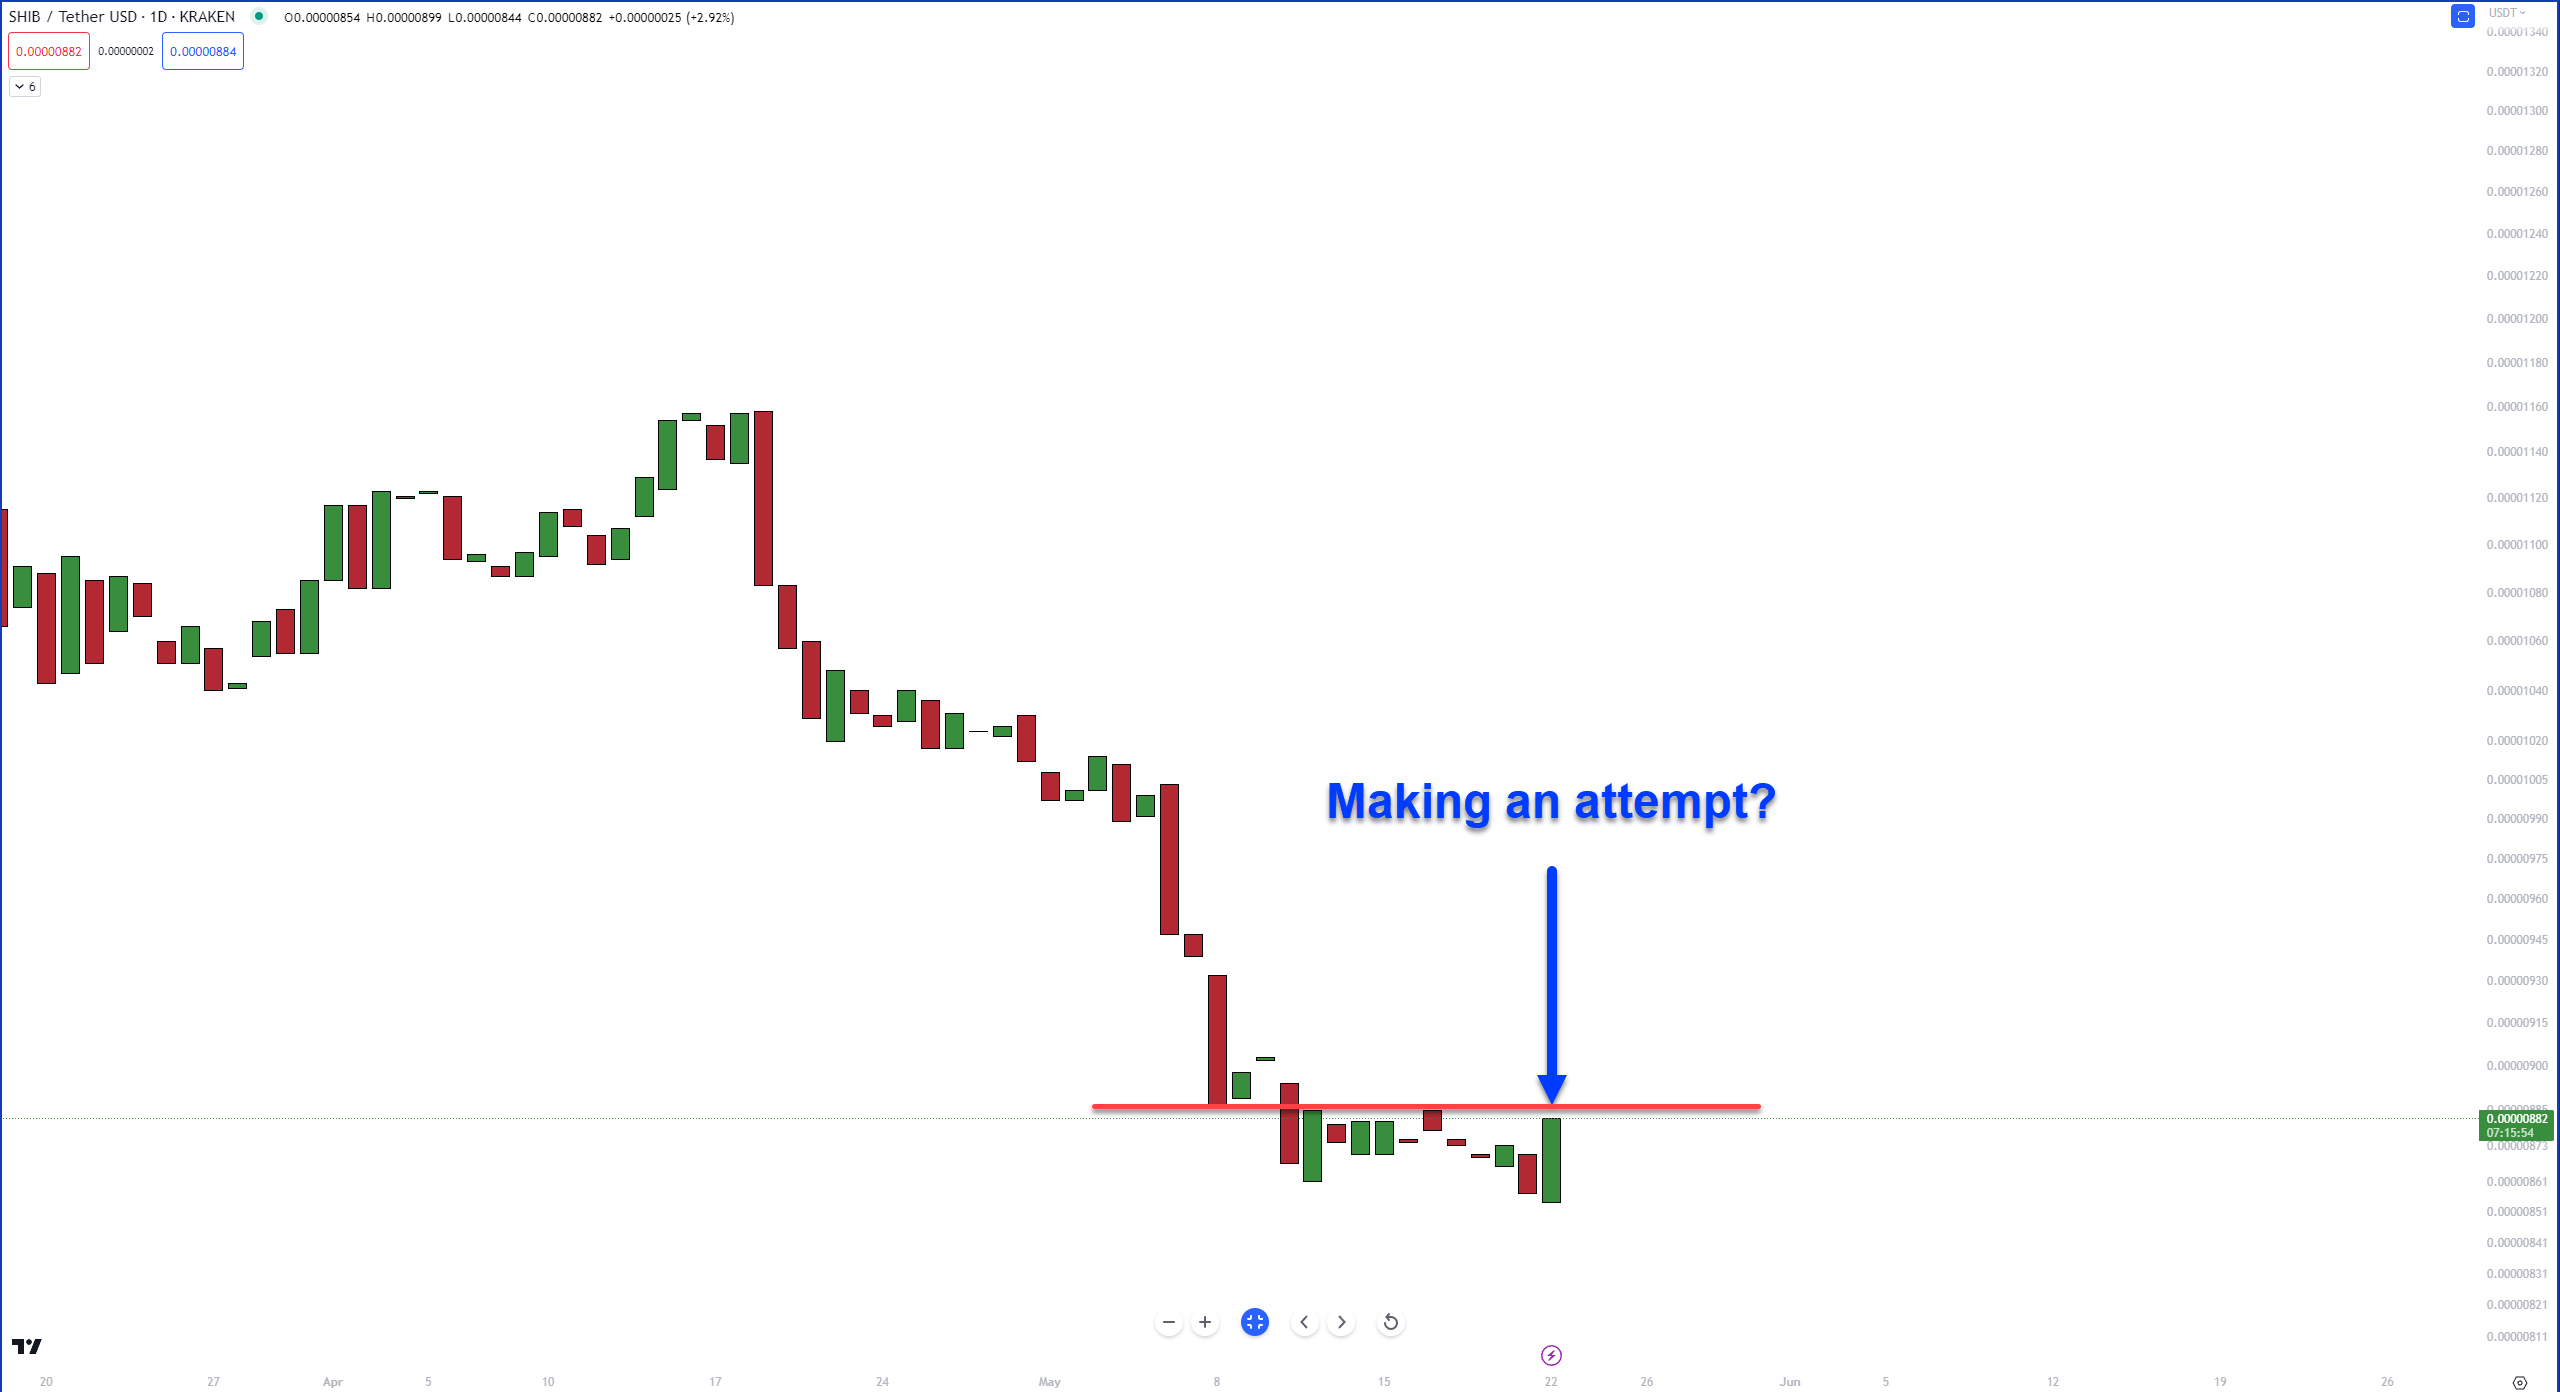
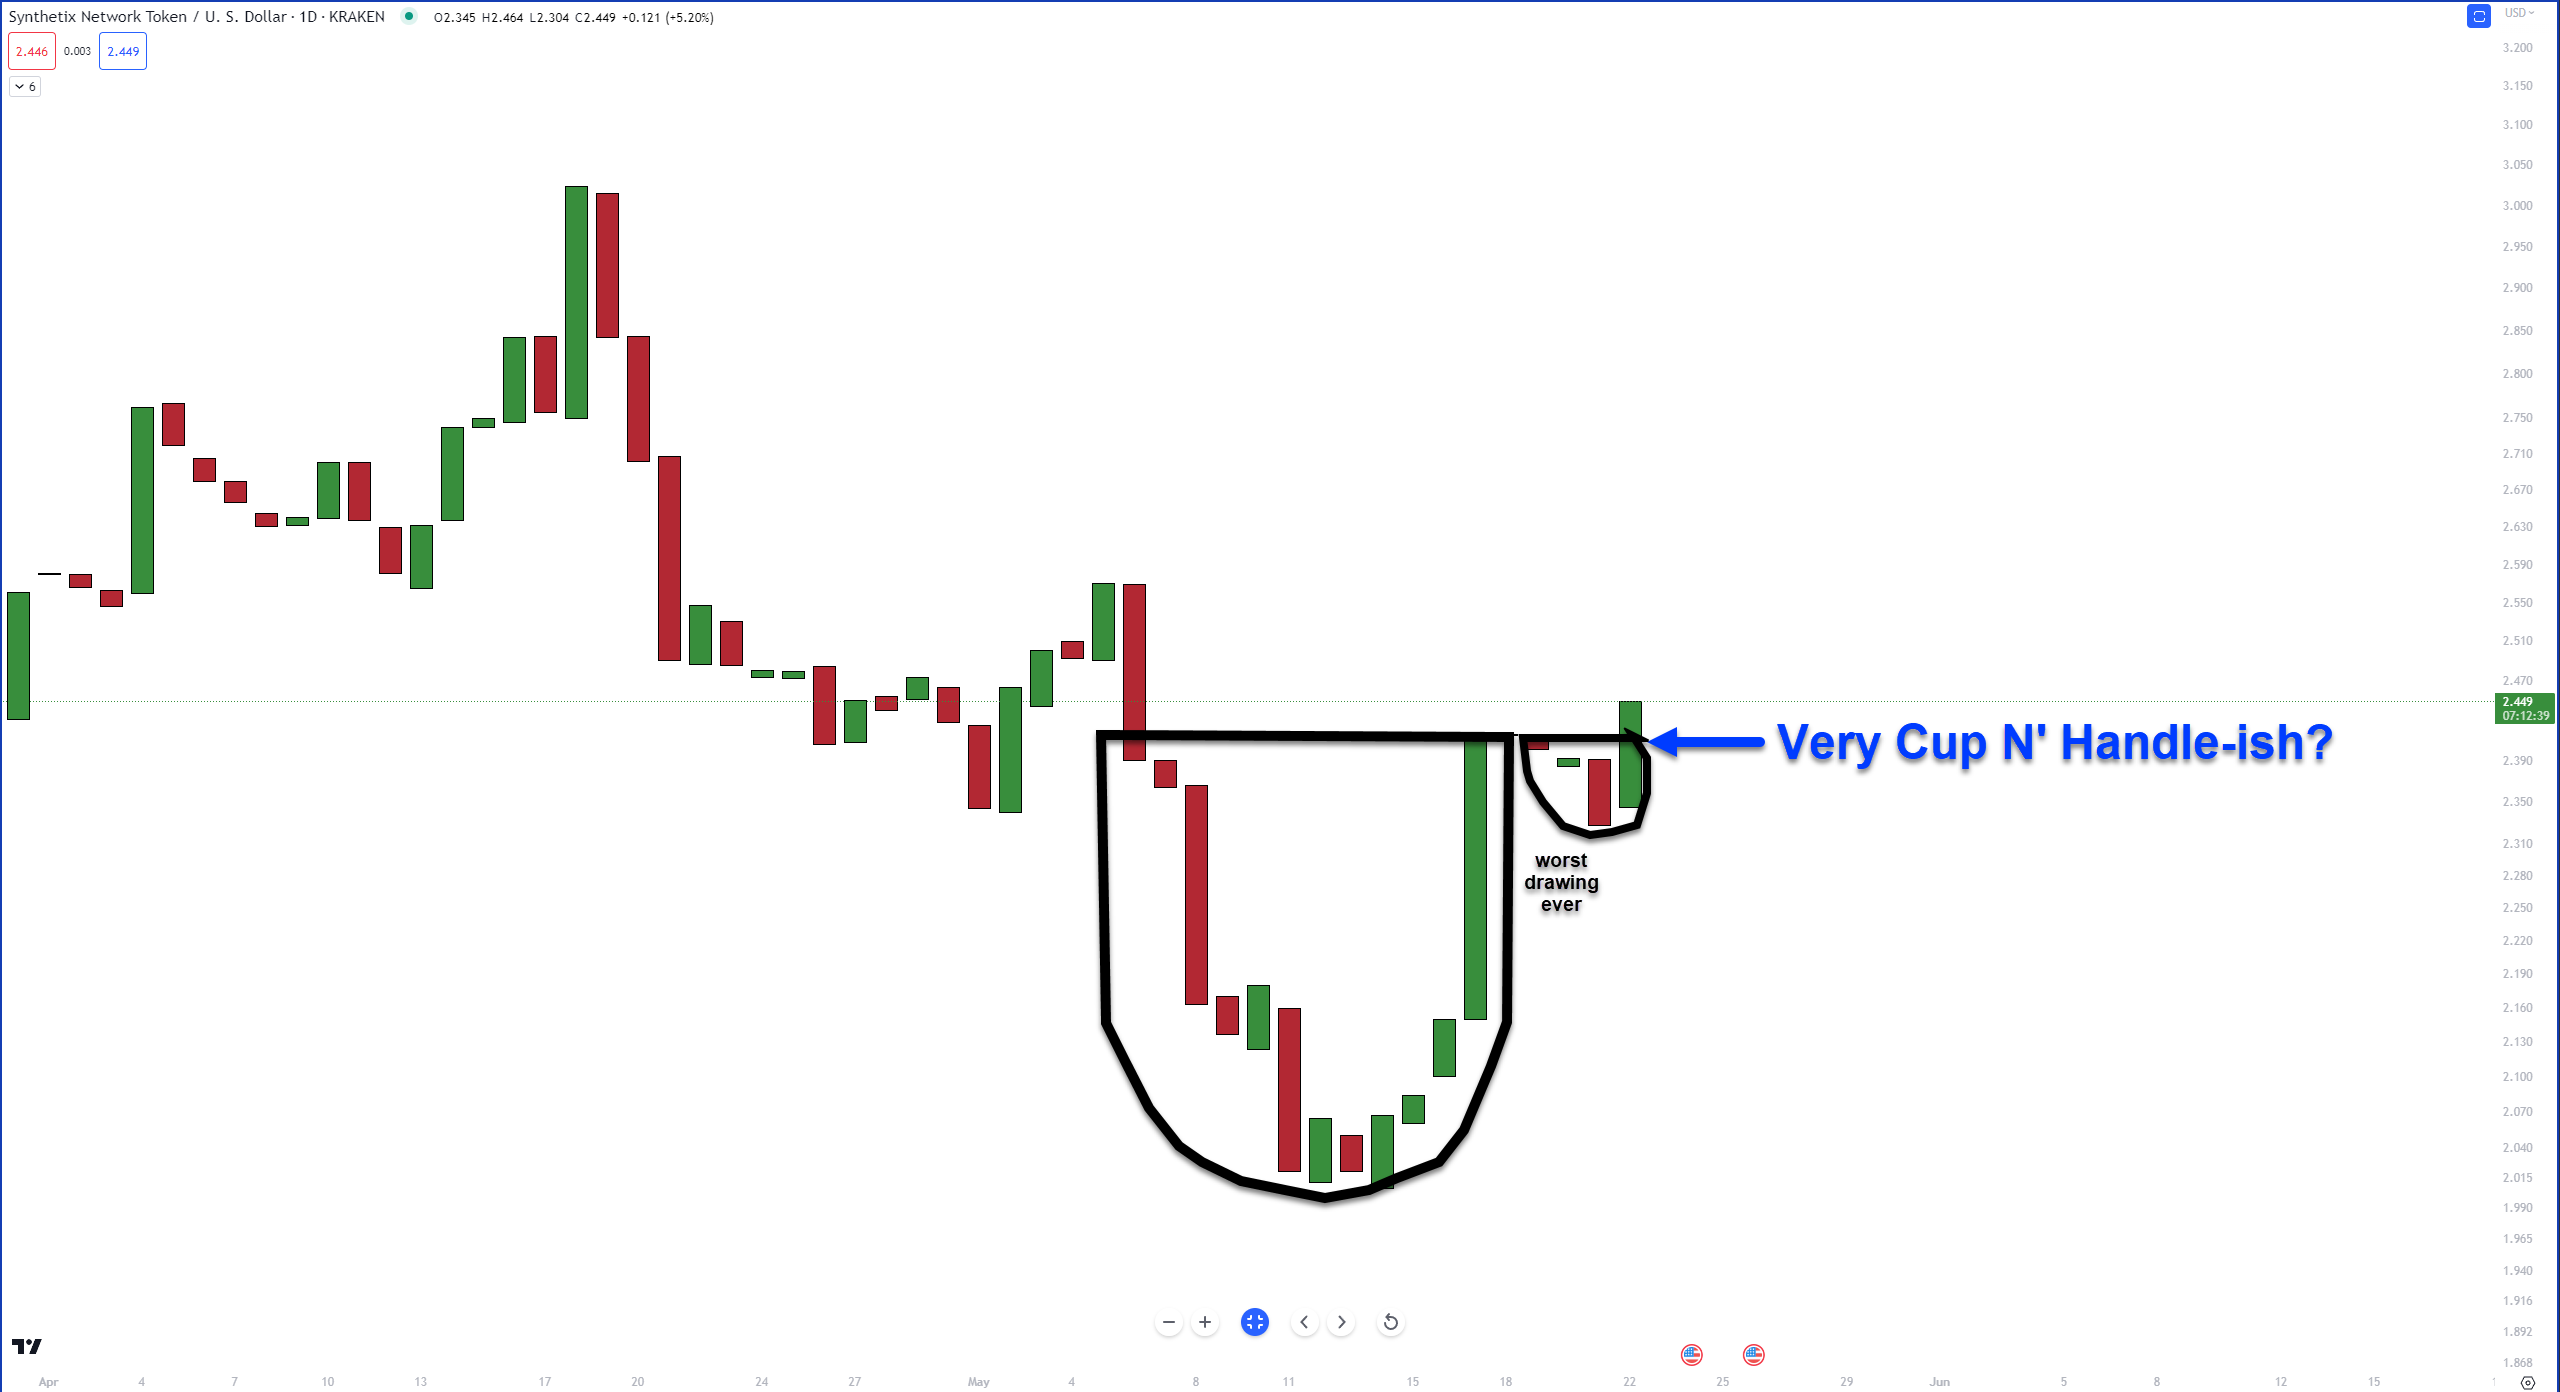
Is there anything showing bullish signs of breaking out? There are a few:
The last chart we’re looking at is the Total Crypto Market Cap chart. It’s in a Falling Wedge pattern. 🧀
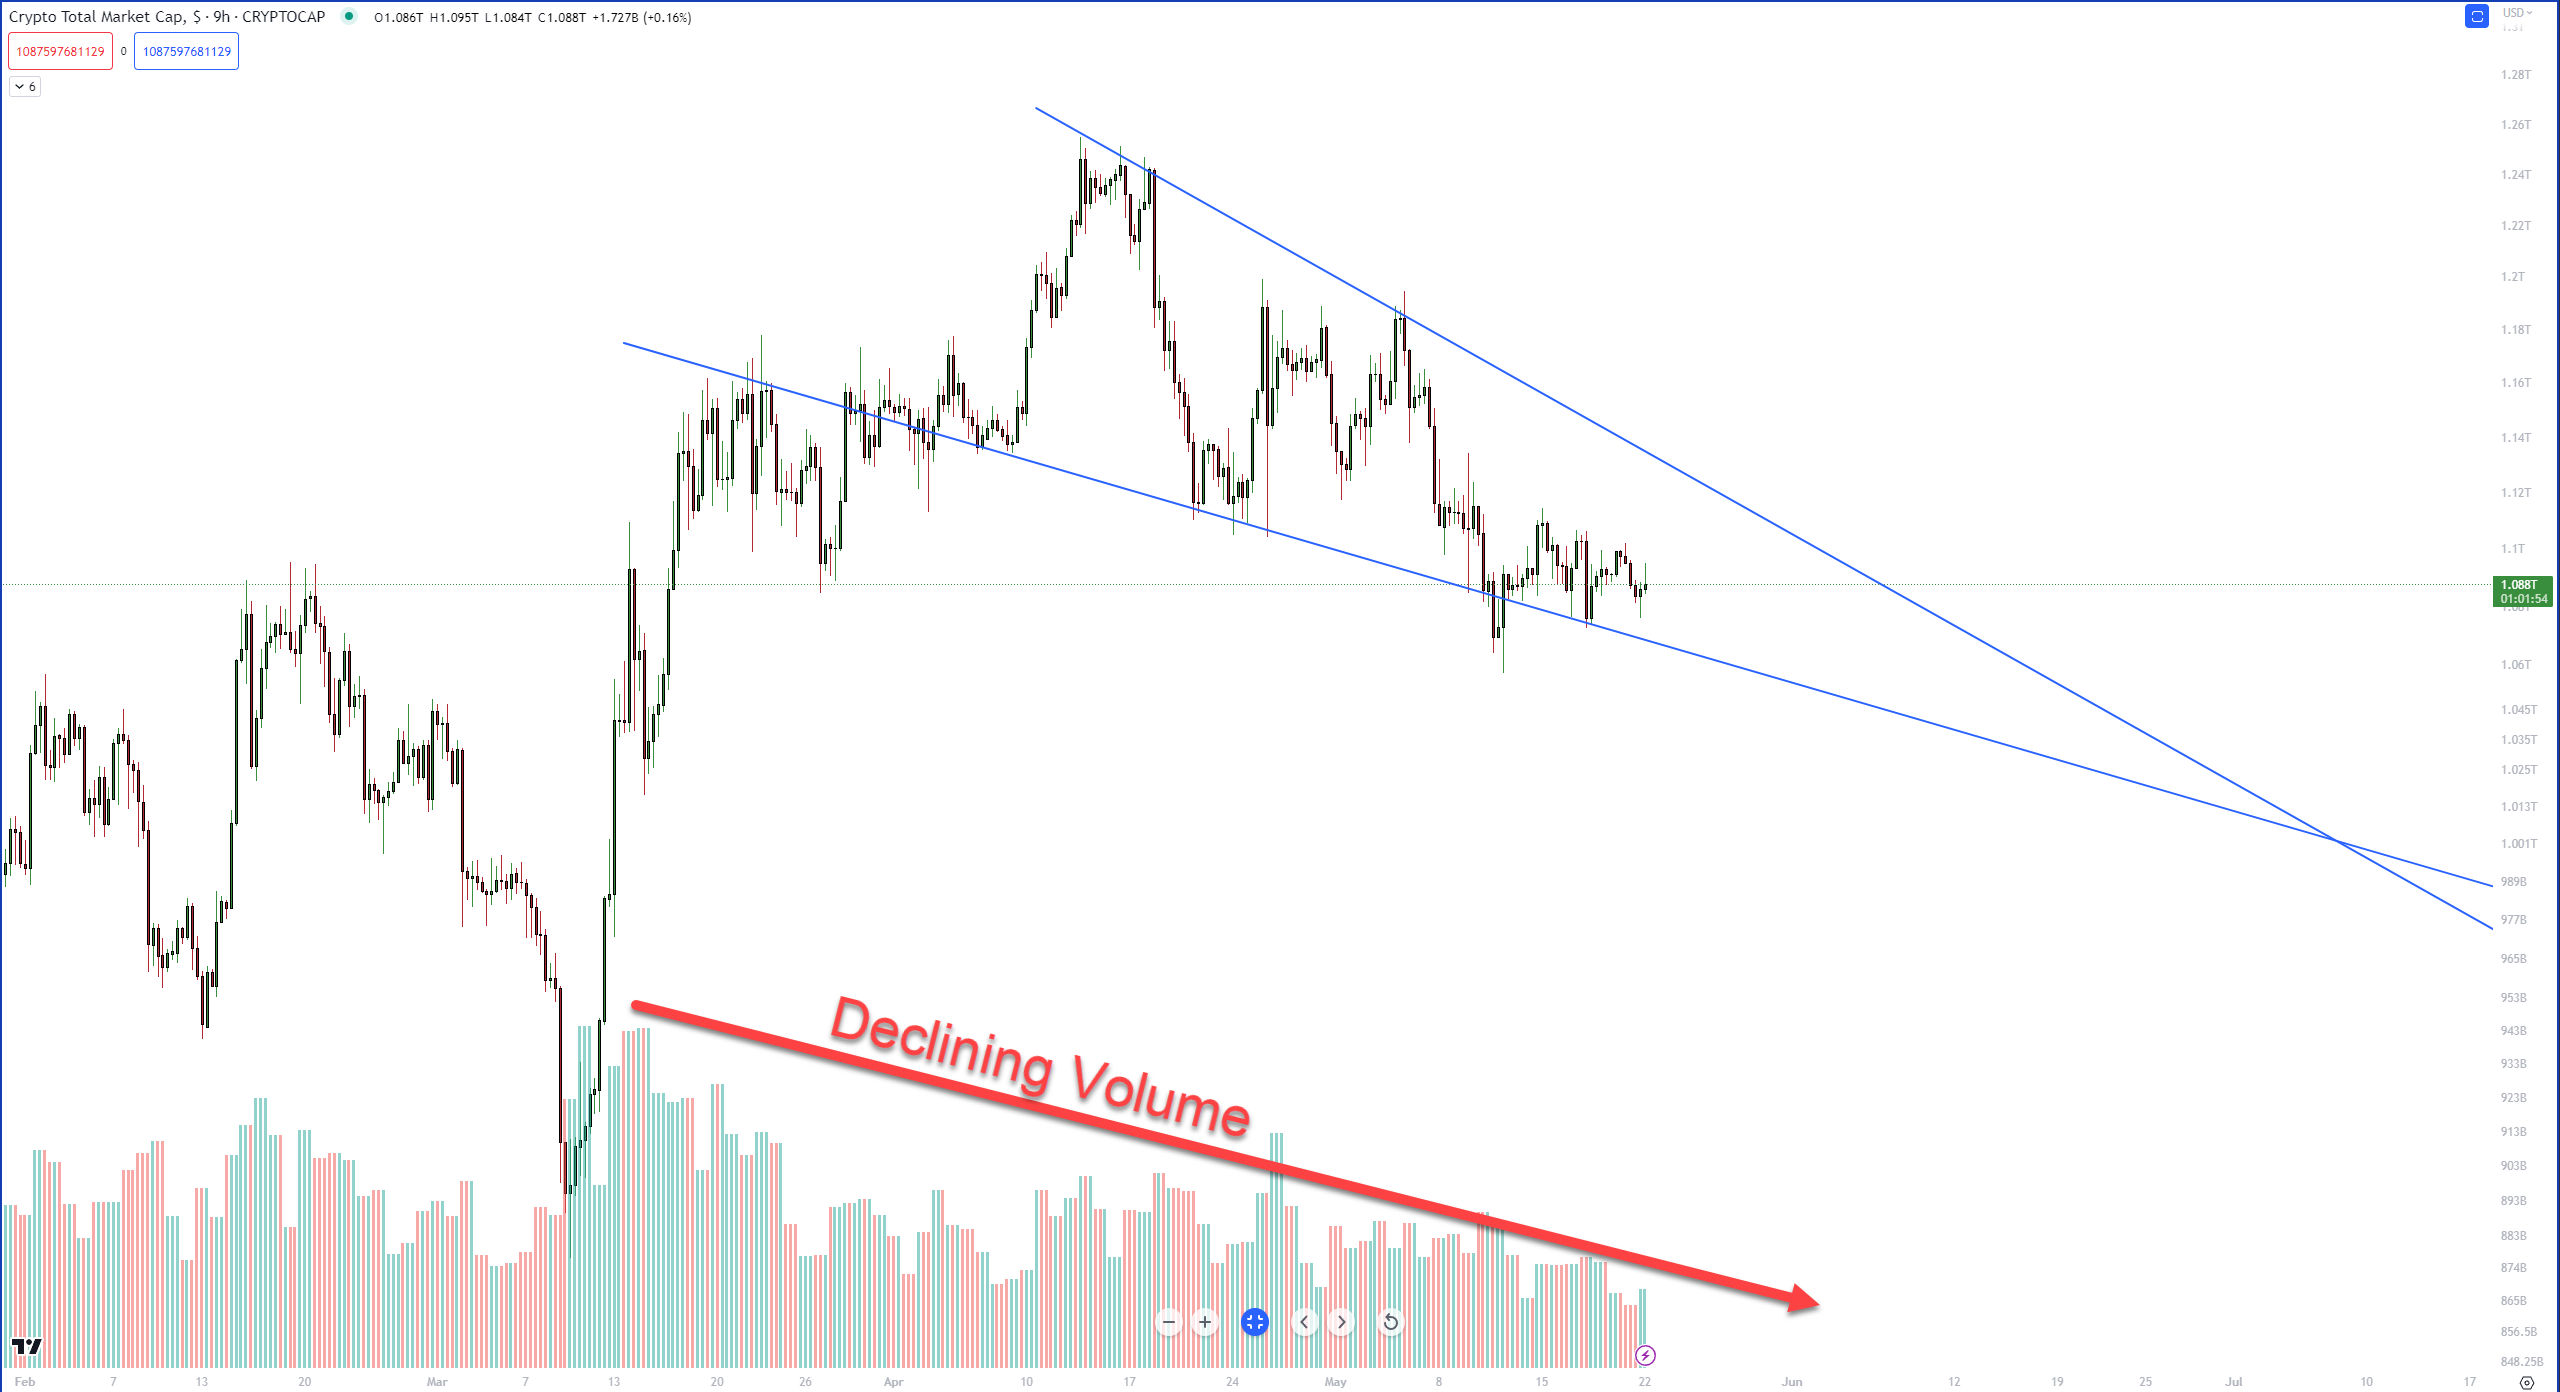
One of the common characteristics that analysts associate with the Falling Wedge, especially if the two trend lines visibly converge, is this:
Volume drops the closer price gets to the apex.
Additionally, a noticeable drop in overall volume can be a precursor to a bigger move, with a sudden spike in volume being the ‘final’ warning sign that something big is about to happen.
Has the maket had a sudden drop in volume? So far, it looks fairly controlled in its decline – but that’s up for interpretation.
We’ll watch for anything major and update as price action continues to develop. ⏱️