Do you know what’s awesome about today’s Litepaper? It’s the first one on a Tuesday, which is heavy on the analysis and setups.
Do you know what sucks about today’s Litepaper? This first new Litepaper is after Bitcion’s new ATH and subsequent sell-off.
Let’s look at the wildness that went on (and is still going on).
P.S. Over the next month, we’ll be transitioning our newsletter platform to Beehiiv. To help ensure our emails keep making it to your inbox, please whitelist newsletter@thelitepaper.stocktwits.com
Here’s how the market looked at the end of the trading day:
| Bitcoin (BTC) | $62,044 | -9.16% |
| Ethereum (ETH) | $3,394 | -6.49% |
| Total Market Cap | $2.23 Trillion | -8.63% |
| Altcoin Market Cap | $1.01 Trillion | -8.01% |

I’m a crypto fanatic. I am constantly observing and looking at what’s going on, and like many of you, the past couple of days, I’ve been glued to my screen or phone waiting for the news when Bitcoin hit a new all-time high. 👀
And now I need your help. Because I need someone to figure out the odds of someone like me, MISSING THE GODDAMN EVENT BECAUSE OF A DR’S APPOINTMENT.
For that quick 45 minutes away from my phone, it happened. FML.

It feels like crossing the finish line and accomplishing a personal best. You celebrate, you cheer, but you look around and your wife, kids, friends, they didn’t even show up. And then some dude randomly hits you in the face with a 2×4.
Let’s see how bad things are out there. 🥵

When bulls get liquidated, bears get excited. When bears get liquidated, bulls get excited. 😁
I have no idea what happens when everyone gets liquidated. From Glassnode’s Liquidation Heatmap, here’s this insane look.
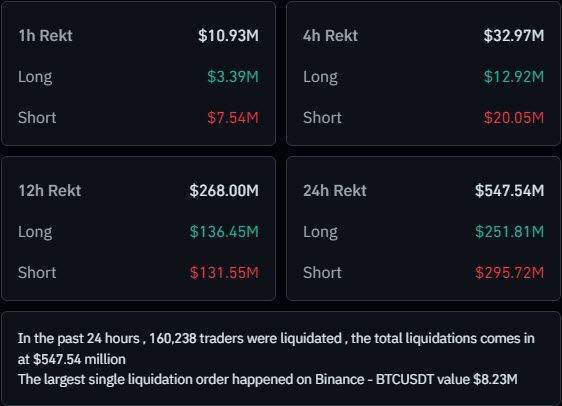
$251.81 million in longs liquidated, $295.7 million in shorts liquidated.
So as I was writing the text above, I thought I better check to see how much worse things are. The image above is from around 0900 EST. Sweet-Mrs.-Butterworth-on-my-waffles things got worse:
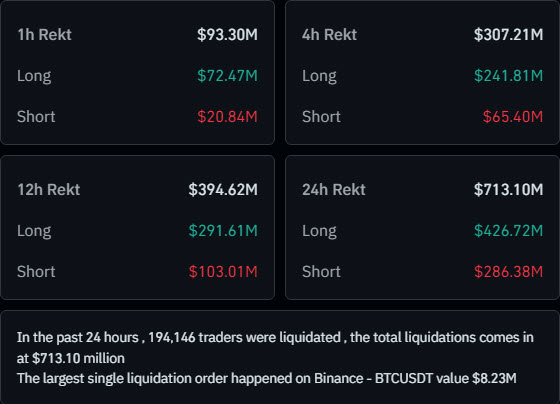
Almost 200,000 traders flushed. $476.7 million longs and $286.4 million shorts liquidated. $713 Million Total. 😵

Well, like I said, this isn’t a fun Litepaper. Instead of finding wen-Moon or wen-Lambo, we will be looking for wen-bottom. 💔
I’ll keep it short and sweet, quickly identifying where analysts and traders see strong support levels ahead.
Real quick: Last Friday’s Litepaper discussed in detail the warnings about today’s selling pressure using time cycle magic 8 ball 1-800-MISS-CLEO voodoo chicken bone analysis. You should give a read through.
Cardano
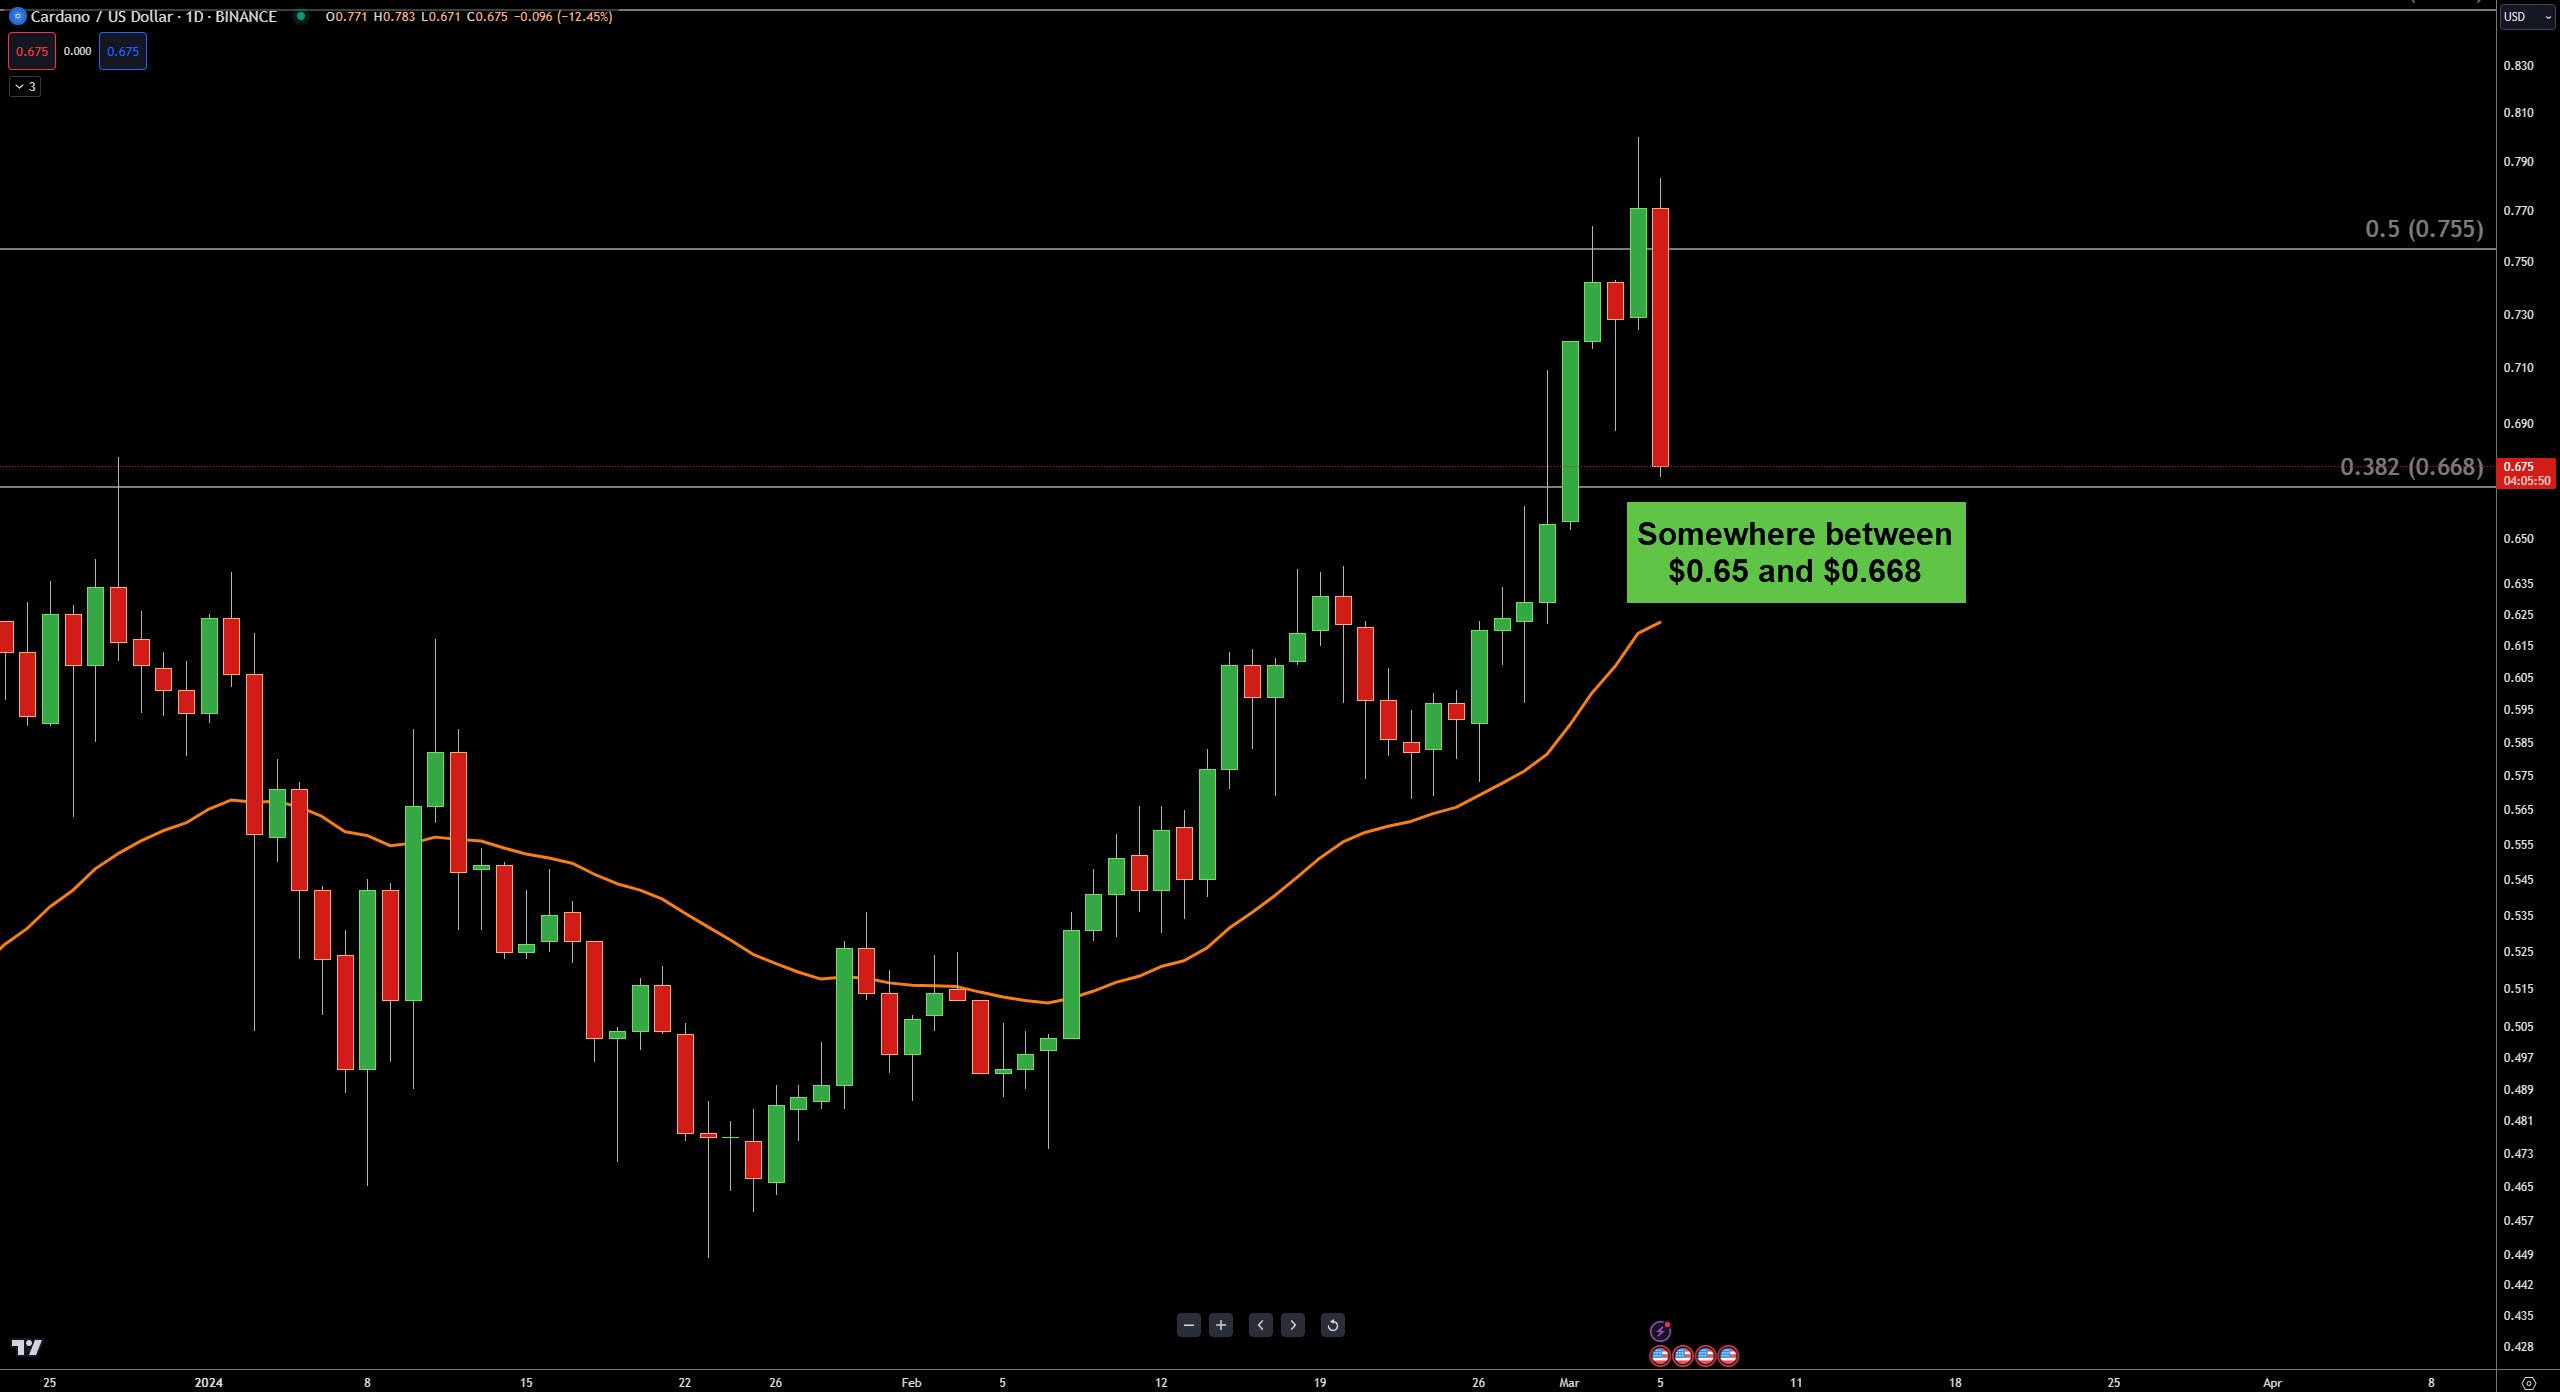
On the daily, between 30-day moving average and the 38.2% Fibonacci retracement is the first support zone. On the weekly (not shown), it’s looking like the $0.55 value area for $ADA.
Tezos
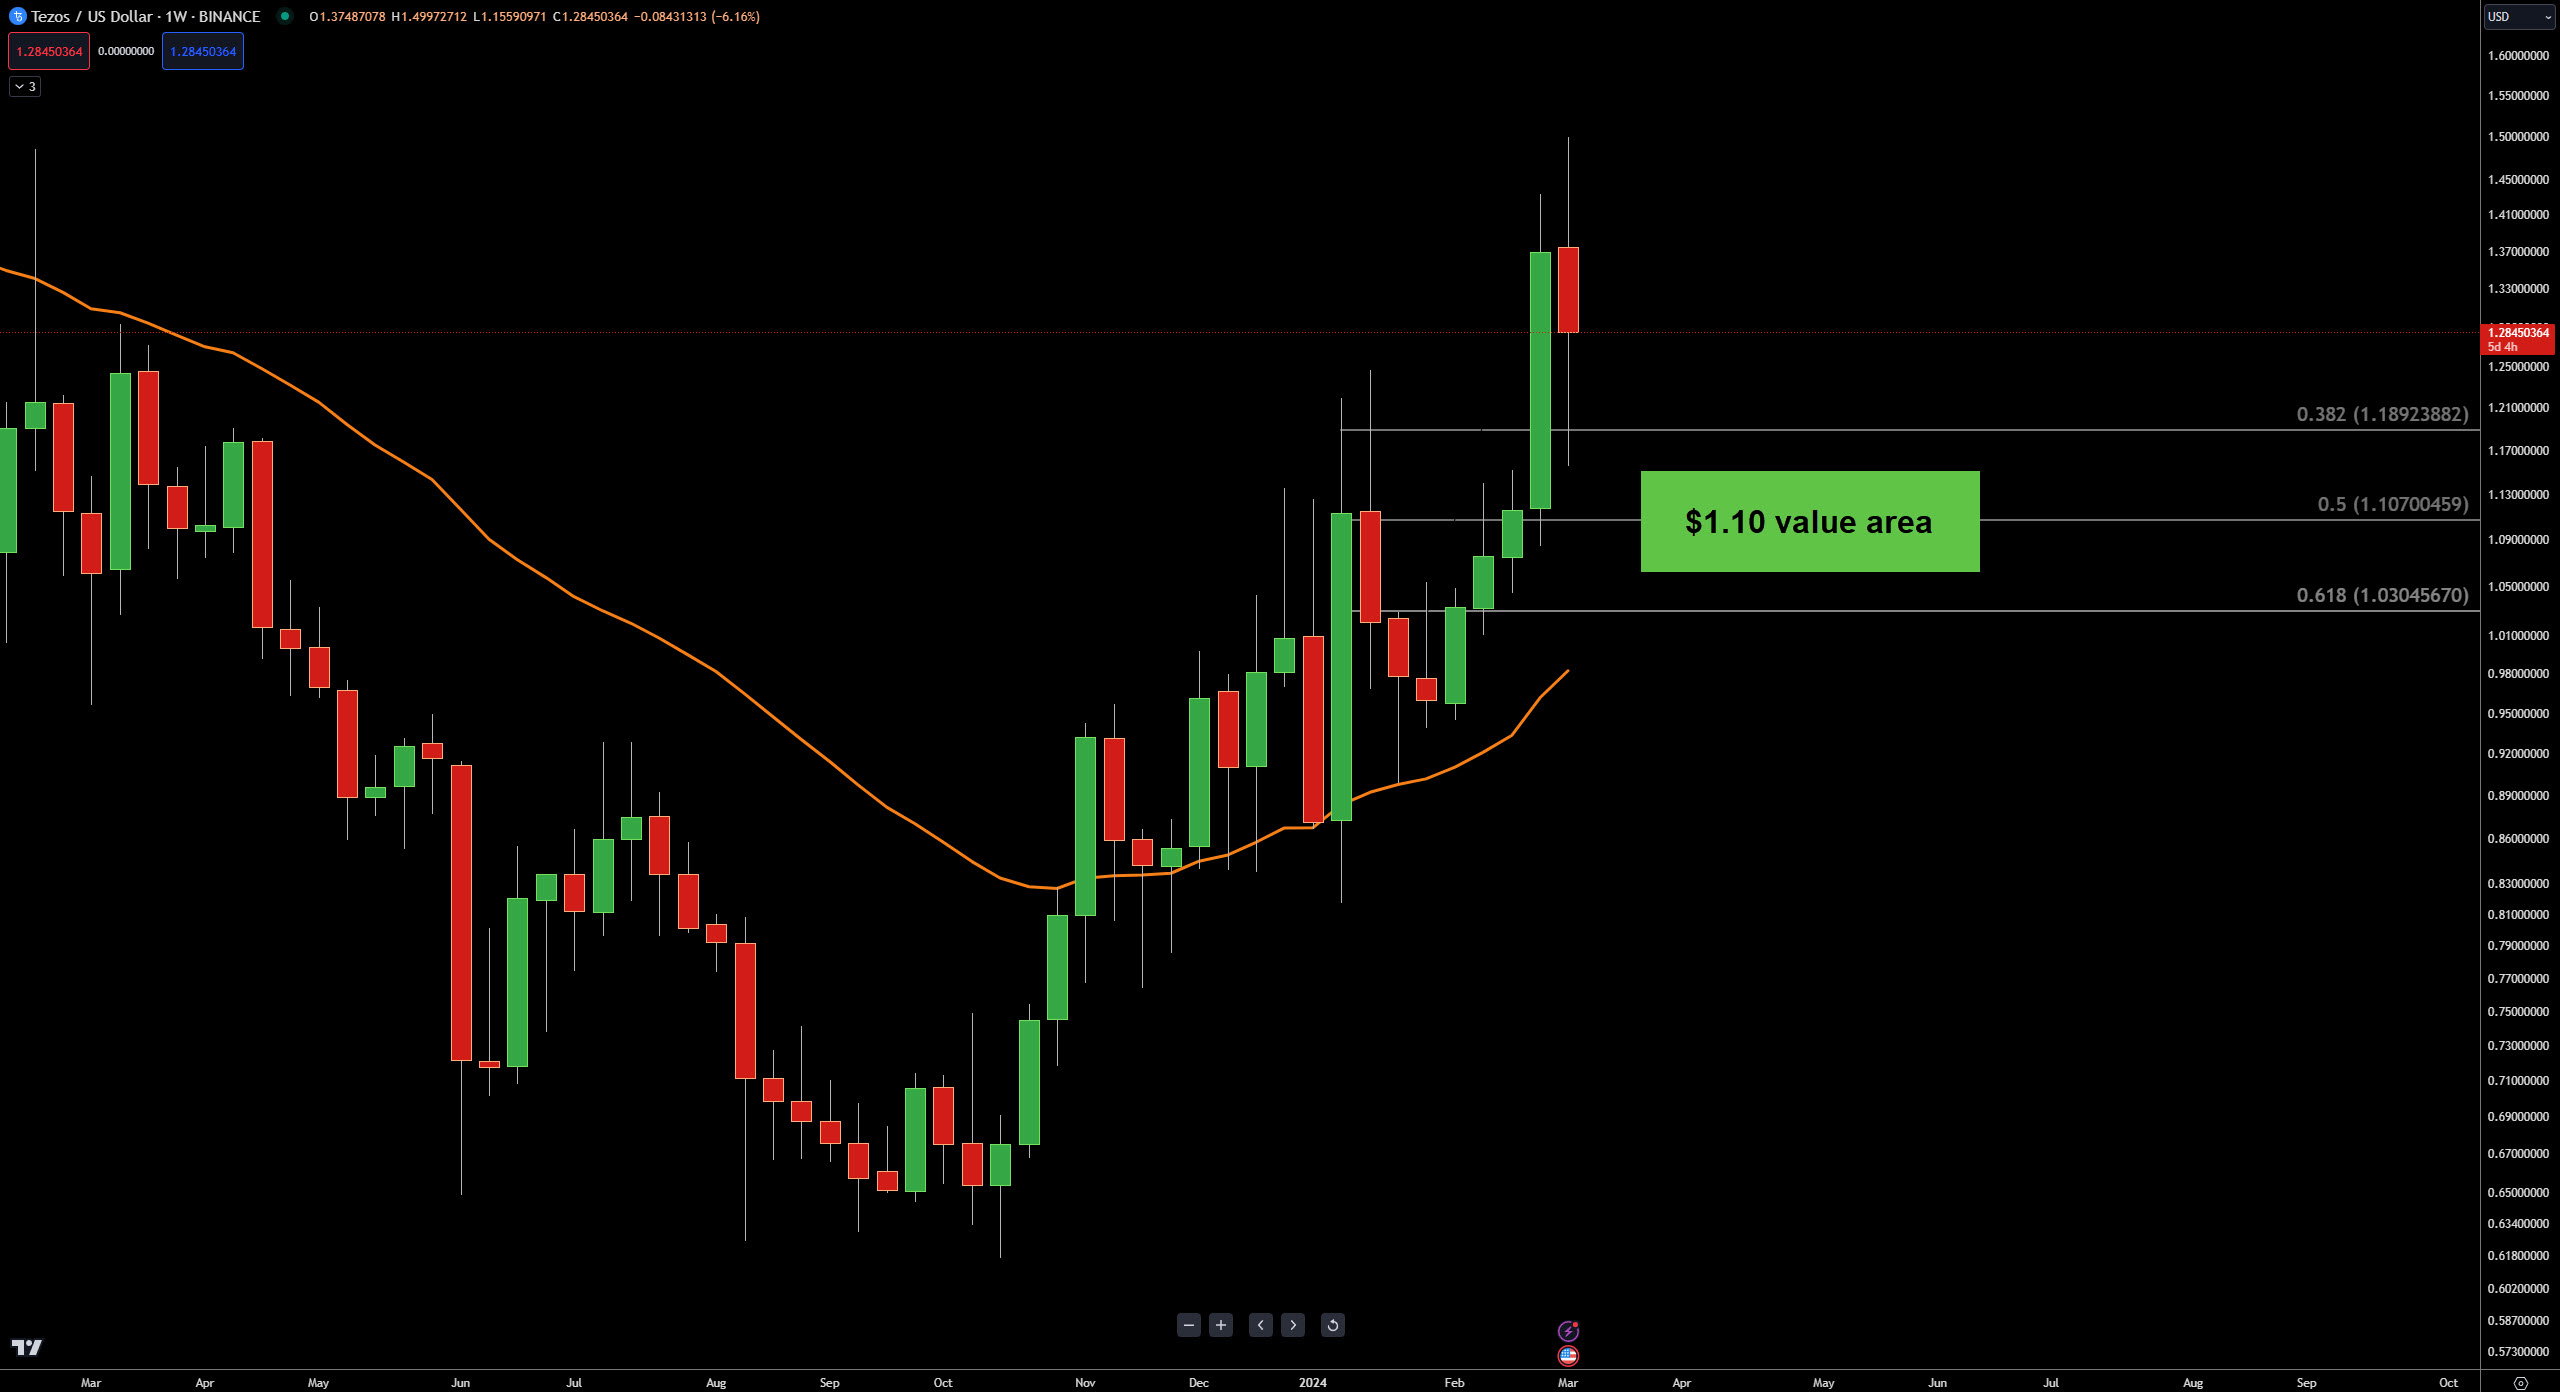
You know, this price action is pretty damn crazy. As I was typing this: I’ll make this simepl: the 30-day moving average, well, that’s exactly what happened with $XTZ.
On the weekly chart, the 50% Fib retracement at $1.10 looks like an enticing spot for traders and analysts waiting for a deeper retracement.
Shiba Inu
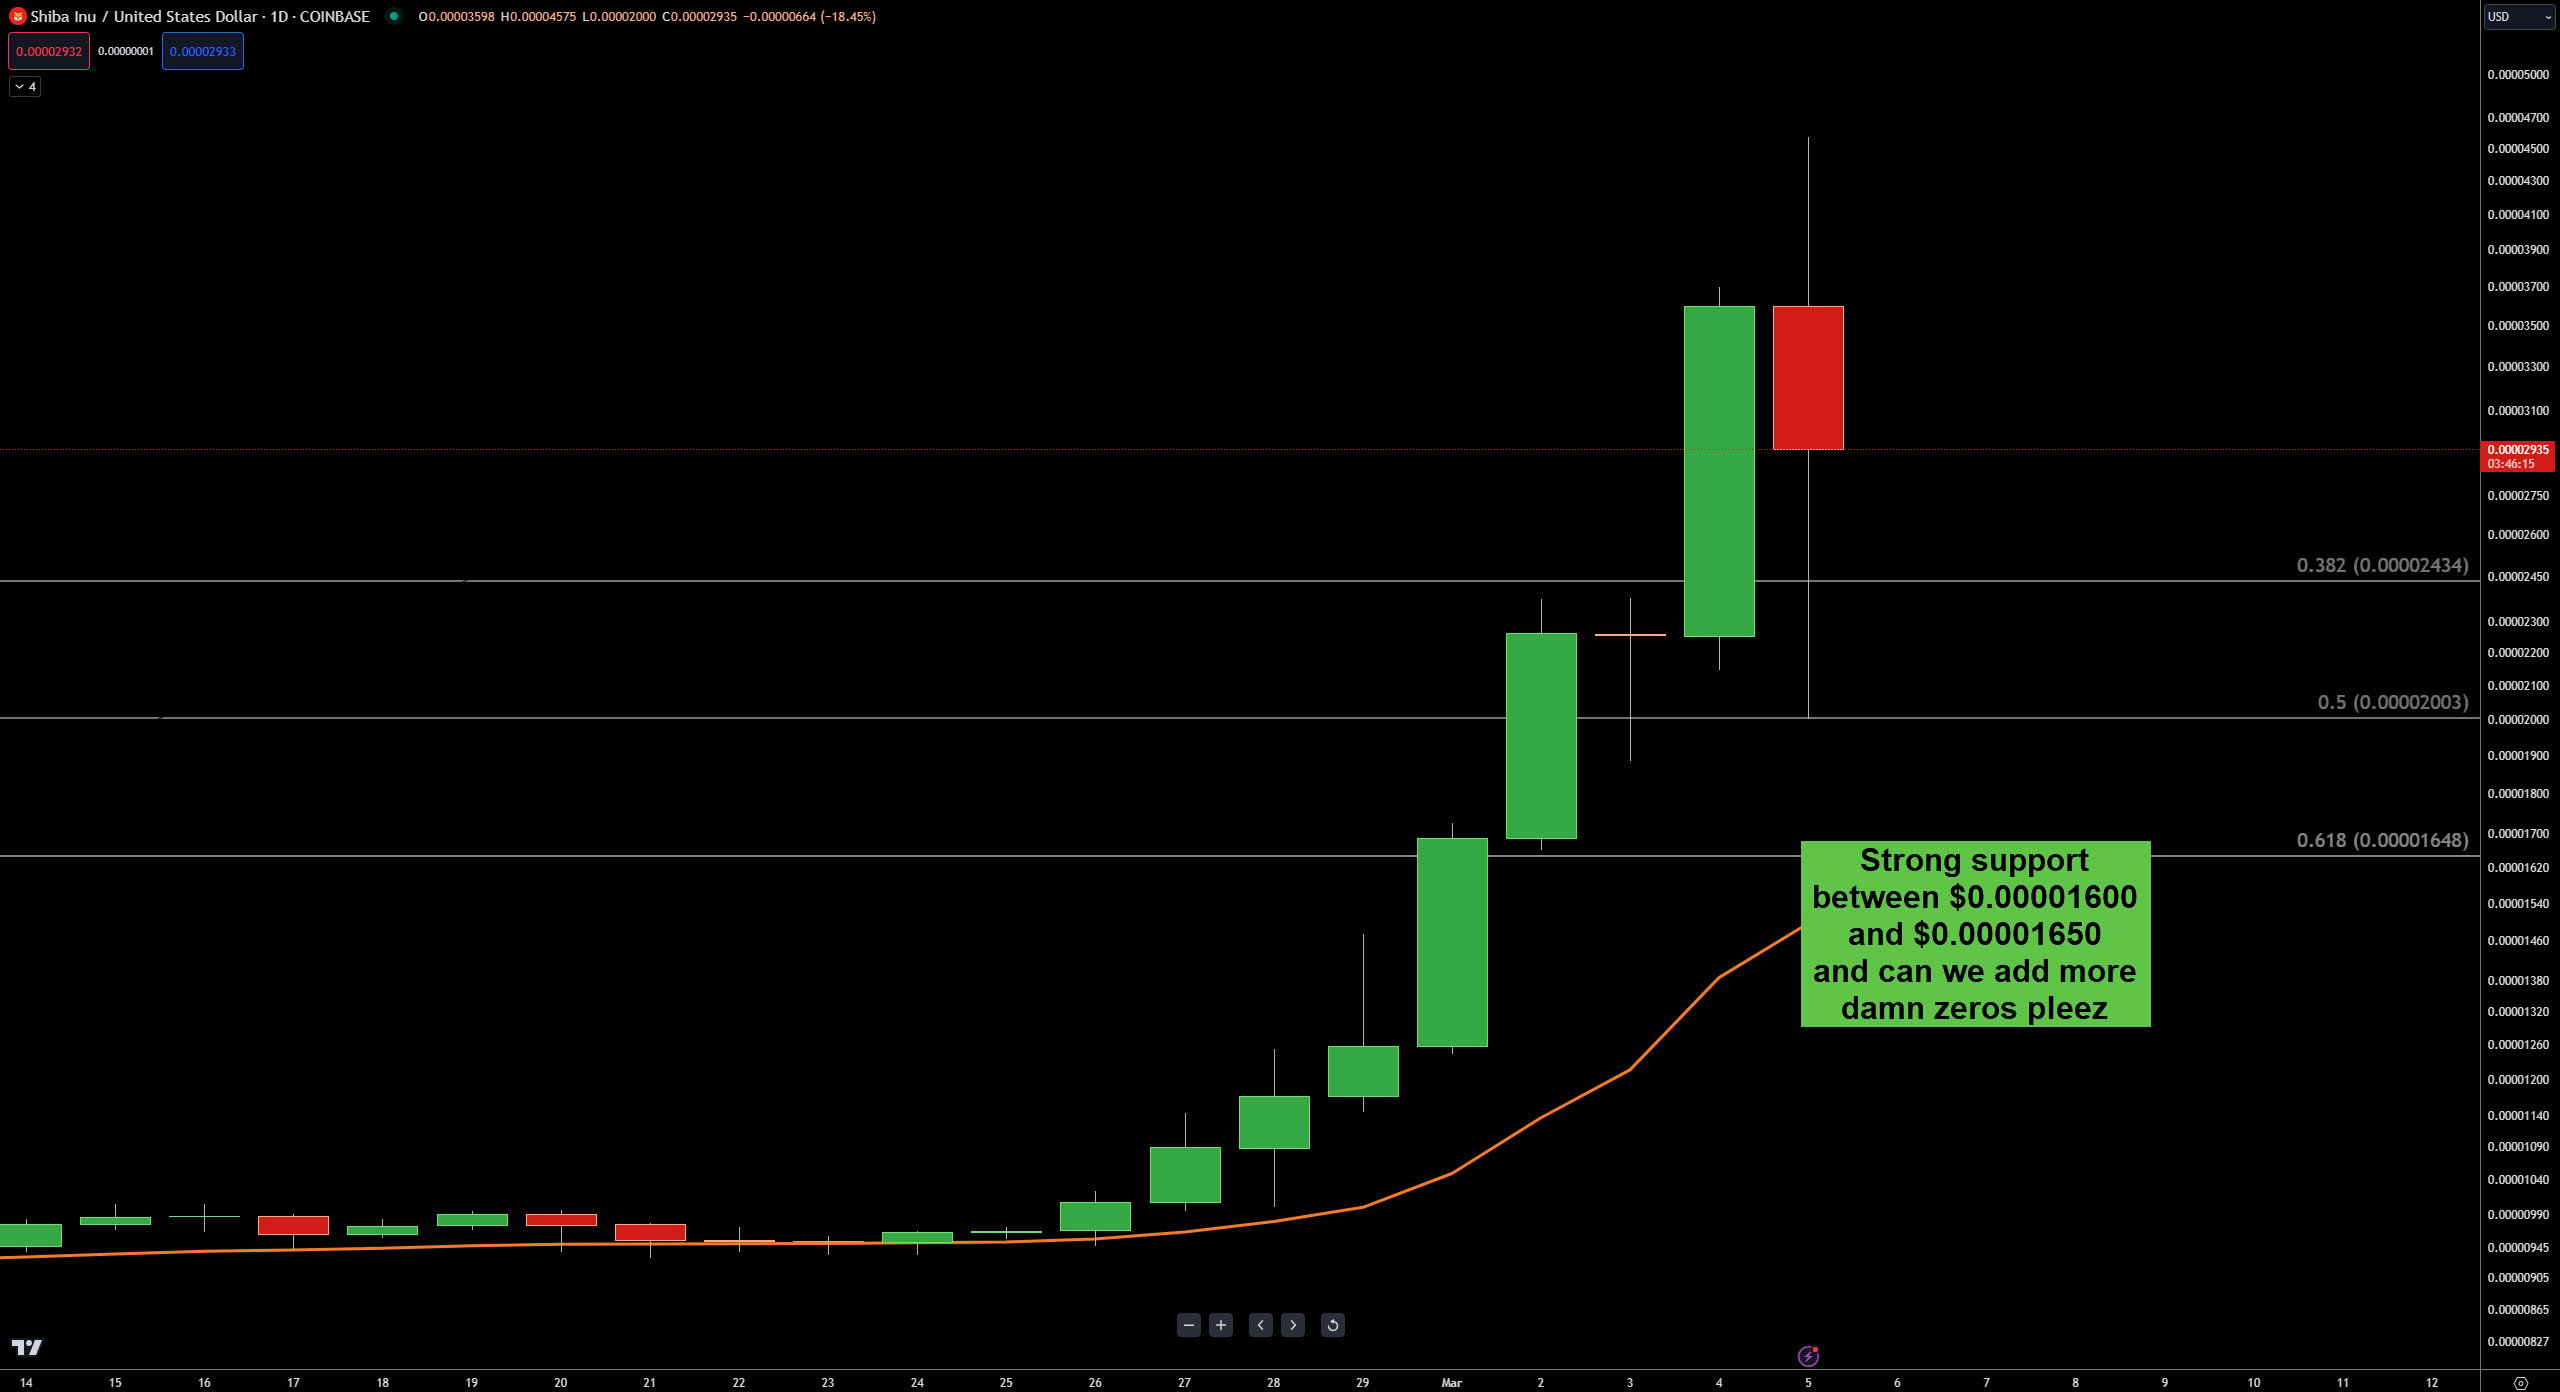
This daily candlestick should come with a warning label, good Lord the swings are wild today.
Well, $SHIB launched right off the 50% Fib retracement, so that’s cool. Below that, we’re looking at the 61.8% Fib, and because the 30-week moving average will tick higher, the $0.00001600 to $0.00001650 looks strong.
Dogecoin
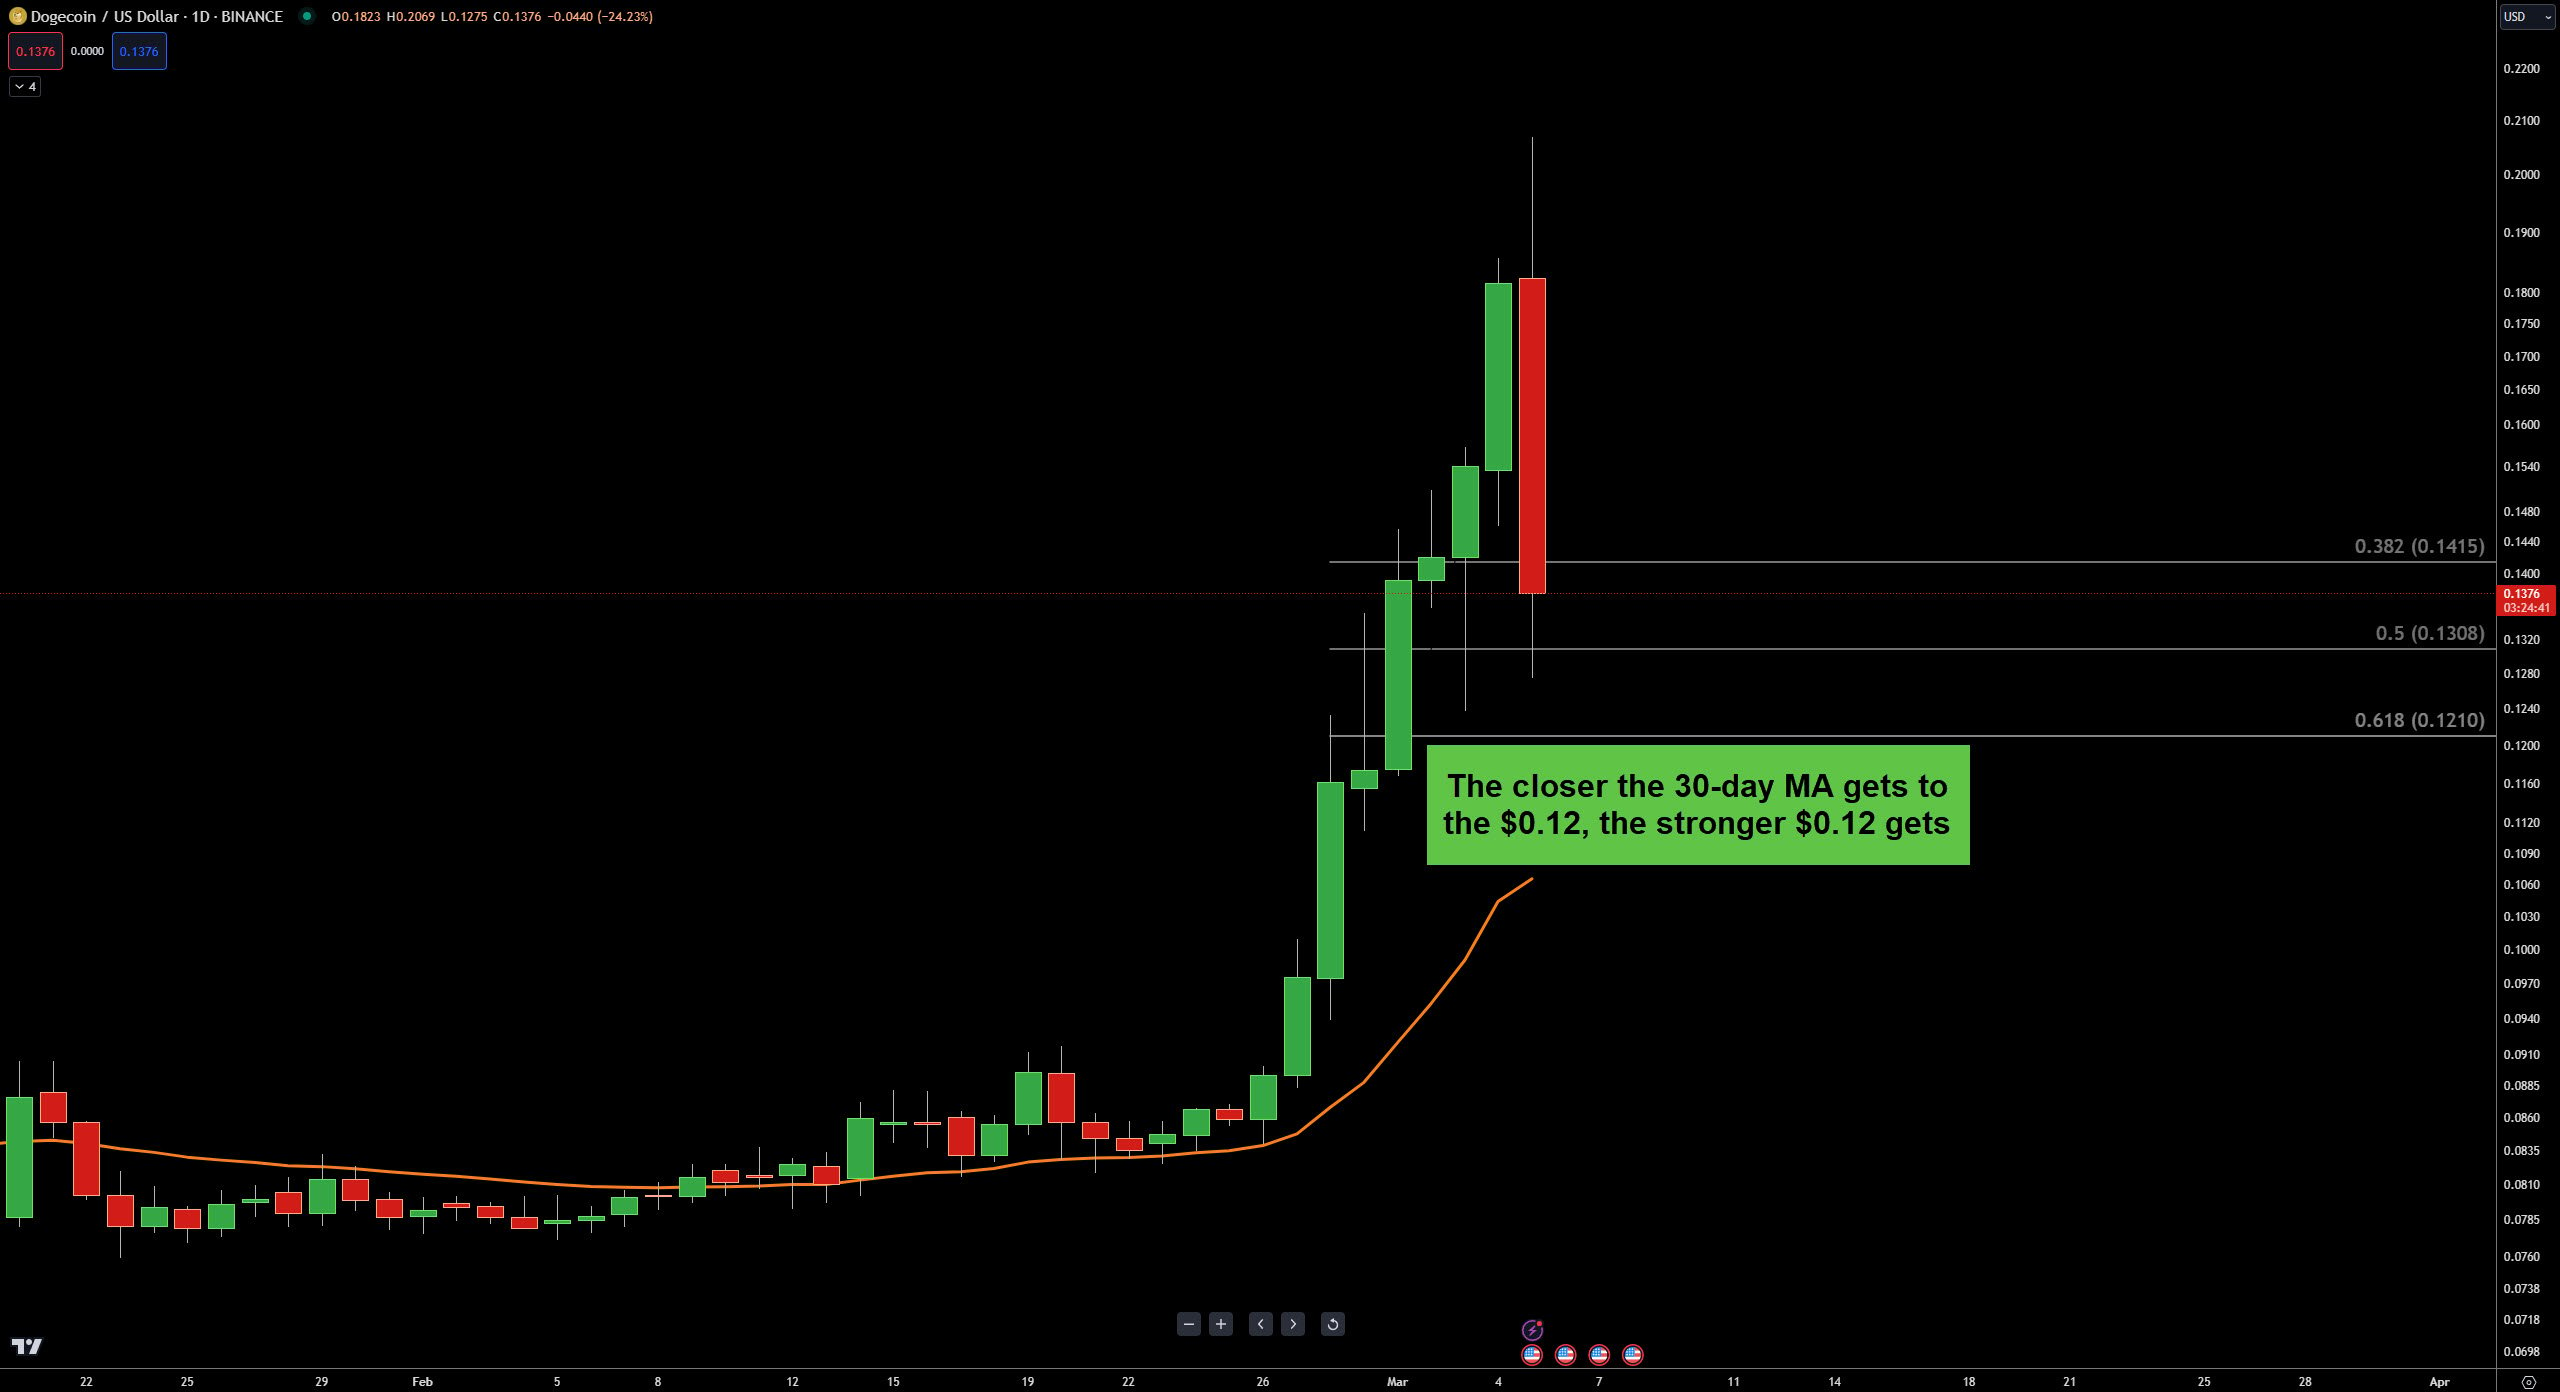
$DOGE army, don’t kill me. There’s extended, overbought, off in la-la-land, and then there’s whatever DOGE’s chart looks like (in fact, $FLOKI, $BONK, and all the others fall into this, too).
If the 50% Fib doesn’t hold, then there’s an ugly space between the 61.8% at $0.1210 and the 30-day moving average at $0.1069.
Links
Links That Don’t Suck:
🪙 Bitcoin returned to all-time high faster than ever before (almost)
📒 Ledger senior executive explains the reasons for the recent big rally in Bitcoin
👨⚖️ US Supreme Court case could change crypto industry regulation
🧱 BRICS announces new blockchain-based crypto payment system
⚒️ ‘Playing politics to win’: crypto spends big on Super Tuesday
Say Hello
💻 Questions? Comments? Email Jon at jmorgan@stocktwits.com 💻