Advertisement|Remove ads.
SBI Shares Poised For Next Leg Of Rally: SEBI Analyst Sees 15–20% Upside By Diwali 2026

- The lender posted a 22% YoY rise in Q2 profit, with strong loan growth and steady margins.
- Technical charts signal strength and a bullish breakout ahead.
- Analyst sees the stock breaking past ₹1,000 in the next 12 months amid PSU bank re-rating.
Advertisement|Remove ads.
State Bank of India’s Q2 earnings reaffirmed its position as the bellwether of India’s PSU banking revival. Earnings showed strong growth in operating profit and stable net interest income (NII). Net profit grew by 22% year-on-year (YoY), driven by loan growth and lower provisions. At the same time, Net Interest Margin (NIM) remained stable at around 3.3% with steady yield improvement on advances.
The country’s largest lender reported that Gross non-performing assets (NPAs) have been reduced to 2.85%, and net NPAs have decreased to 0.65%, which is among the best in PSU peers. The Capital Adequacy Ratio (CAR) is around 14.5%, showing a strong capital position.
SEBI-registered analyst Deepak Pal noted that the retail and SME portfolios are growing faster than the corporate book, improving balance sheet granularity.
Advertisement|Remove ads.
Subsidiary Performance
SBI Life, SBI Cards, and SBI Mutual Fund continue to add significant profits to the consolidated entity. These subsidiaries not only enhance earnings visibility but also strengthen brand value.
Valuation Picture
Pal highlighted that at the current level, SBI trades at 1.6x FY26E book value, still undervalued compared to private banks like HDFC Bank (2.3x) and ICICI Bank (2.0x). With consistent earnings growth and dividend yield (2%), SBI remains a strong value and growth play combined.
Advertisement|Remove ads.
Technical View
On the weekly and monthly charts, SBI stock has shown remarkable strength. It has broken out above the ₹740–₹760 zone, which acted as long-term resistance for nearly 8 months. And has sustained trading above major moving averages: 20-week, 50-week Exponential Moving Averages (EMAs) and 200-day moving average (DMA).
The Relative Strength Index at 68 indicated healthy bullish strength without overbought stress, while the Moving Average Convergence Divergence (MACD) showed positive crossover, confirming continuation of the uptrend.
Pal noted that rising volume during upswings indicates strong institutional participation. Additionally, the formation of a “bullish flag” and “cup & handle” pattern on higher timeframes, both of which are continuation patterns, suggests a further breakout toward ₹1,000+.
Advertisement|Remove ads.
He identified support at ₹800 and ₹770, with resistance on the upside at ₹900, ₹950, ₹1,000, and ₹1,050. Pal said that the higher high, higher low sequence is intact for SBI.
PSU banks have entered a re-rating phase after decades of underperformance due to improved balance sheets and profitability. And SBI’s leadership in digital transactions and retail credit through the YONO app positions it ahead of PSU peers. Pal believes that RBI’s likely rate cuts in mid-2026 could improve credit growth and reduce funding costs, benefiting large lenders like SBI.
Key Triggers To Watch
He advised traders to monitor the subsequent results report for Q3 & Q4, which is likely to show steady profit growth and improving margins. However, any delay in the rate-cut cycle may keep margins under mild pressure.
Advertisement|Remove ads.
A possible listing or stake monetization in SBI Mutual Fund or SBI General Insurance is likely over the next year. Beyond this, the government’s capex push, revival of rural demand, and return of FII inflows in the banking space will augur well for SBI, according to Pal.
Trading Outlook
According to Pal, with these strong fundamentals, favorable macro trends, improving credit growth, and a bullish technical setup, SBI looks well-positioned to deliver a 15–20% return in the next 12 months. His analysis suggests that from this Muhurat (Diwali 2025) to next Muhurat (Diwali 2026), SBI could touch ₹1,000–₹1,050 levels, supported by steady earnings growth, PSU re-rating, and institutional buying.
Expected Range: ₹770 – ₹1,050
Advertisement|Remove ads.
Target Price: ₹1,000+
Investment Horizon: 12 Months
View: Strong Bullish
Advertisement|Remove ads.
SBI: What Is Retail Mood On Stocktwits?
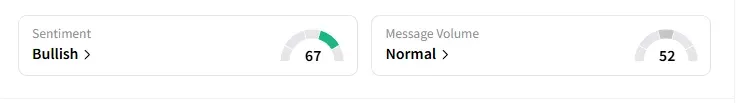
Data on Stocktwits showed that retail sentiment turned ‘bullish’ a day ago on this counter.
SBI shares have gained 14% year-to-date (YTD).
For updates and corrections, email newsroom[at]stocktwits[dot]com.
Advertisement|Remove ads.
Comments posted here will also appear on symbol pages.
Latest News
/filters:format(webp)https://news.stocktwits-cdn.com/large_Getty_Images_2118998147_7e5bba34cd.jpg)
/filters:format(webp)https://news.stocktwits-cdn.com/Anushka_Basu_make_me_smile_in_the_picture_b92832aa_af59_4141_aacc_4180d2241ba8_1_2_png_1086e0ed8c.webp) Anushka Basu·32m ago
Anushka Basu·32m ago/filters:format(webp)https://news.stocktwits-cdn.com/large_morgan_stanley_bitcoin_jpg_6c2c7ffcd9.webp) Anushka Basu·1h ago
Anushka Basu·1h ago/filters:format(webp)https://news.stocktwits-cdn.com/large_Getty_Images_1239844531_jpg_f460fa8bdb.webp) Anushka Basu·3h ago
Anushka Basu·3h ago/filters:format(webp)https://news.stocktwits-cdn.com/large_Getty_Images_1407197934_3a2e8235c9.jpg) Anushka Basu·19h ago
Anushka Basu·19h ago/filters:format(webp)https://news.stocktwits-cdn.com/large_Getty_Images_2197413796_2ae5f600f7.jpg) Anushka Basu·20h ago
Anushka Basu·20h ago/filters:format(webp)https://news.stocktwits-cdn.com/large_Getty_Images_2279969005_jpg_d203b64c52.webp) Anushka Basu·20h ago
Anushka Basu·20h ago