Technically Speaking – Bitcoin

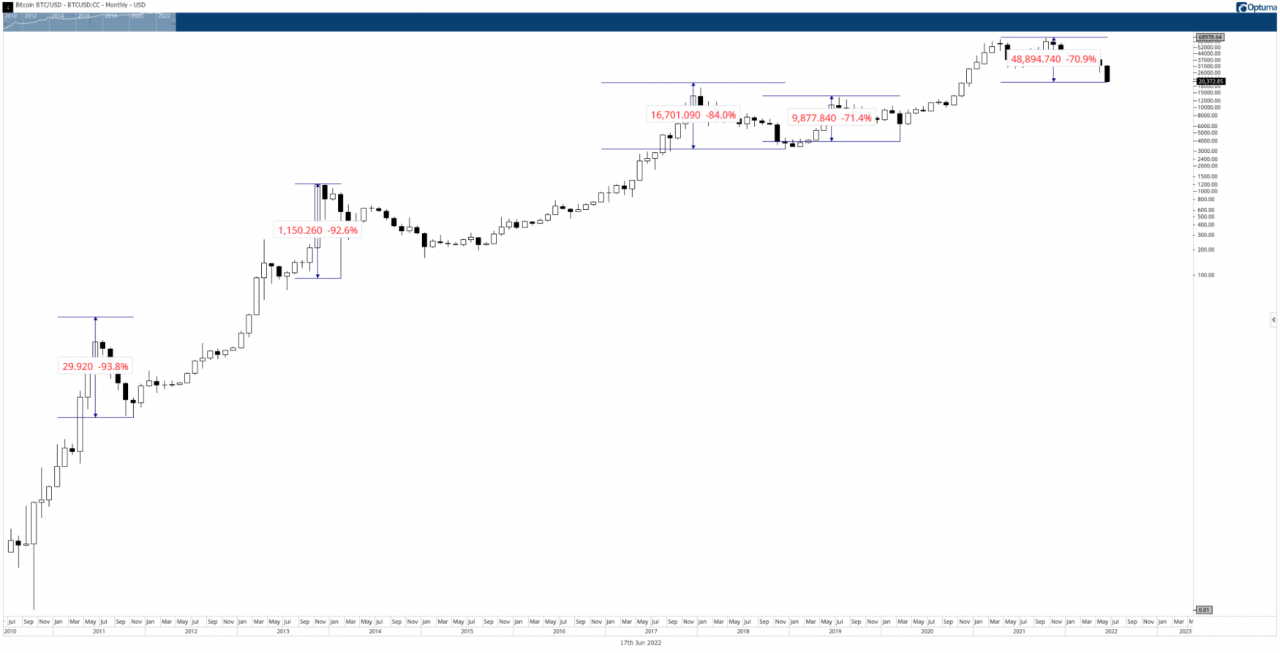
The chart image above is Bitcoin’s monthly chart. The five largest drops in Bitcoin’s history are:

June 2011 – November 2011: -94%
November 2013 – February 2014: -93%
December 2017 – January 2018: -84%
June 2019 – March 2020: -71% (Covid Crash)
Oct 2021 – present (June 2022): -71%

A collection of time cycles and other indicators point to extreme oversold conditions and a highly probable bounce soon. If history repeats itself, then Bitcoin and the broader crypto market may experience a mean reversion higher or the beginning of a wider trend change. Either way, the move higher will likely be crazy.

More in   Crypto

View All

Technically Speaking – March 5, 2024

Well, like I said, this isn’t a fun Litepaper. Instead of finding wen-Moon or wen-Lambo, we will be looking for wen-bottom. 💔

I’ll keep it short and sweet, quickly identifying where analysts and traders see strong support levels ahead.

Read It

Technically Speaking – March 8, 2024

I’ll keep the details short and simple here because time is running out, and if I’m not done on time for pizza night with the kids, my wife will be very mad. 🍕

I almost wrote she’d kill me, but if I did that, there’d probably be a SWAT team and an army of social workers making sure I’m ok.

Read It

NFTs R Back?

Not much needs to be said here for this newsworthy event. 🤦‍♂️

Straight from the Gurg himself:

Read It