Well, like I said, this isn’t a fun Litepaper. Instead of finding wen-Moon or wen-Lambo, we will be looking for wen-bottom. 💔
I’ll keep it short and sweet, quickly identifying where analysts and traders see strong support levels ahead.
Real quick: Last Friday’s Litepaper discussed in detail the warnings about today’s selling pressure using time cycle magic 8 ball 1-800-MISS-CLEO voodoo chicken bone analysis. You should give a read through.
Cardano
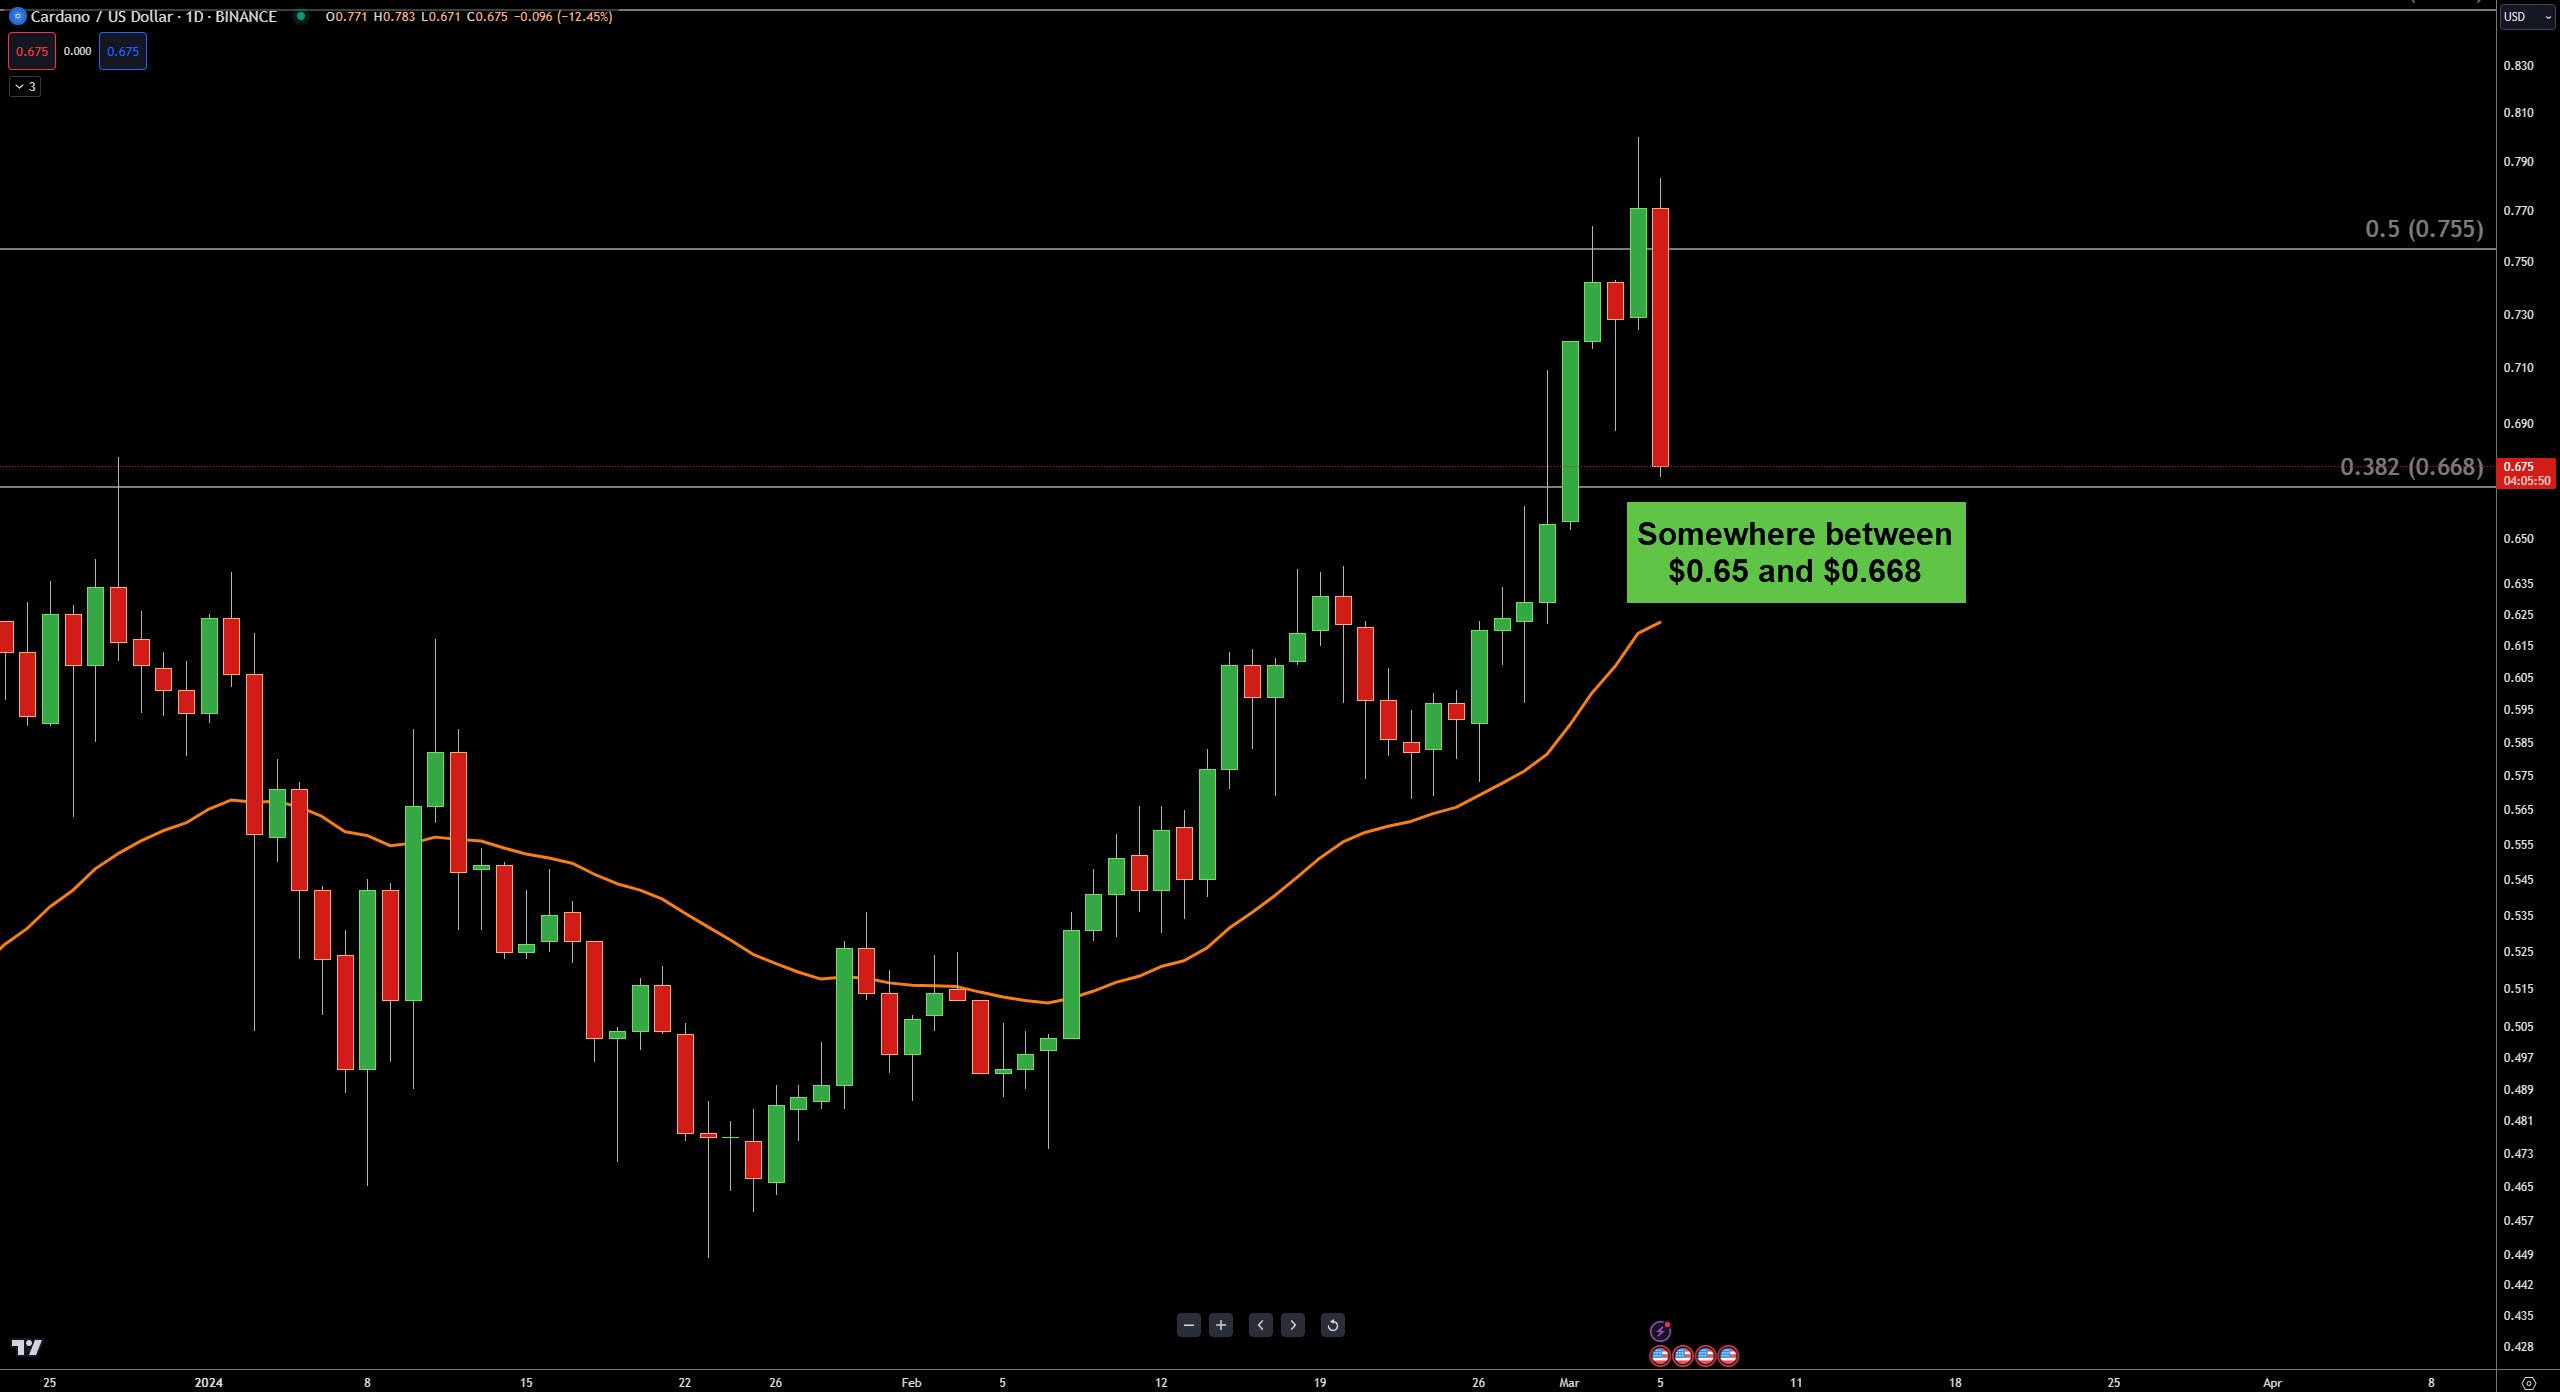
On the daily, between 30-day moving average and the 38.2% Fibonacci retracement is the first support zone. On the weekly (not shown), it’s looking like the $0.55 value area for $ADA.
Tezos
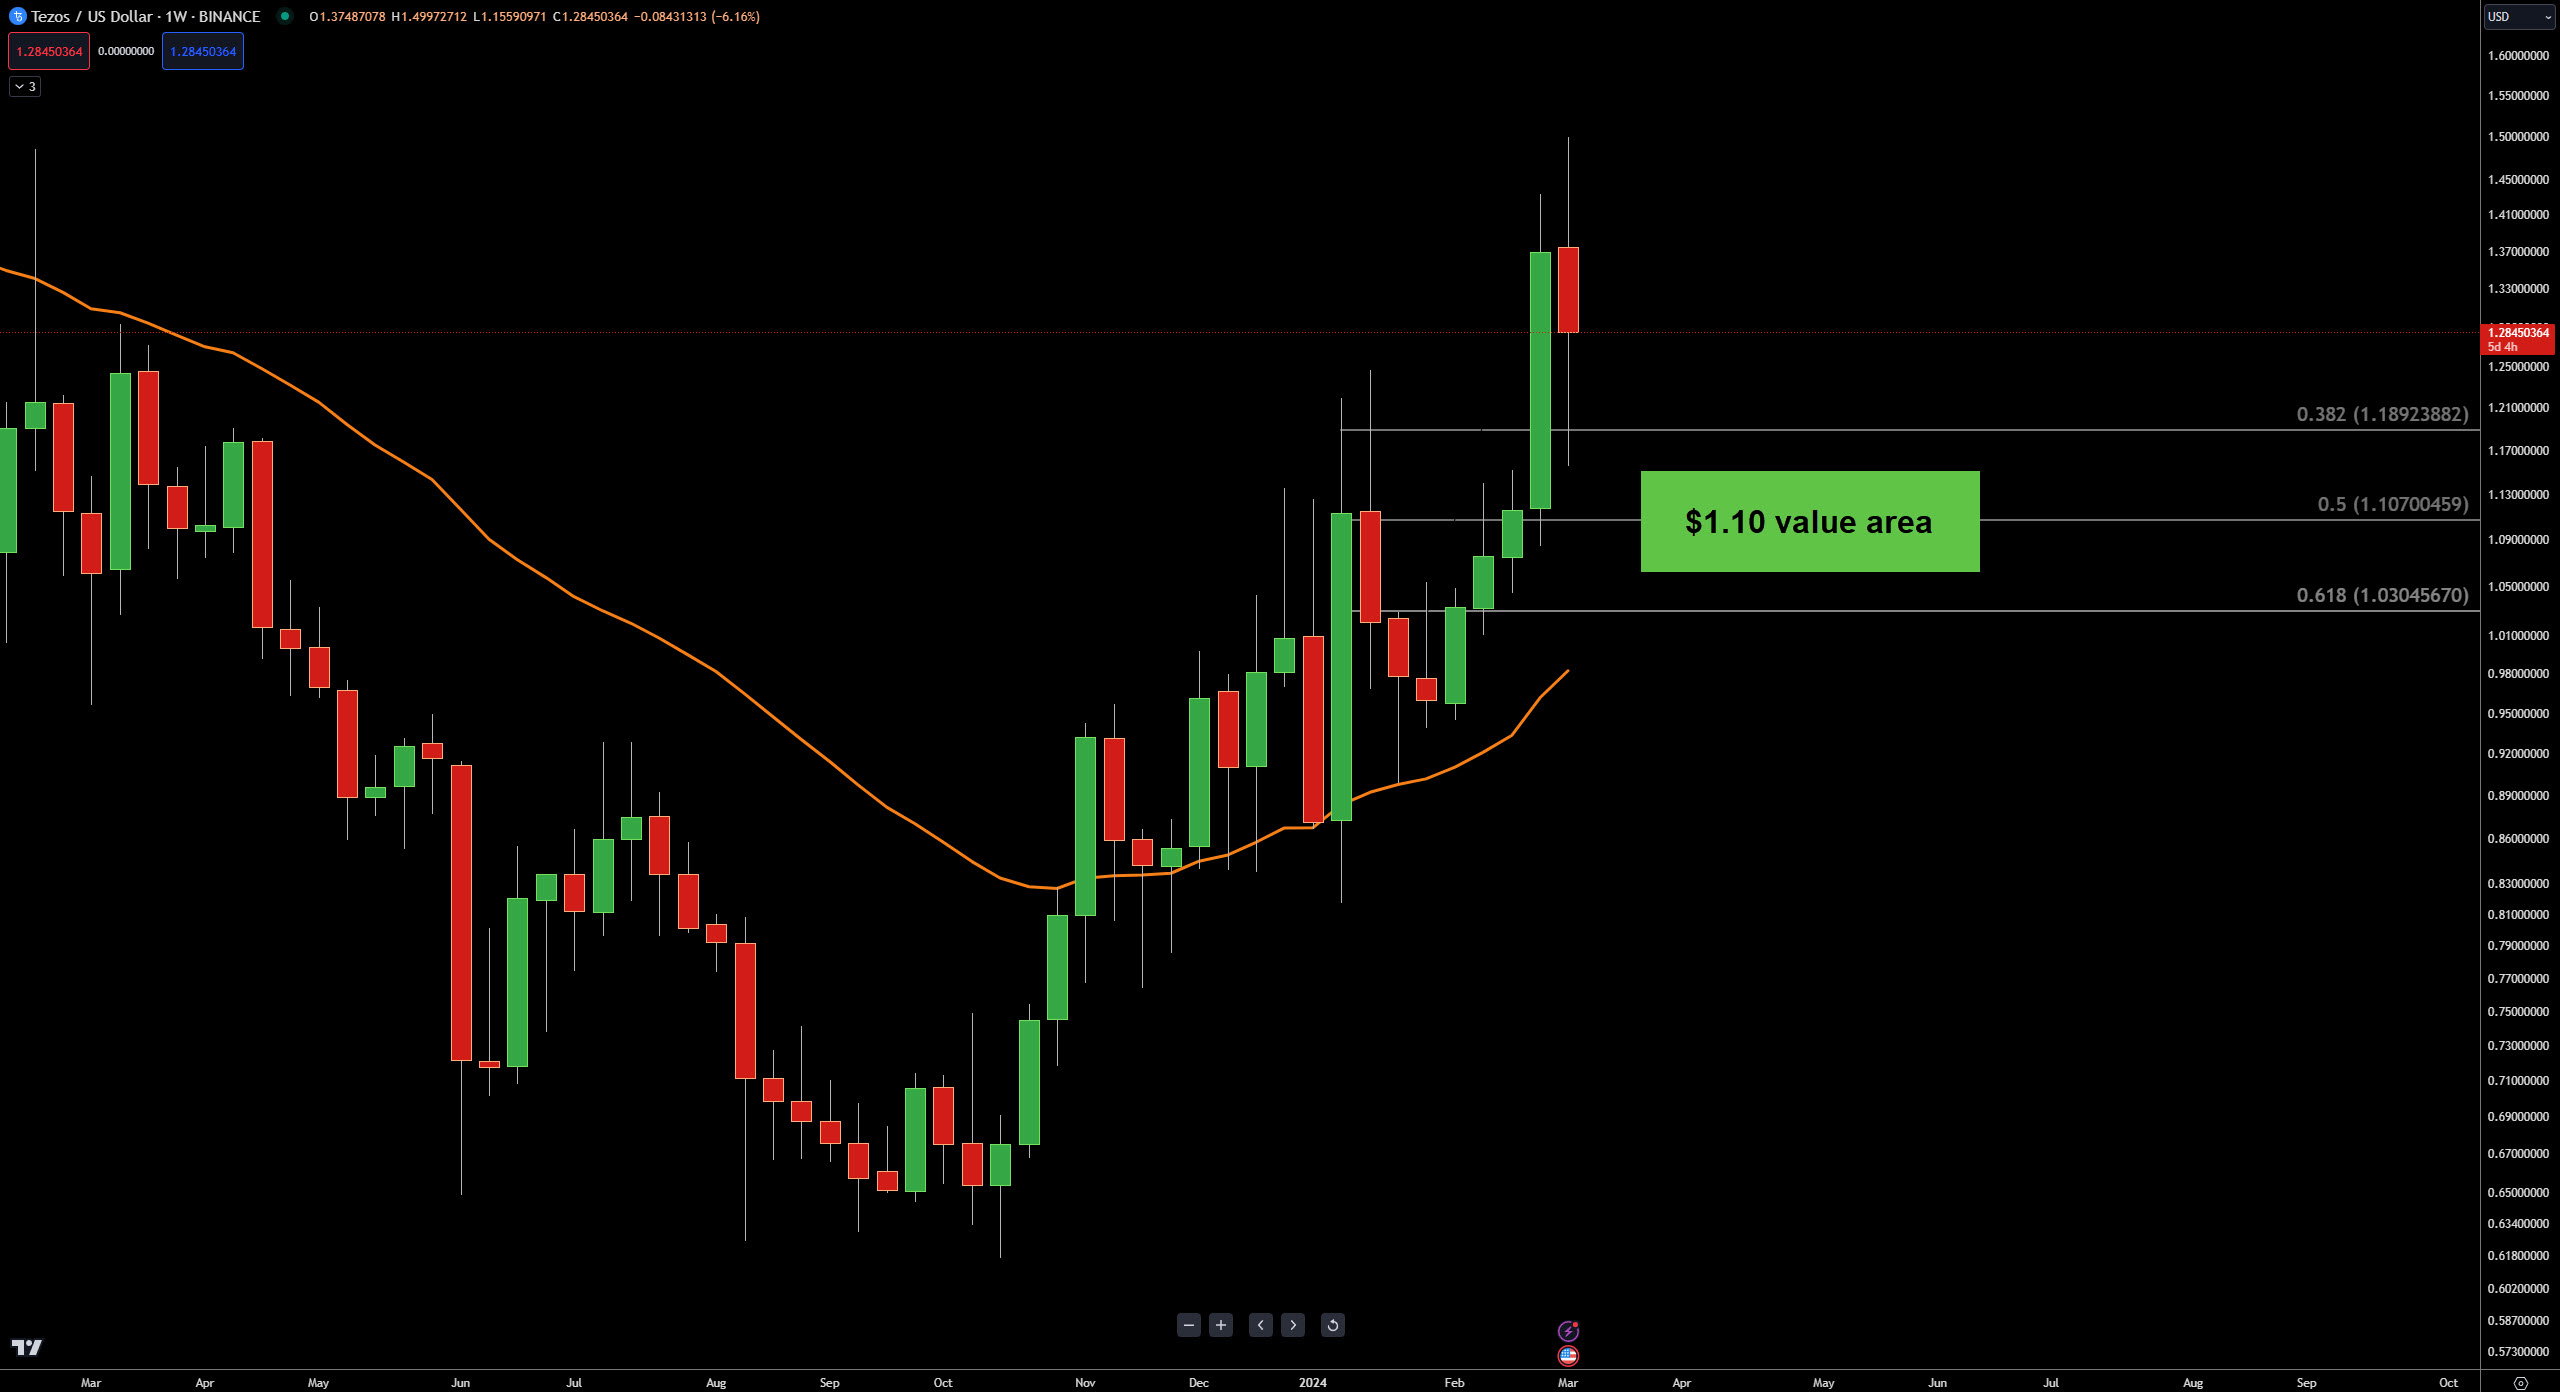
You know, this price action is pretty damn crazy. As I was typing this: I’ll make this simepl: the 30-day moving average, well, that’s exactly what happened with $XTZ.
On the weekly chart, the 50% Fib retracement at $1.10 looks like an enticing spot for traders and analysts waiting for a deeper retracement.
Shiba Inu
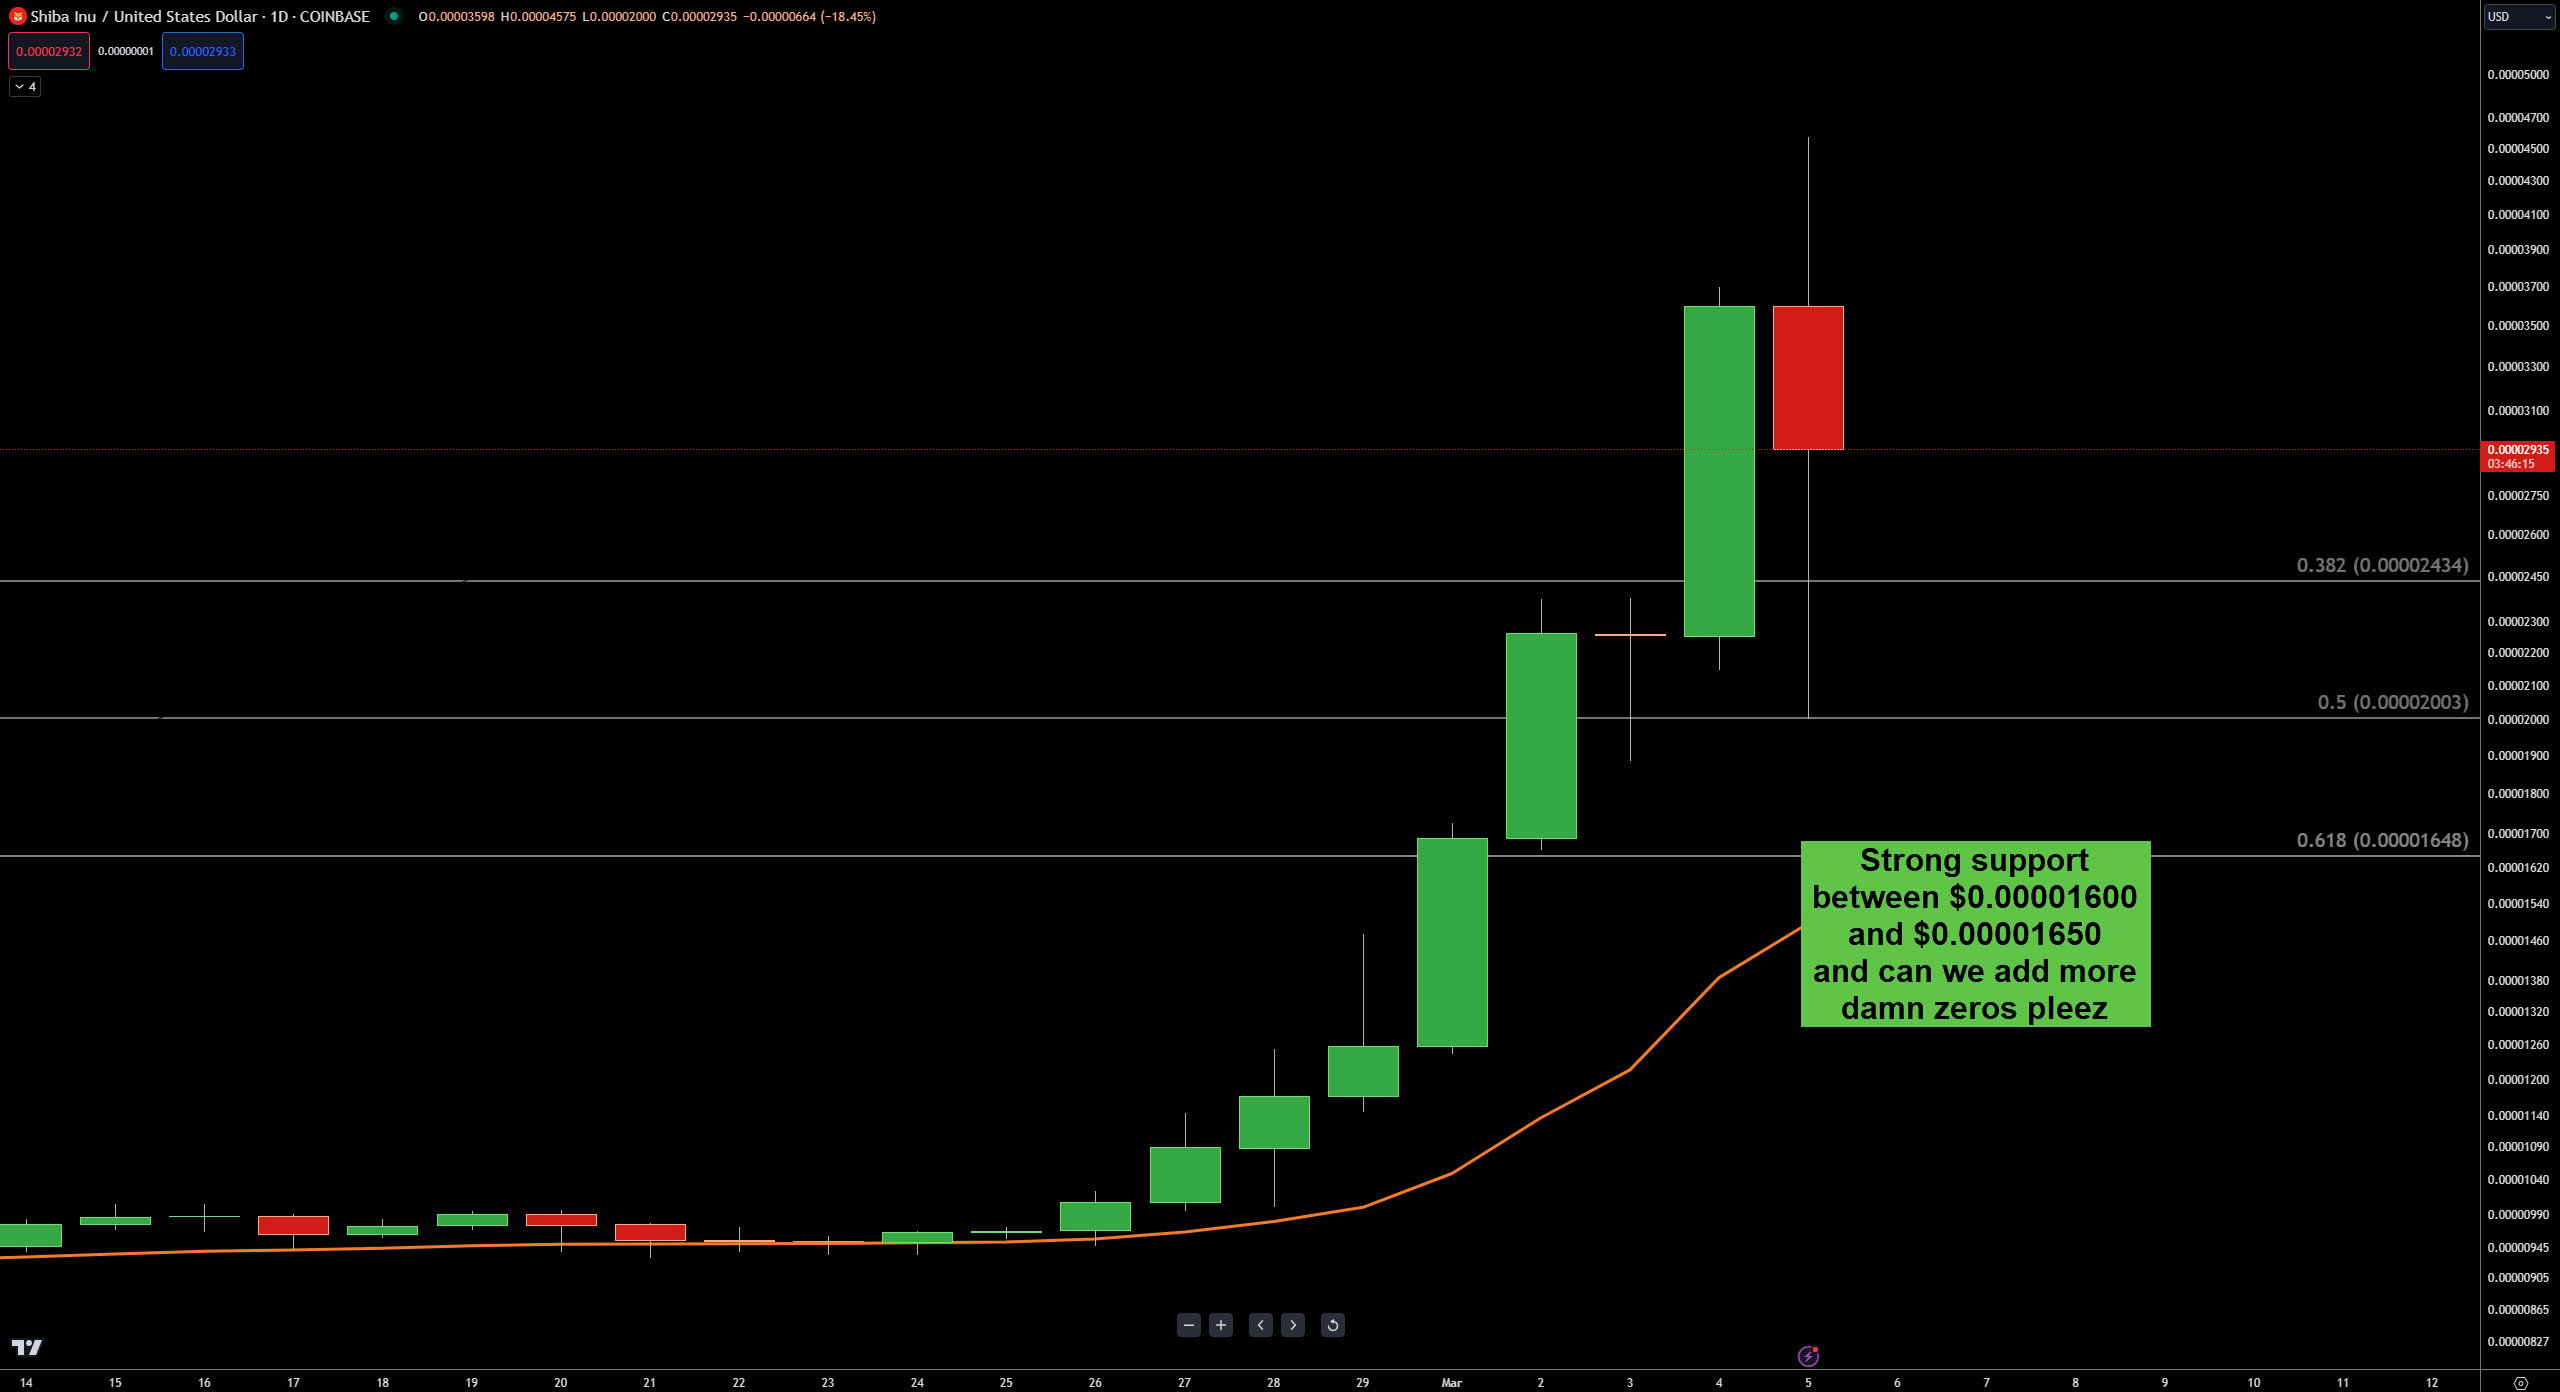
This daily candlestick should come with a warning label, good Lord the swings are wild today.
Well, $SHIB launched right off the 50% Fib retracement, so that’s cool. Below that, we’re looking at the 61.8% Fib, and because the 30-week moving average will tick higher, the $0.00001600 to $0.00001650 looks strong.
Dogecoin
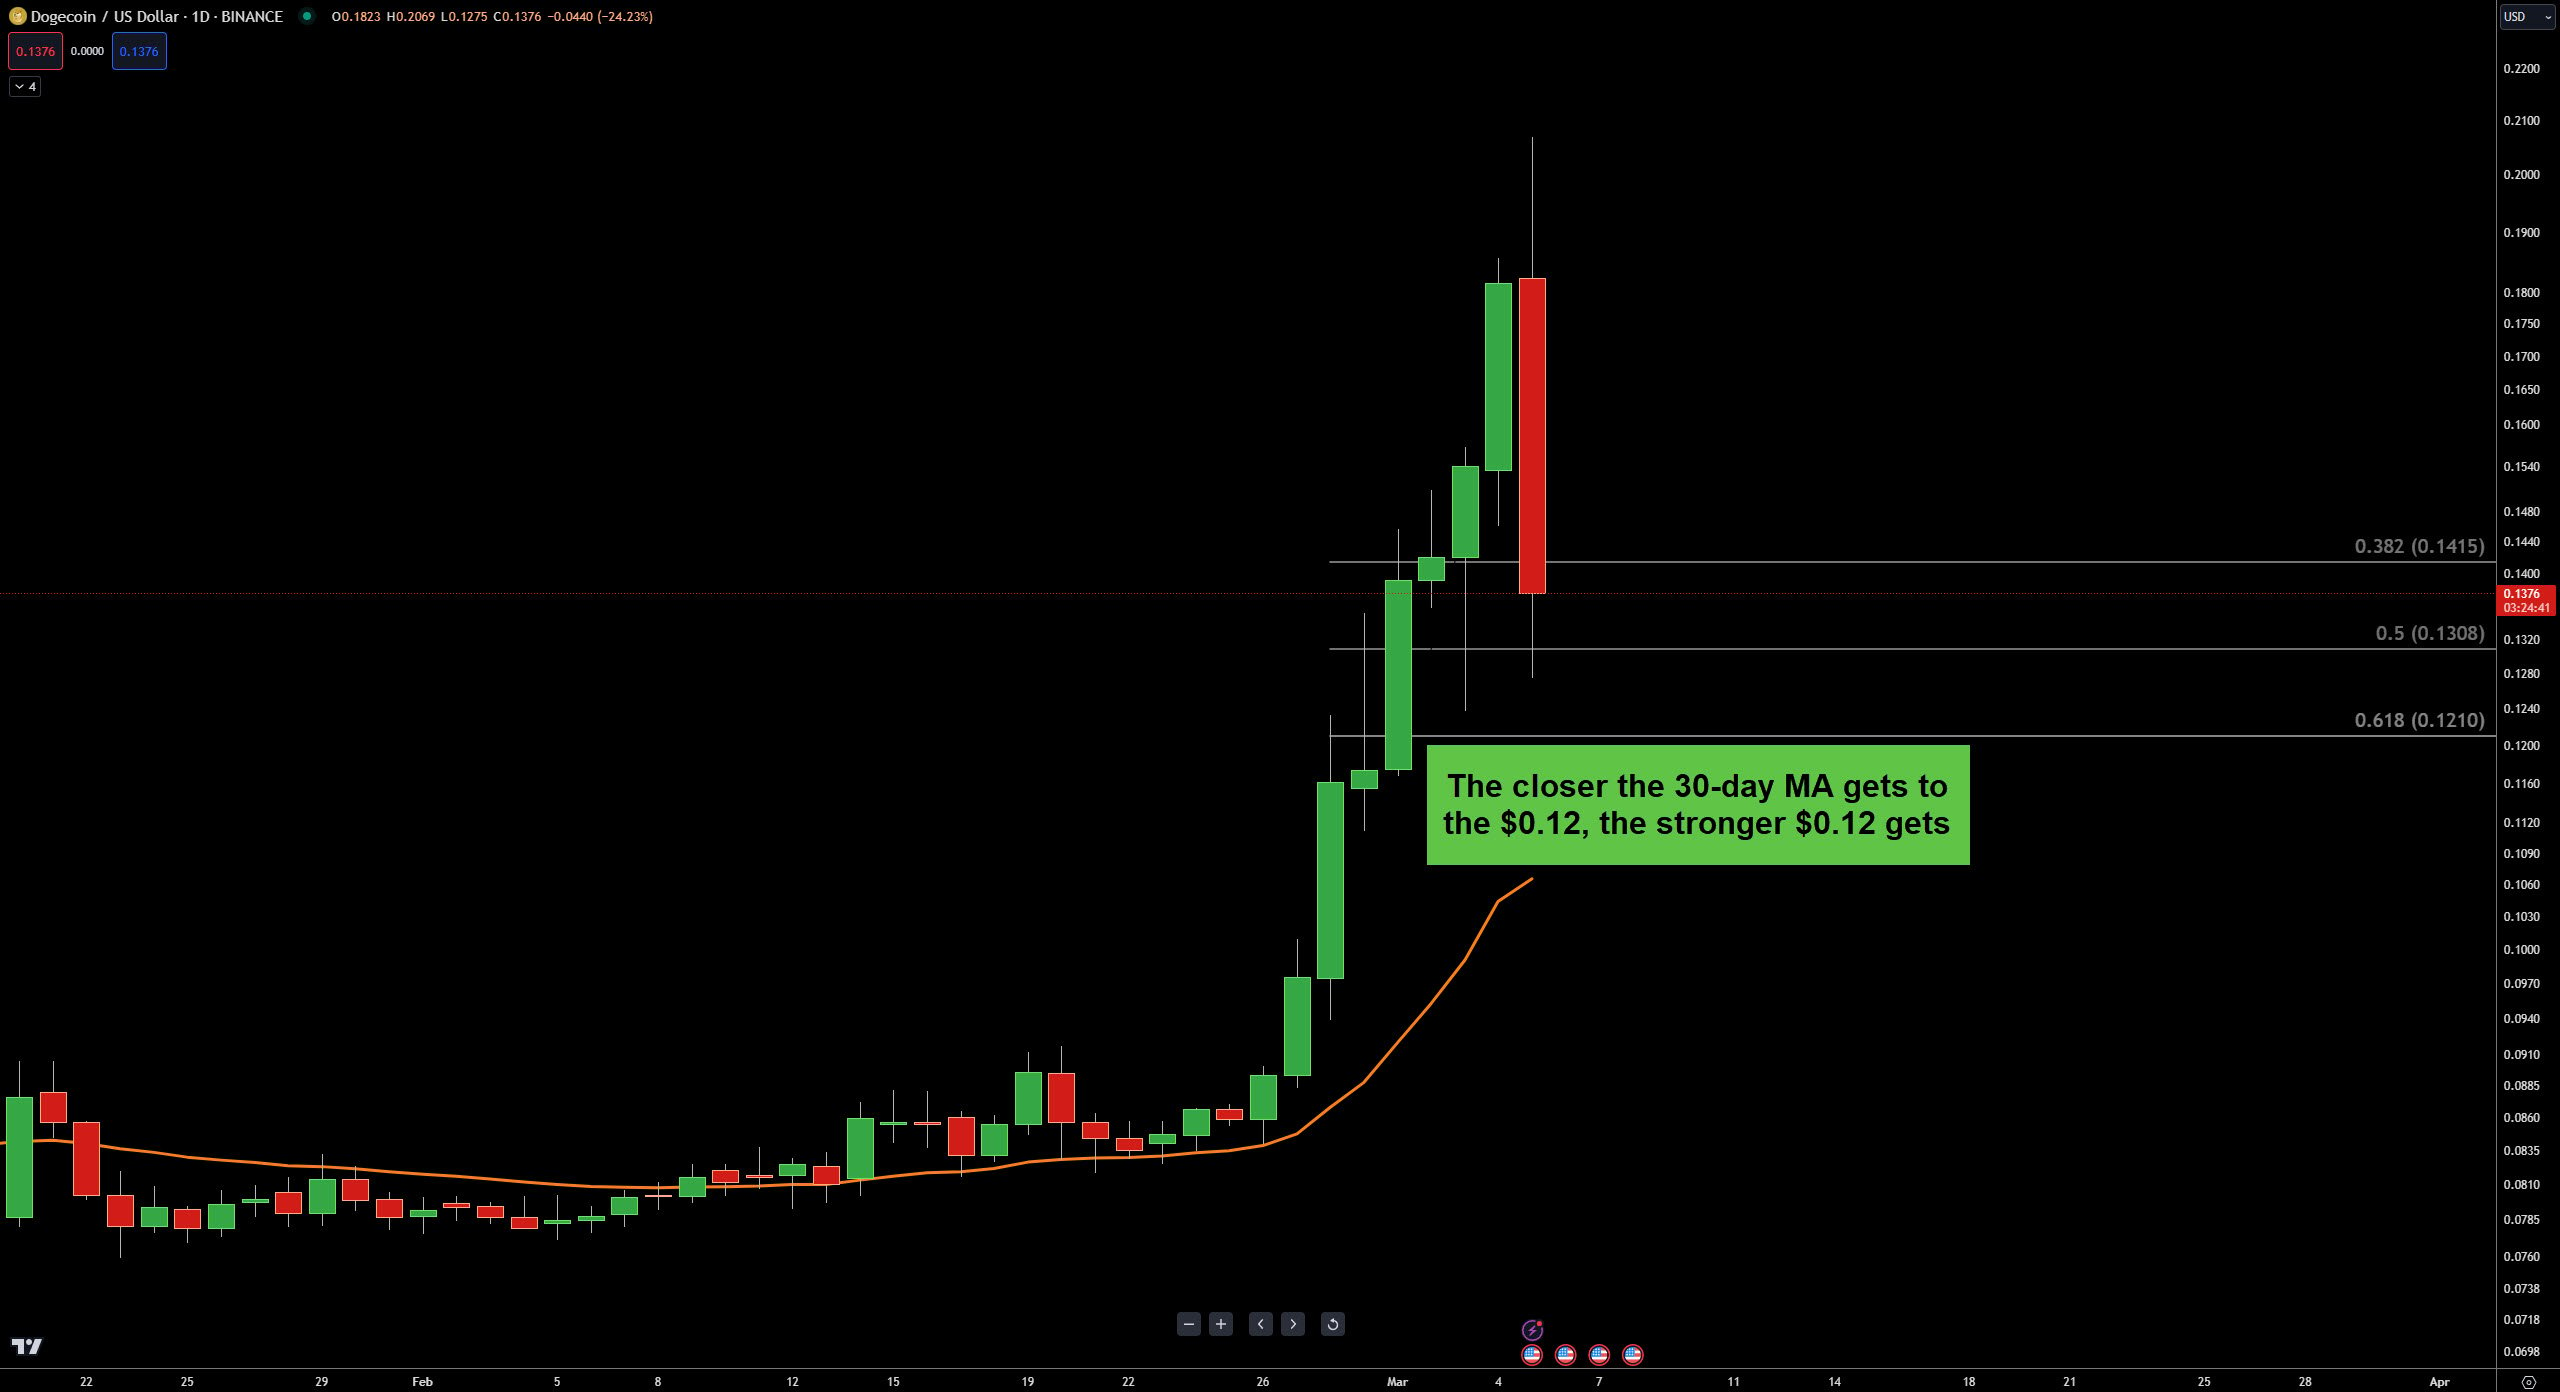
$DOGE army, don’t kill me. There’s extended, overbought, off in la-la-land, and then there’s whatever DOGE’s chart looks like (in fact, $FLOKI, $BONK, and all the others fall into this, too).
If the 50% Fib doesn’t hold, then there’s an ugly space between the 61.8% at $0.1210 and the 30-day moving average at $0.1069.