Lots of people want to know what Warren Buffet is buying and selling. Unfortunately, if we want to know what Berkshire Hathaway ($BRK.B) is up to, we must wait months. Cryptocurrencies don’t have that problem. Because of blockchain transparency, we get a live view of what big money is doing. That is done through a fancy schmancy method called ‘on-chain analytics’.
On-chain analysis looks at what kind of activity happens over a cryptocurrency’s blockchain. For example, we can monitor large Bitcoin ($BTC.X) wallets and see what leaves (outflows) those wallets and what enters (inflows). Likewise, we can watch cryptocurrency exchange wallets and record what crypto is moving into an exchange (inflow) or out (outflow).
Analysts interpret outflows from cryptocurrency exchanges as bullish because it reduces the supply available and, most importantly, crypto leaving exchanges often means people are hodling for long periods. Conversely, exchange inflows are interpreted as bearish because selling usually follows.
Inflows to non-exchange wallets, however, are considered bullish.
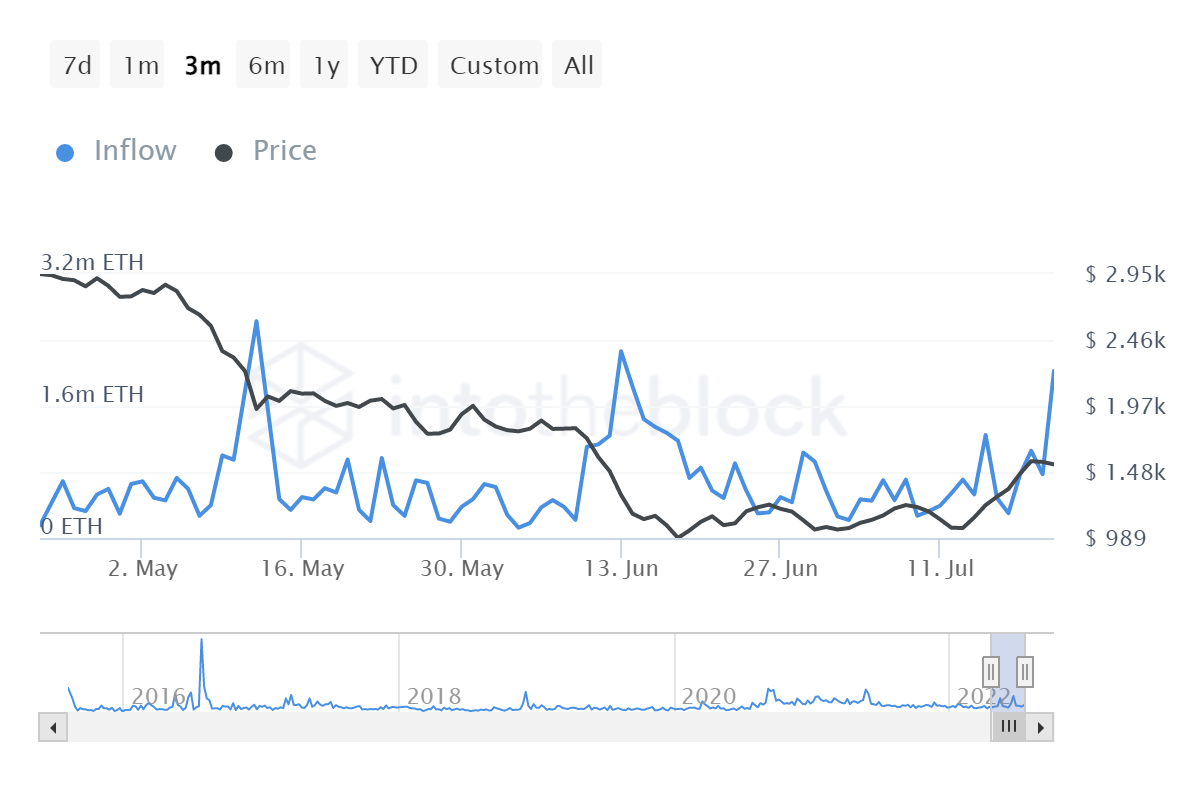
The image above is from the on-chain analytics service intotheblock. The graph displays Large Hodlers Inflows for Ethereum ($ETH.X). intotheblock considers a Large Hodler any wallet with >0.1% of the total ETH supply.
Because Large Hodler wallets hold so much of the available ETH, and those wallets often hold ETH for long periods, analysts interpret inflows to Large Hodler wallets as bullish.
Does this mean Ethereum is set to spike higher? Just hold your rockets moon bois, keep an eye on the market yourself and monitor what happens. 🐳