The Total Market Cap for crypto is hovering just below the $1 trillion mark near the $990 billion level. After mainly trading sideways over the past six days, today’s session has seen Bitcoin face its weakest day since last Monday.
If you remember, last Monday saw the Total Market Cap spike by +8.85% – the biggest single-day percentage gain since February 28, 22. So does today’s intraday pullback mean the rally is over? We’ll see, but let’s look at what the bulls and bears want.
The Bullish Take
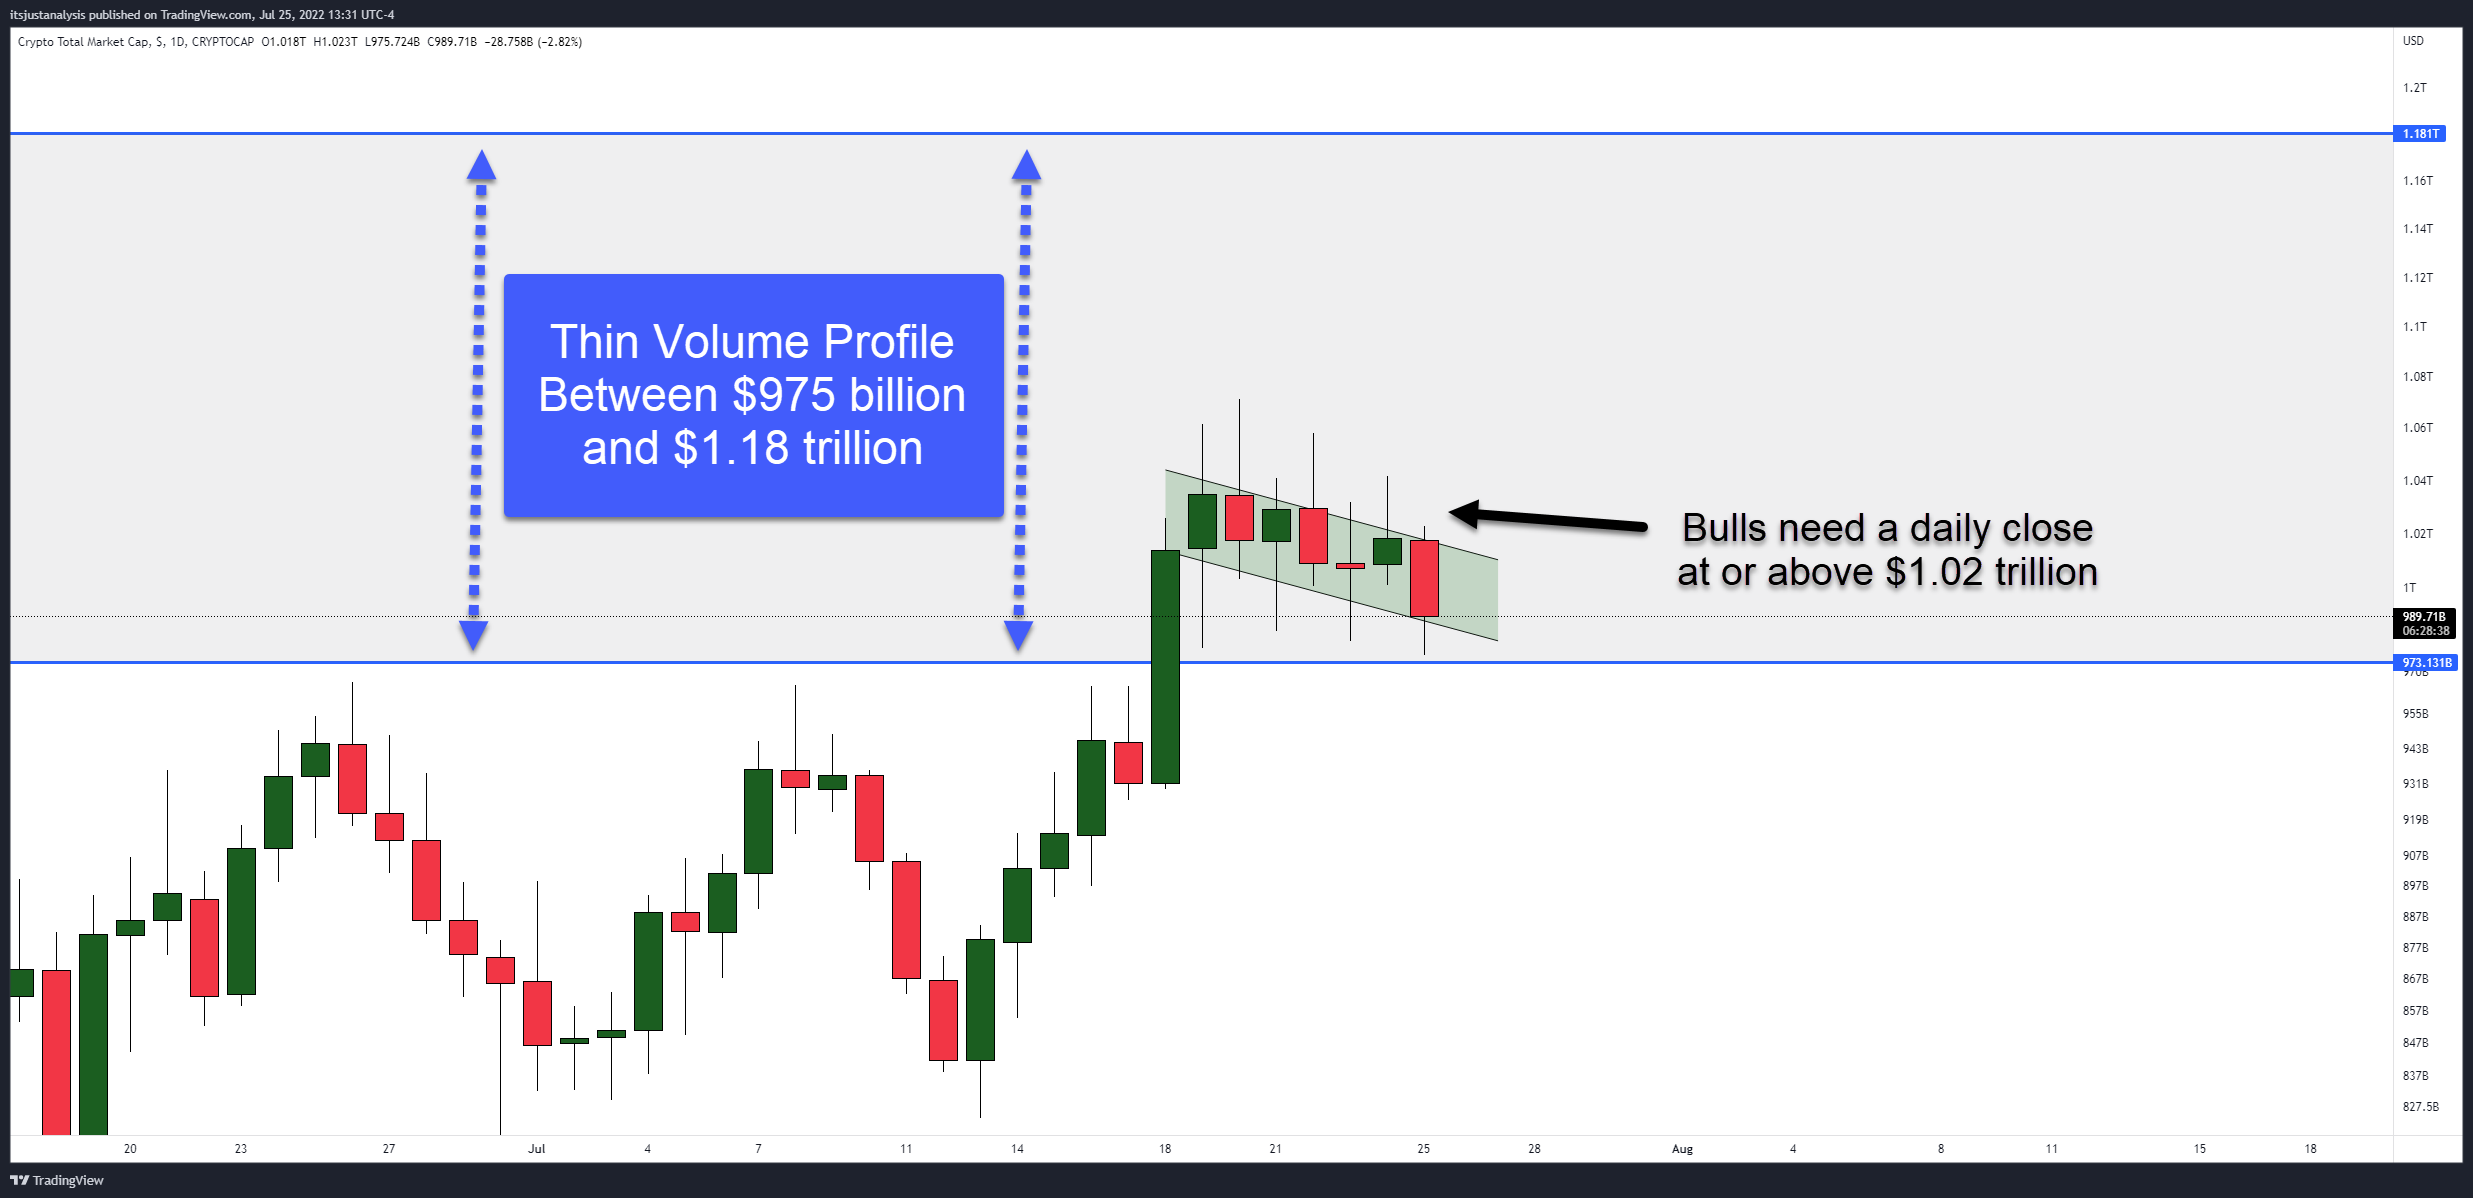
The green diagonal channel on the daily Total Market Cap chart above is a pattern known as a Bull Flag. Bull Flags are common continuation patterns analysts interpret as a precursor to another push higher. However, confirmation is always required.
For bulls, the price level analysts are watching is $1.02 trillion. A close at or above $1.02 trillion would position the market cap above the upper trendline of the Bull Flag and above the previous highest close from Sunday.
Note that the ease of movement for the Total Market Cap is weighed heavily to the upside. The lightly shaded gray area between the two blue horizontal lines represents an extremely thin range in the Volume Profile.
Because the Volume Profile is extremely thin, between $975 billion and $1.18 trillion, analysts expect a much easier time moving higher than lower.
The Bearish Take
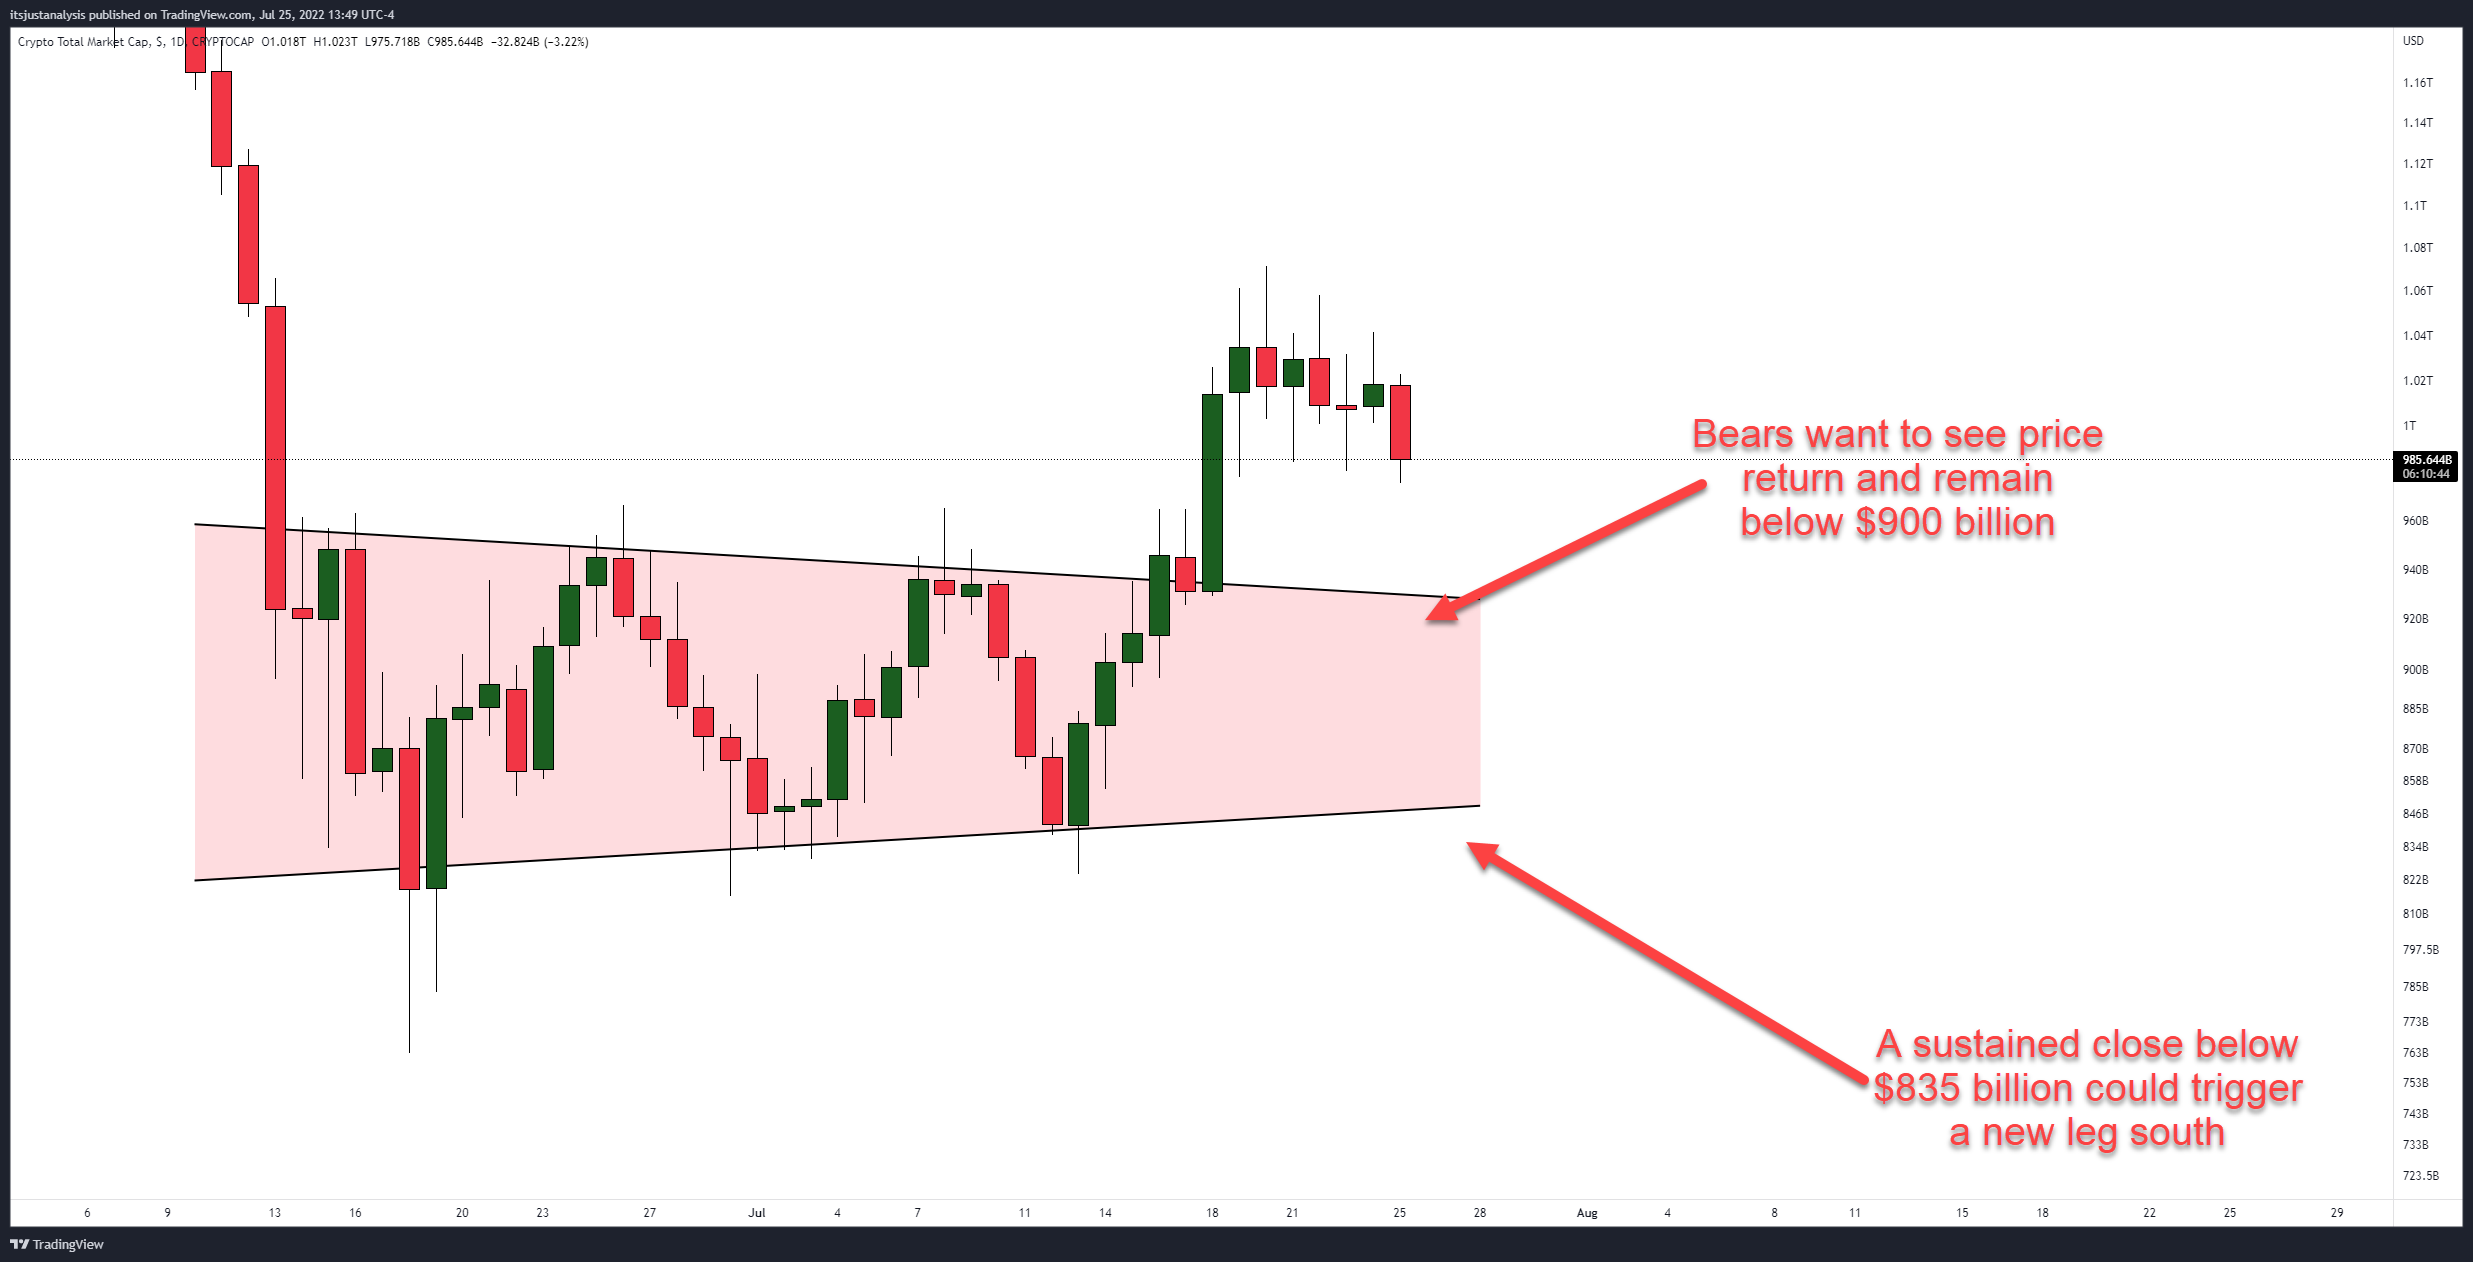
The opportunity for bears may have already come and gone. Price already moved above the Bearish Pennant last Monday and has remained above that prior pattern for a week.
If the breakout last Monday was a fakeout, bears want the Total Market Cap to return inside the Bearish Pennant near the $900 billion value area. However, this is a particularly volatile zone that could generate some massive whipsaws in price action, equally punching the bulls and bears in the mouth.
For bears, analysts see a sustained breakout below $835 billion as a critical condition for the crypto market to experience another major sell-off. 🟩