If you want to skip all the nerd speak, then there’s a TL;DR (Too Long; Didn’t Read) at the end of each analysis section you can scroll down to.
There are three kinds of people when it comes to technical analysis.
Category one for beginners: This category is ‘Your Baby’s First Book on Technical Analysis’ – it will include basic trendlines and moving averages.
Category two for people who know some stuff: If you think, “Oscillators and indicators are kind of cool,” this is for you – this includes tools like the RSI (Relative Strength Index), Fibonacci retracements/extensions.
Category three is for full-blown nerd mode geek stuff: “OMG, WTF is this? I don’t even… why does it look like a toddler’s coloring placemat from IHOP?!” This section can include concepts like the Ichimoku Kinko Hyo system, Point and Figure charting, Gann Analysis, and other bizarre stuff that you may or may not know, but we will break it down into a TL;DR version.
Bitcoin – Beginners Analysis
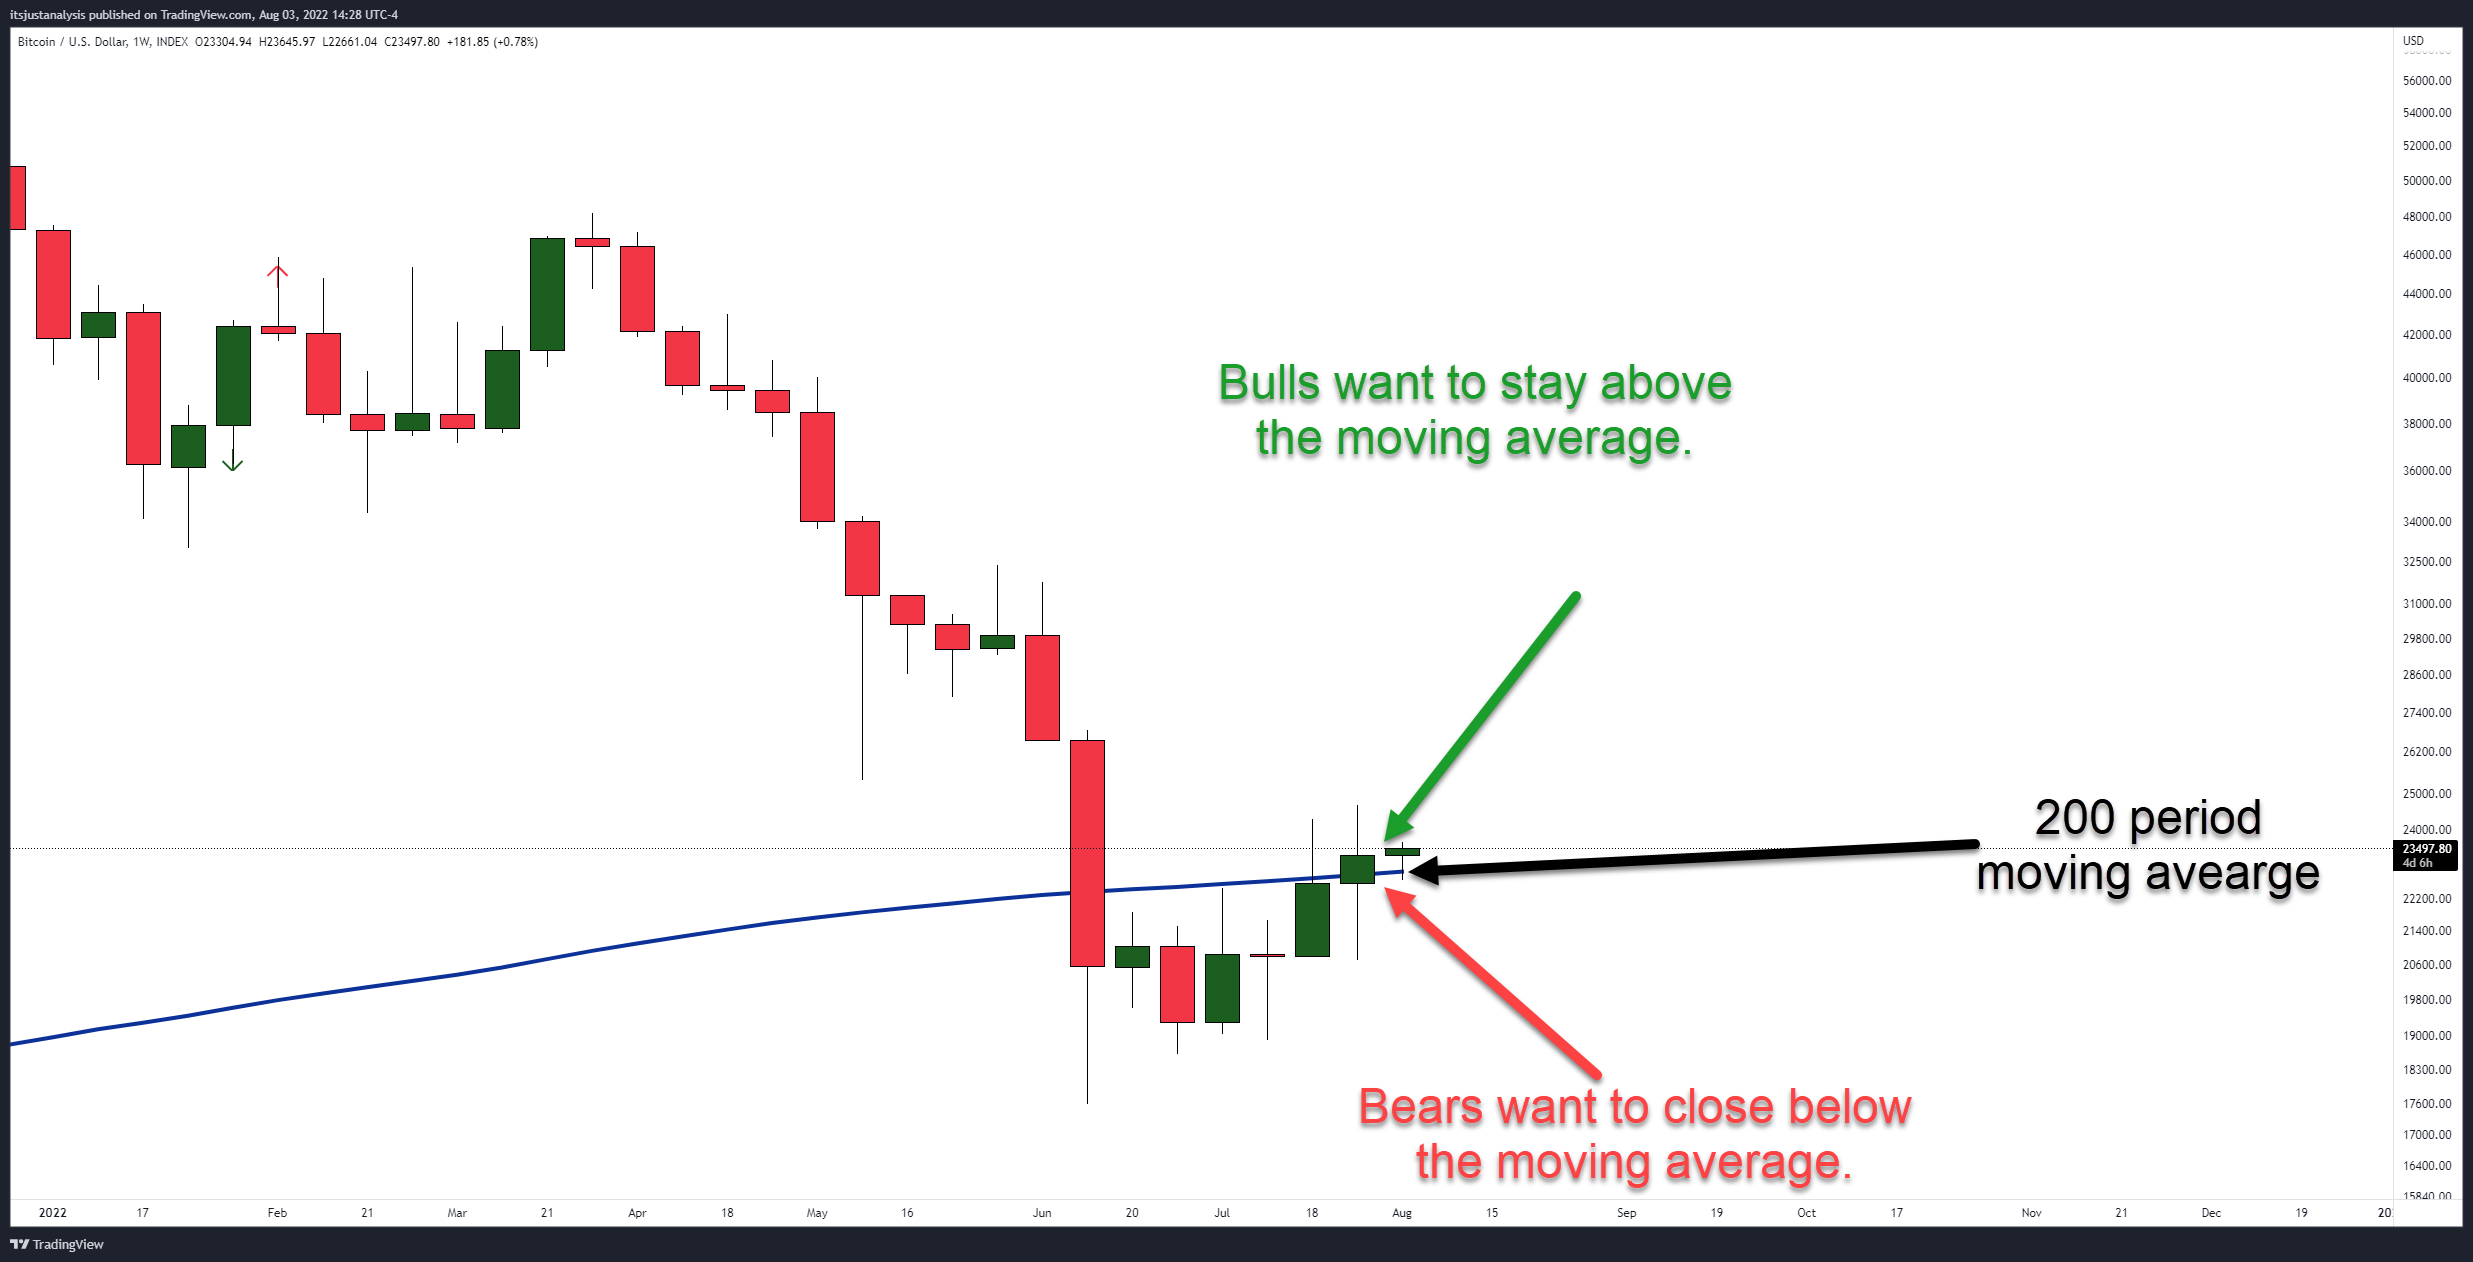
The chart above is Bitcoin’s ($BTC.X) weekly chart. The blue line on the chart is the 200-period moving average. That moving average is the average price of the past 200 weekly candles.
Analysts view the 200-period moving average as a sort of barometer to determine if a trend is bullish or bearish. To some analysts, failure to move and close above that moving average is extremely bearish.
Bulls successfully return Bitcoin above the 200-period moving average on the weekly chart. And so far this week, bulls are actively supporting Bitcoin and stepping in to buy when BTC approaches the 200-period moving average.
TL;DR for Bulls
Bulls want Bitcoin to close at or above $23,000.
TL:DR for Bears
Bears want to push Bitcoin to a close at or below $23,000.
Bitcoin – People Who Know Some Stuffs Analysis
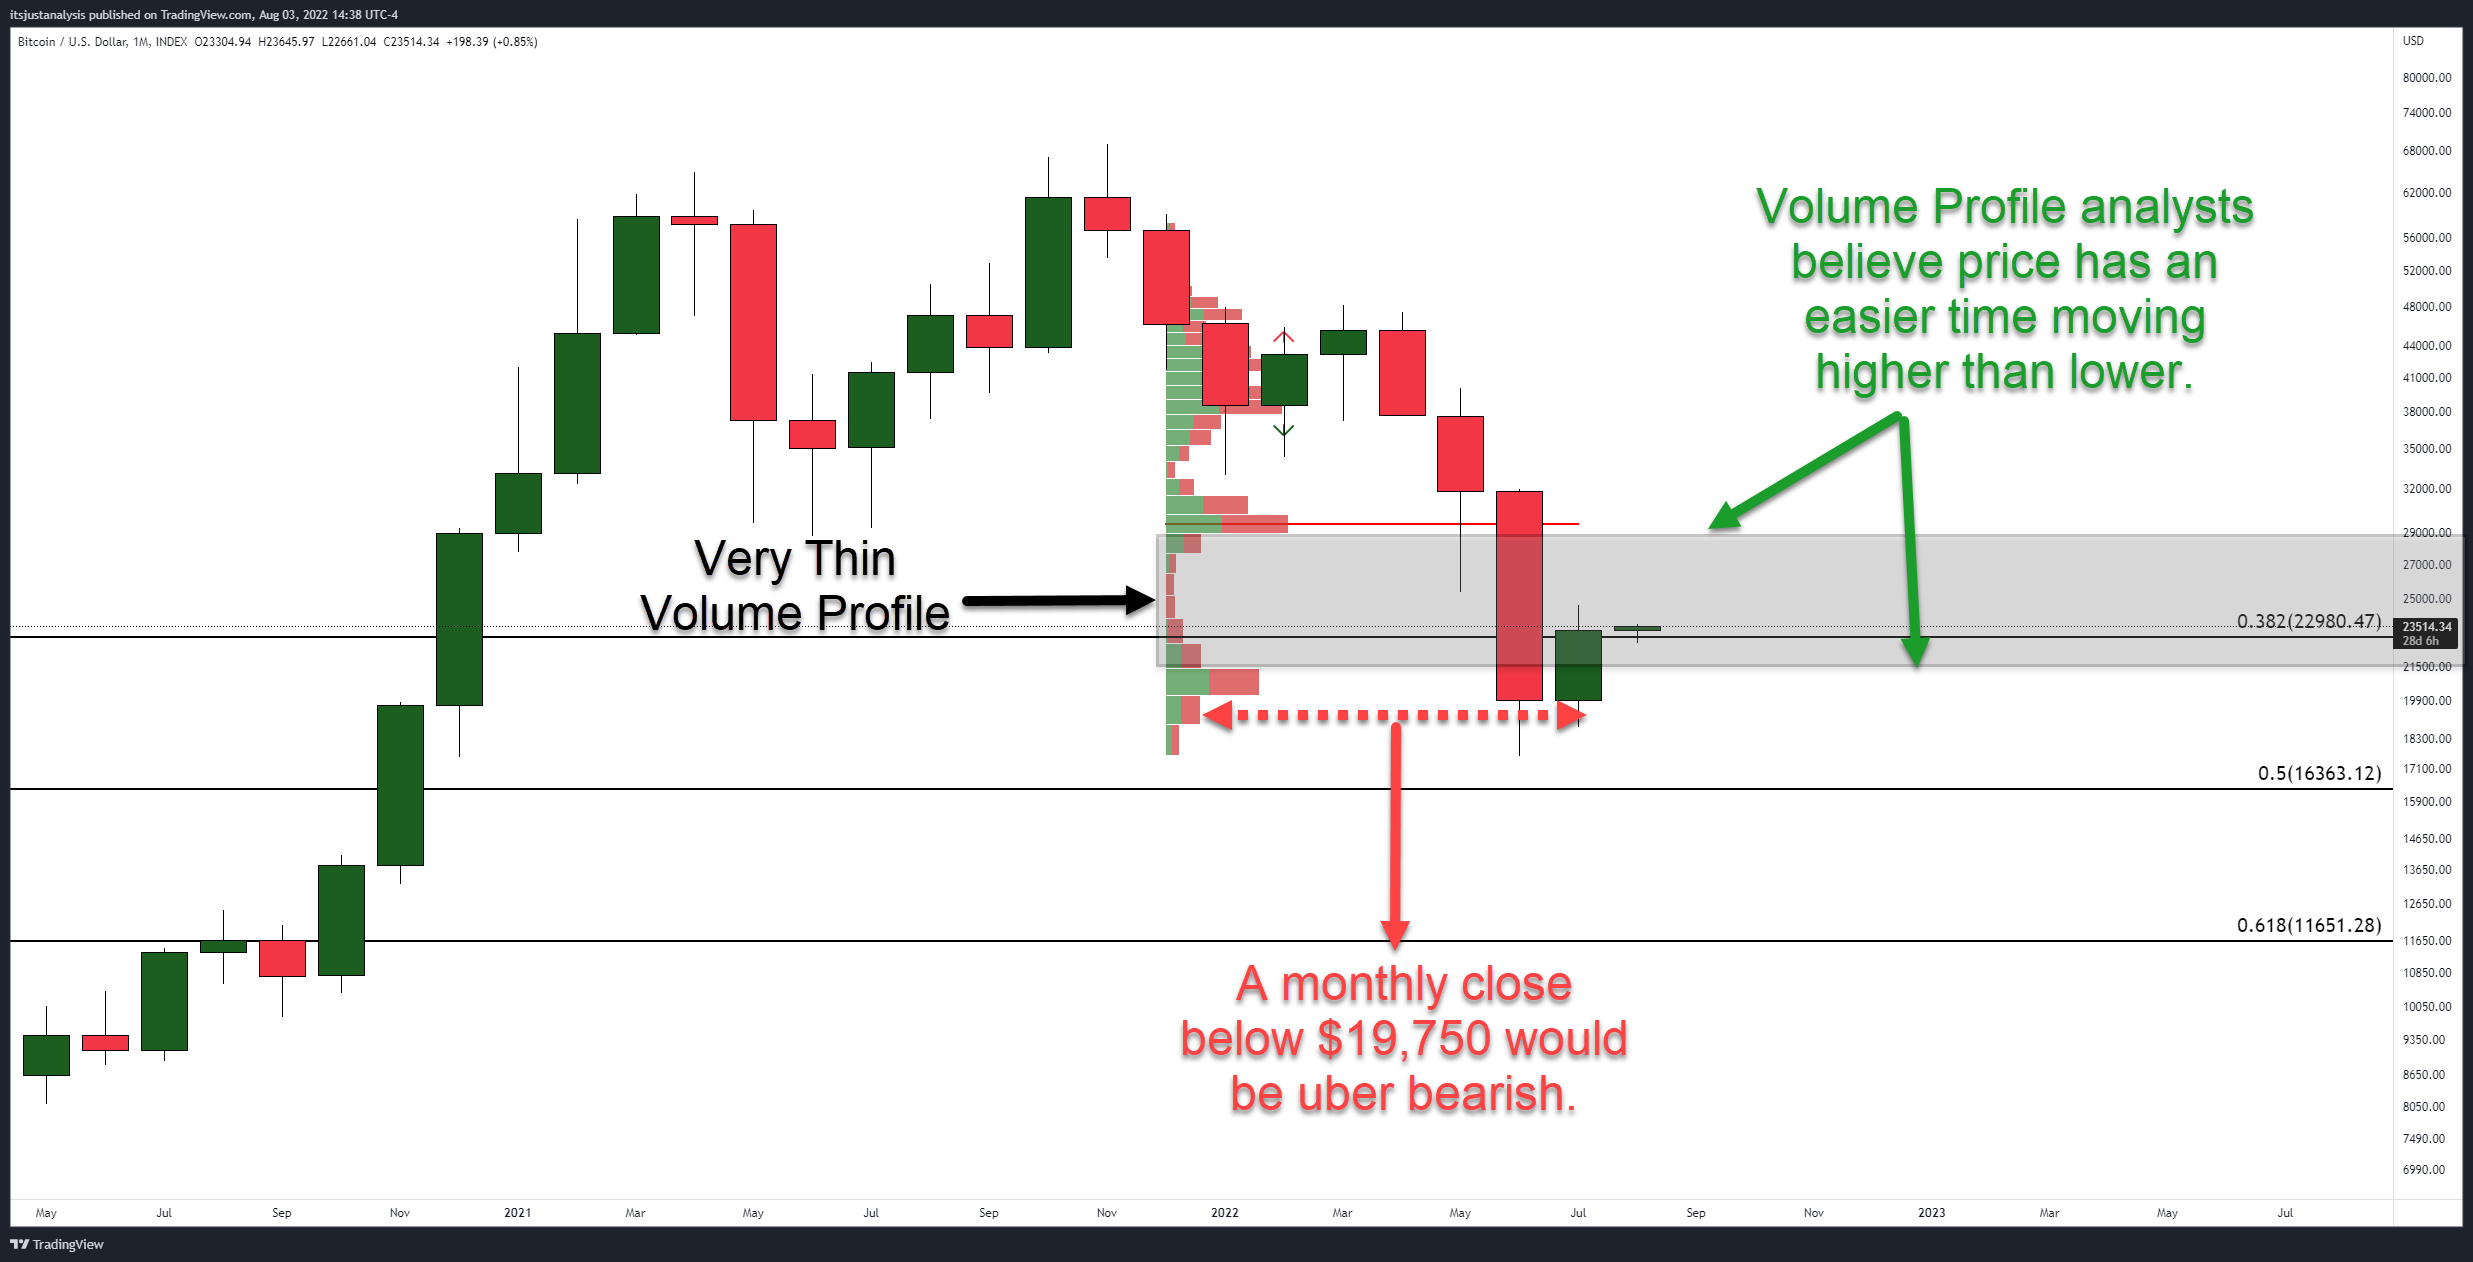
Looking now at the monthly chart for Bitcoin, there are a few important pieces of technical analysis to observe:
- The very thin volume profile.
- The inside bar.
- The 38.2% Fibonacci retracement.
First on the list is the Volume Profile, which measures how much of something was traded at a certain price. The longer parts of the Volume Profile that stick out are called high volume nodes. Analysts interpret high-volume nodes as major levels of support and resistance.
Notice the light gray shaded area between the high volume nodes at $19,900 and $29,000. The Volume Profile is extremely thin between those nodes. When price moves above/below a high volume node and into a very thinly traded zone, analysts expect price to move swiftly to the next high volume node.
Thin areas in the Volume Profile act as a sort of vacuum and ‘suck’ price from one high volume node to the next.
The second key piece of technical analysis for Bitcoin is the inside bar formed in July. An inside bar is a Japanese candlestick pattern that forms when the entire range of a candlestick is within the range of the prior candlesticks. In other words, July’s monthly high was lower than June’s, and July’s month low was higher than June’s.
Analysts and traders use inside bar patterns to identify critical breakout levels to long or short. Bears want an August close below the open of the July candlestick at $19,900.
The third and final piece of technical analysis is the 38.2% Fibonacci retracement at $22,980. From a short-term perspective, analysts believe Bitcoin must close the August monthly candlestick above the 38.2% Fibonacci retracement. Failure to do so could trigger a return lower and perhaps trigger the inside bar short setup bears want.
TL:DR for Bulls
Bulls need to close the August candlestick above $22,980. If they don’t, it doesn’t necessarily mean further upside potential is gone, but a continuation move south is increasingly likely.
TL;DR for Bears
If August’s monthly candlestick closes at or below $19,900, prepare your rabies shots because bears will be frothing at the mouth.
Bitcoin – Don Thy Geek And Tin Foil Hats Analysis
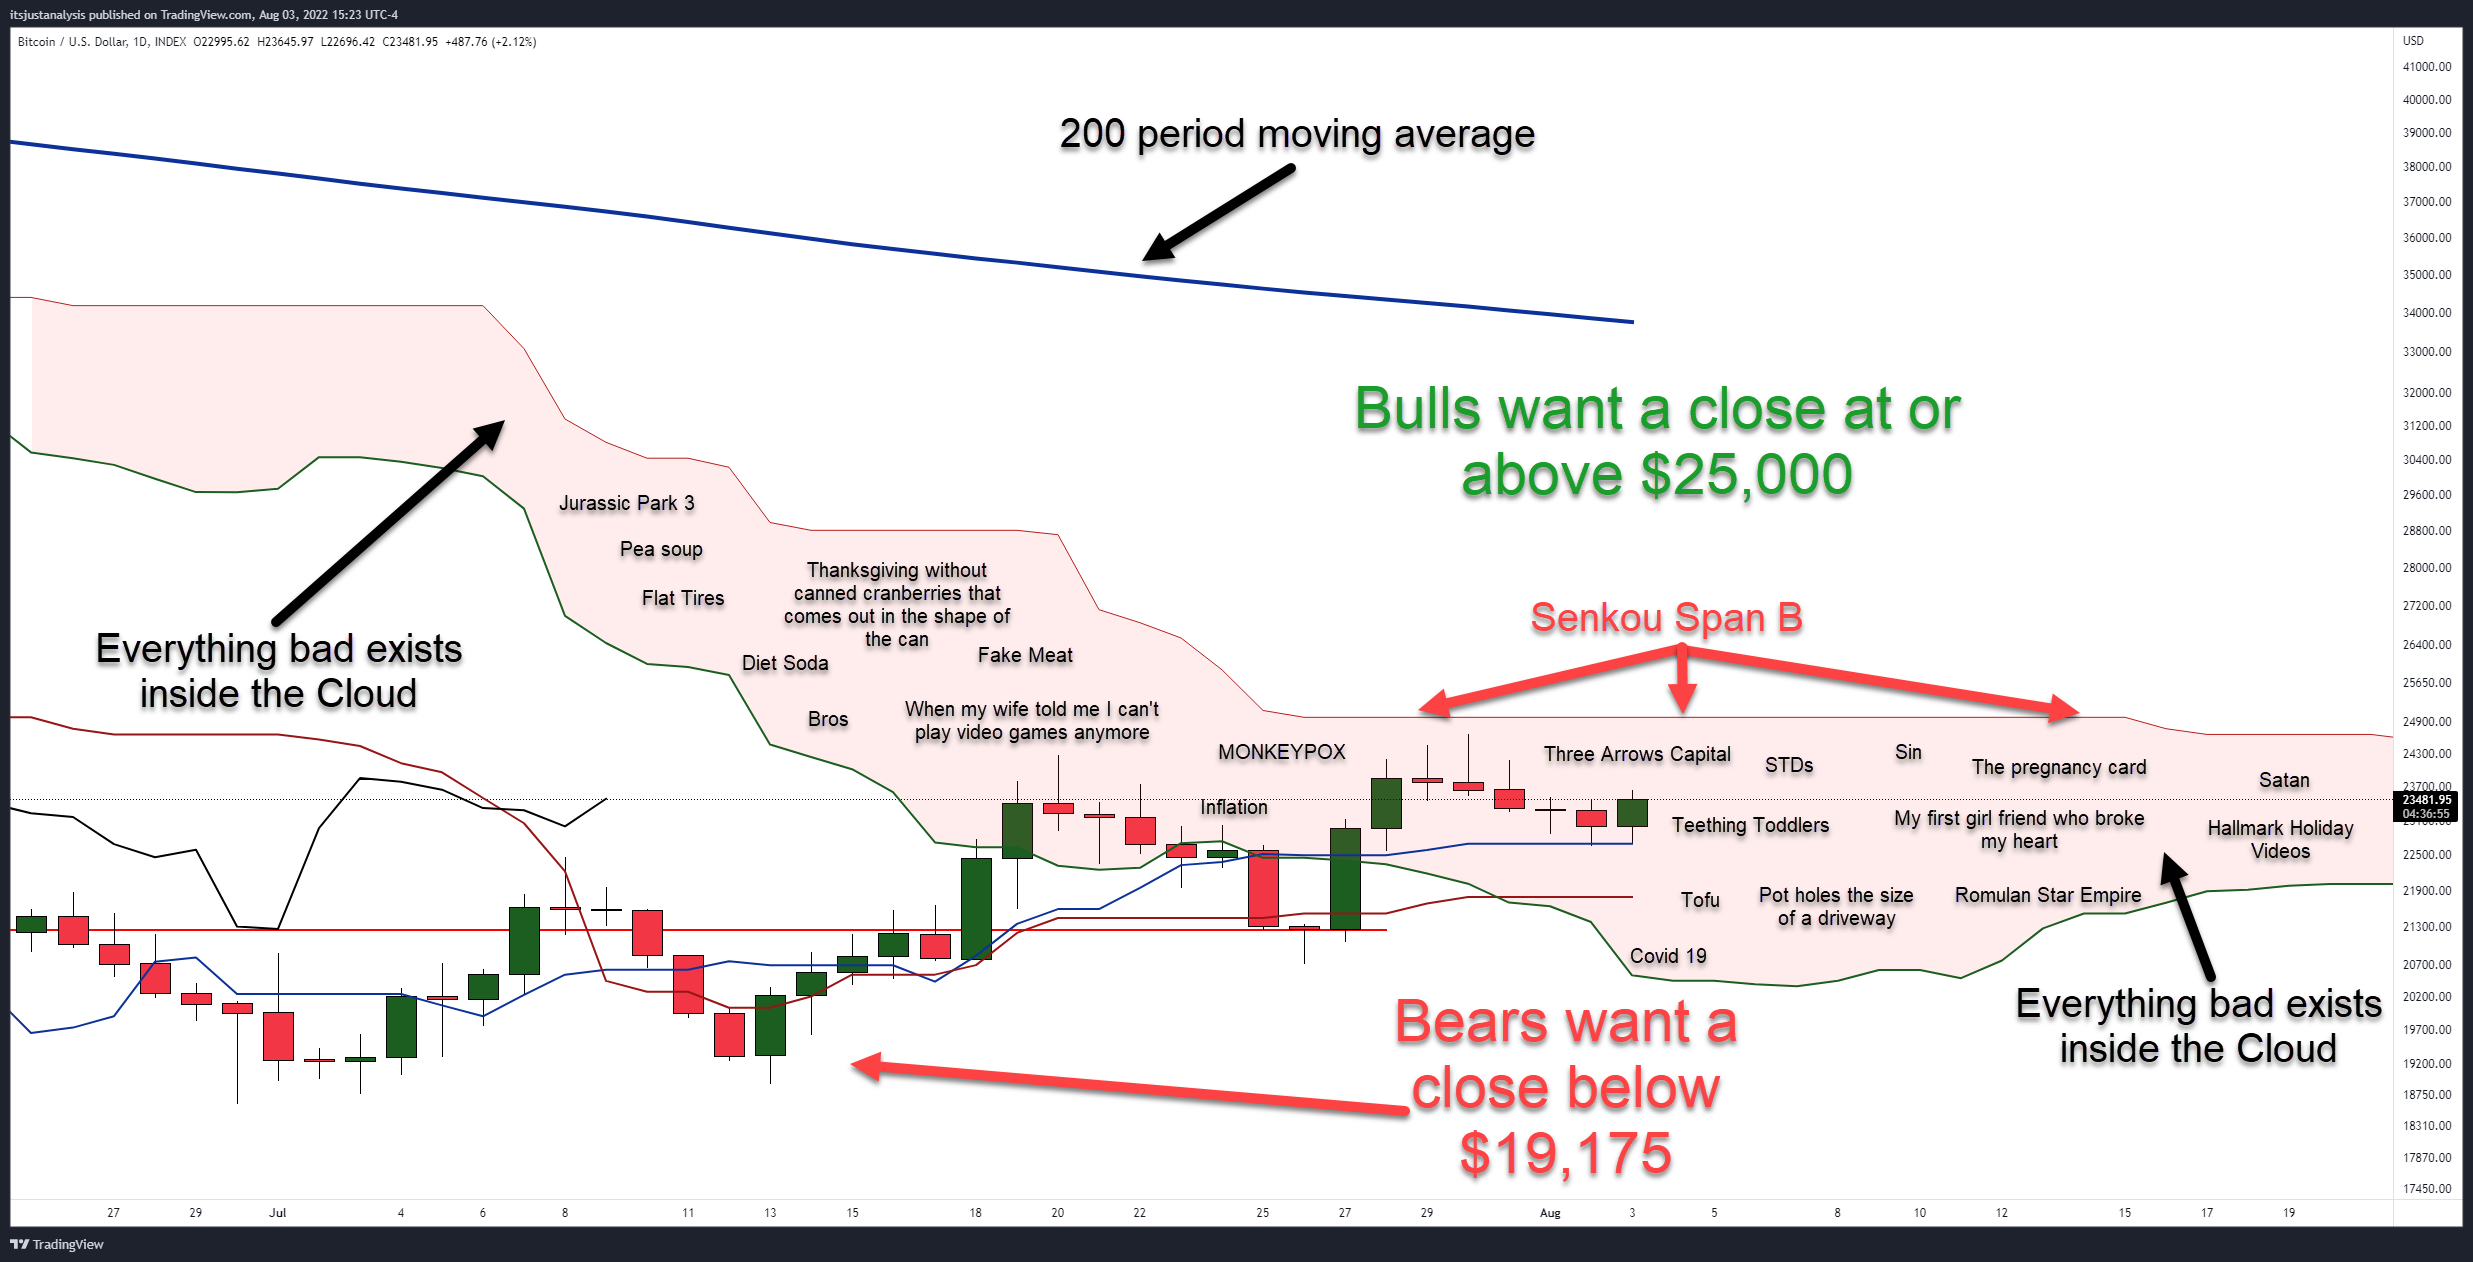
For the final chunk of analysis, we’re going to look at Bitcoin’s daily chart, focusing on the Ichimoku Kinko Hyo system. The Ichimoku Kinko Hyo system is an upgraded version of Japanese candlesticks.
Pro-tip: If you’re not using Ichimoku with your Japanese candlesticks, it’s like using Windows 95 instead of Windows 10.
Anyway, without going into all the details of this system, I want to call your attention to a key area of the Ichimoku system: the Cloud (Kumo). The Cloud is probably the most distinguishing feature of the Ichimoku system. The Cloud is that blob of red on the image above.
Again, without going into the nitty-gritty, this is all you need to know about the Cloud:
It’s bad. It’s that place that Mufasa told Simba he shouldn’t go to. The Cloud represents everything bad, everything that sucks, everything miserable.
The Cloud represents volatility, indecision, whipsaws, and misery.
It’s the place where trading accounts go to die.
The top of the Cloud, Senkou Span B, is the strongest level of support/resistance within the Ichimoku system. If you ever see Senkou Span B is flat, that makes the support/resistance even stronger. The strength of that support/resistance is further exacerbated by how long it remains flat.
For Bitcoin, Senkou Span B will likely prove to be a biatch to close above. When you add the psychological price level of $25,000 to the mix, it makes for a difficult price level to break above. But bulls can pull it off, then bullish analysts expect a strong and sustained rally higher.
TL:DR for Bulls
Bulls need a daily close above Senkou Span B at or above $25,000.
TL:DR for Bears
The path lower, from an Ichimoku perspective, is much easier for Bitcoin than moving higher. However, remember that the Volume Profile is extremely thin, with a major high volume node near the bottom of the Cloud.
Additionally, the Chikou Span (I didn’t go over that, but that’s ok) in the Ichimoku system needs to close below the candlesticks. Finally, bears need to close Bitcoin at or below $19,175 for a clear resumption of Bitcoin’s bear market.