Quick point: the cryptocurrencies reviewed are filtered according to a minimum market cap of at least $2 billion and exclude stablecoins and any wrapped coins.
The Ugly
We have to start this off again with the shite show that is Cardano ($ADA.X). After last week’s -12.5% drop, the losses extended again this week, getting very close to the -10% level. Cardano’s price action is beginning to look a lot like the Japanese Yen: ready for hospice care.
Fundamentally, things are strong for Cardano. We go over what those positives are in the Bullets section. But from a price action perspective, it’s as bearish as Leonardo DiCaprio’s fight with that grizzly bear in Revenant.
Is there any light at the end of this tunnel? Maybe. From the perspective of the Ichimoku Kinko Hyo system, Cardano’s weekly chart is textbook bearish with zero support structure ahead.
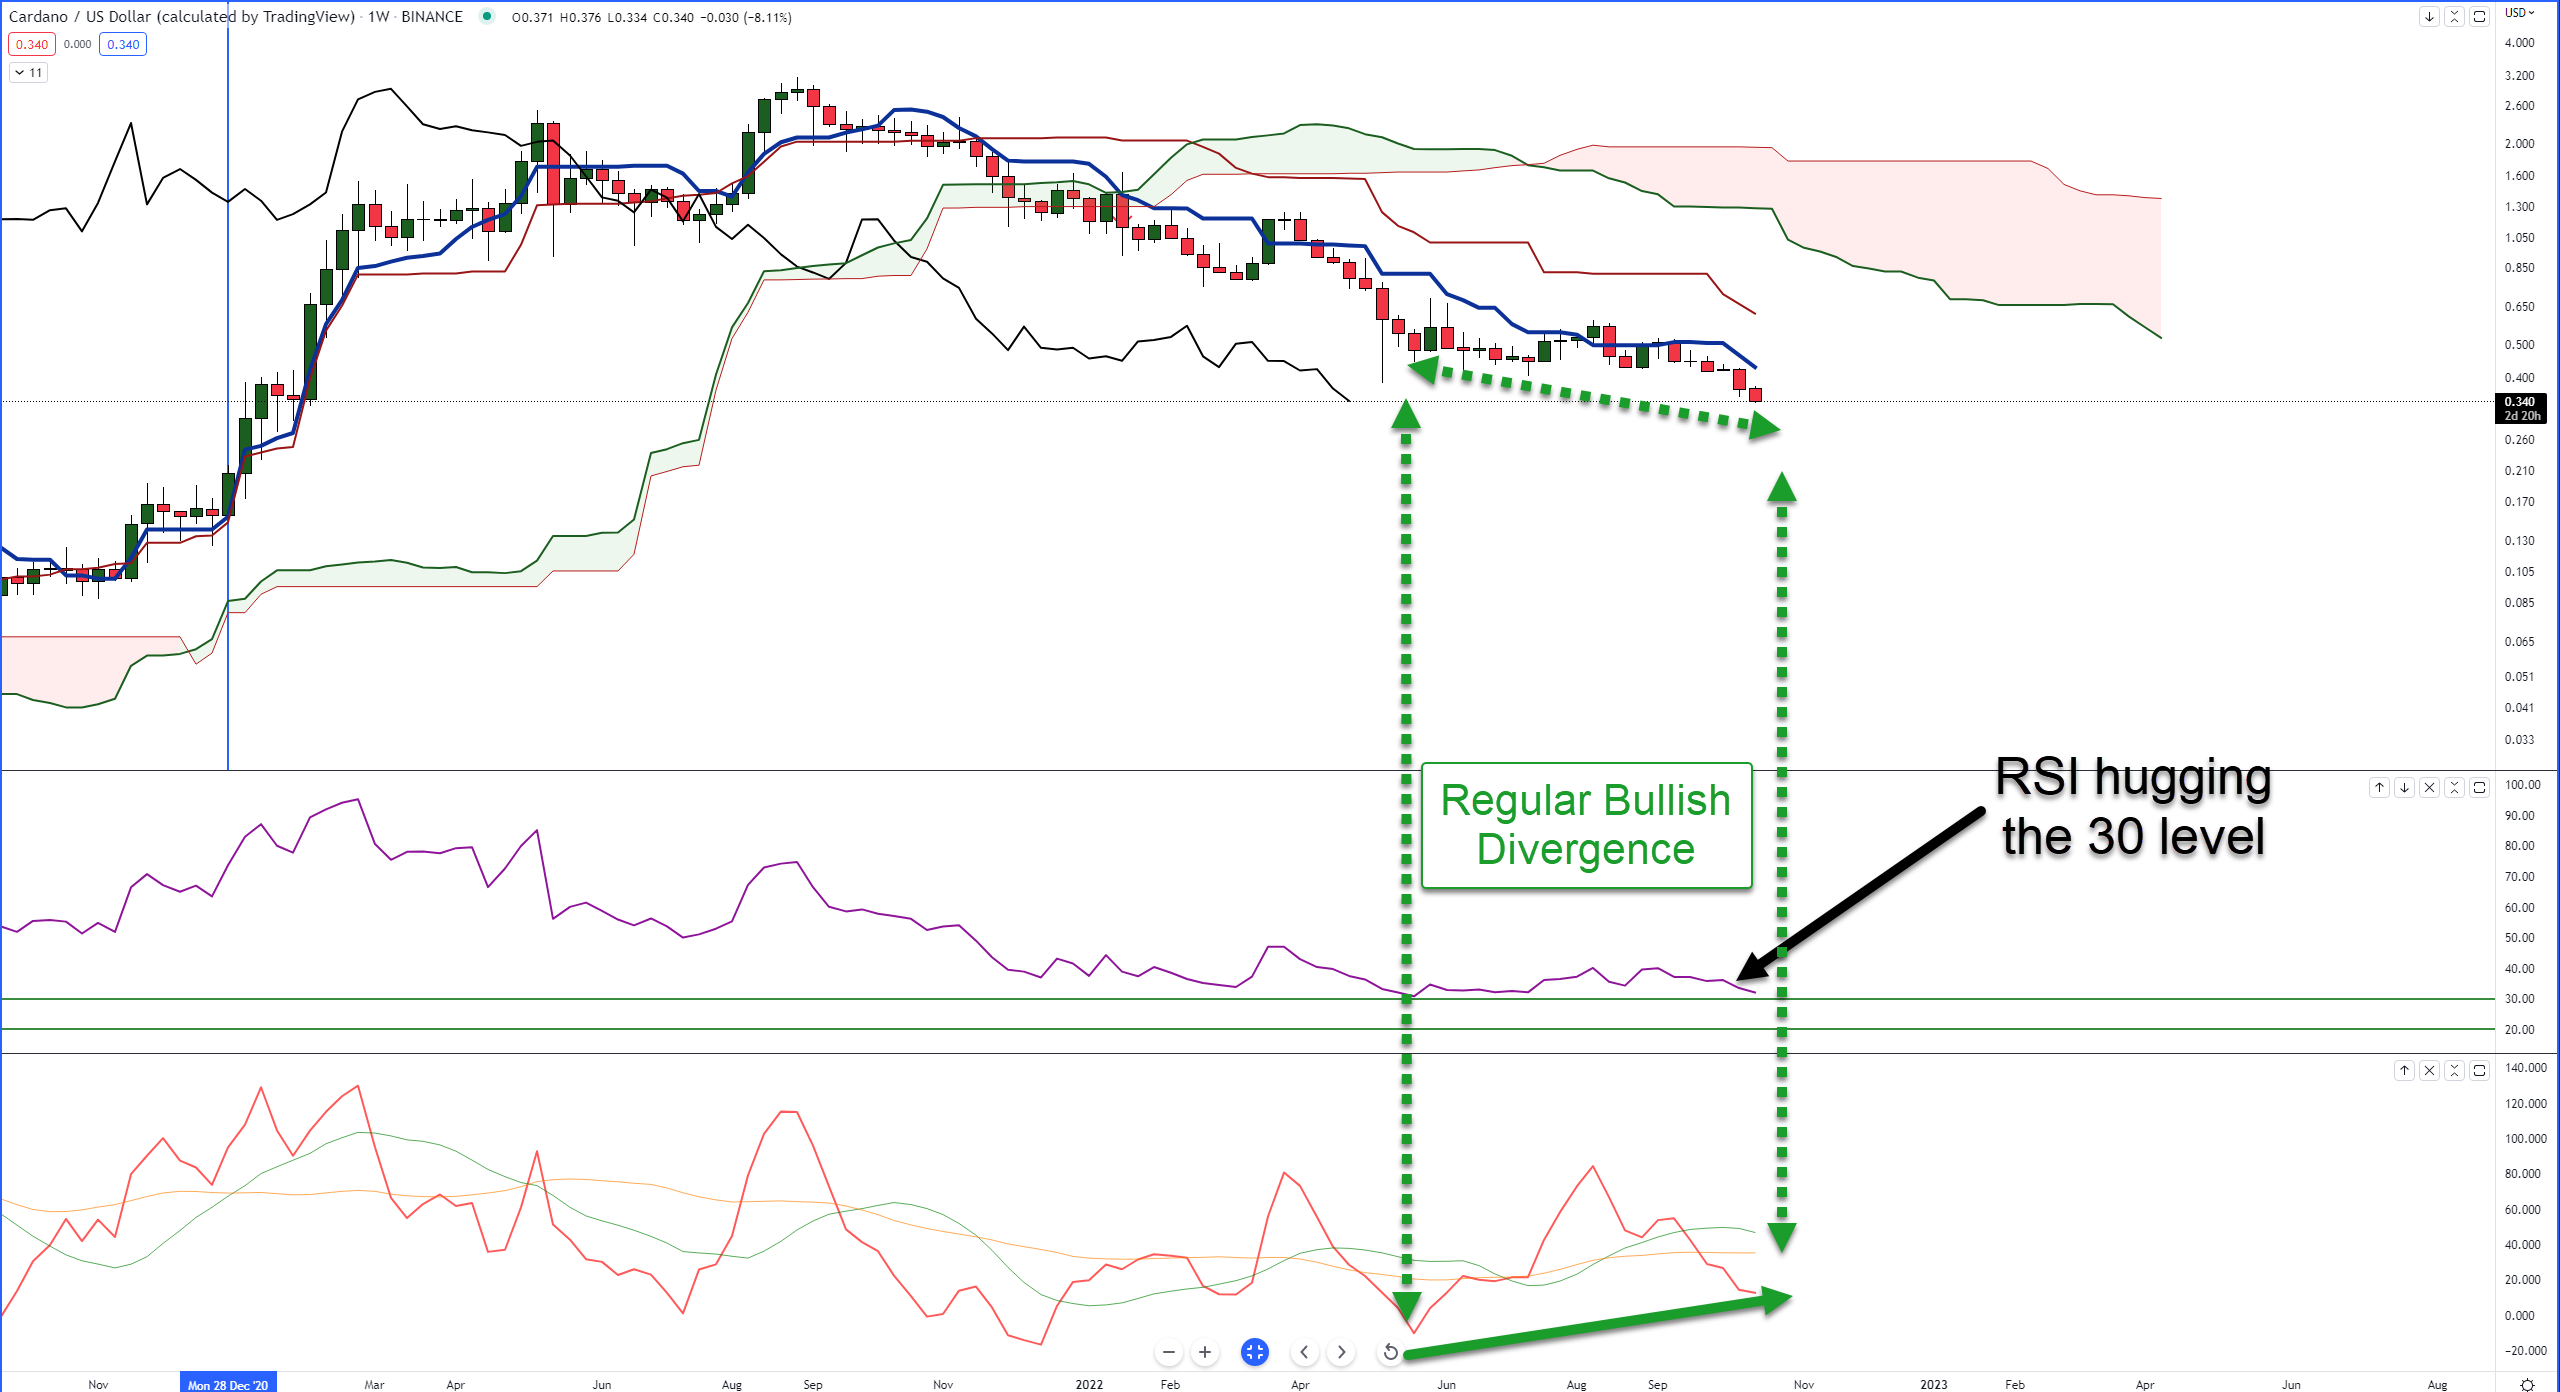
To make matters worse, the Time Span Principle in the Ichimoku system shows zero nearby time cycles culminating on the weekly chart. If you want something even more disheartening, there isn’t even a Gann cycle present to put out this dumpster fire.
The only hints of maybe this nightmare might end are found in the oscillators. The Relative Strength Index (RSI) is slowly rising and is hugging the first oversold level in a bear market (30) for the better part of the past five months. Additionally, there is a notable regular bullish divergence between the candlestick chart and the Composite Index.
But bullish signals in an oscillator(s) without corresponding bullish price action are like having a life jacket but floating in the freezing ocean. Not much help in the long run.
The Good
Polygon ($MATIC.X) barely edged out a win for the week – but that’s not saying much. It ended the day slightly lower but certainly wasn’t a big loser for the day.
From an Ichimoku perspective, Polygon is right up against the weekly Tenkan-Sen and Kijun-Sen. If MATIC can close next week at or above $0.99, then price will be above the Tenkan-Sen and Kijun-Sen along with the Chikou Span above the bodies of the candlesticks.
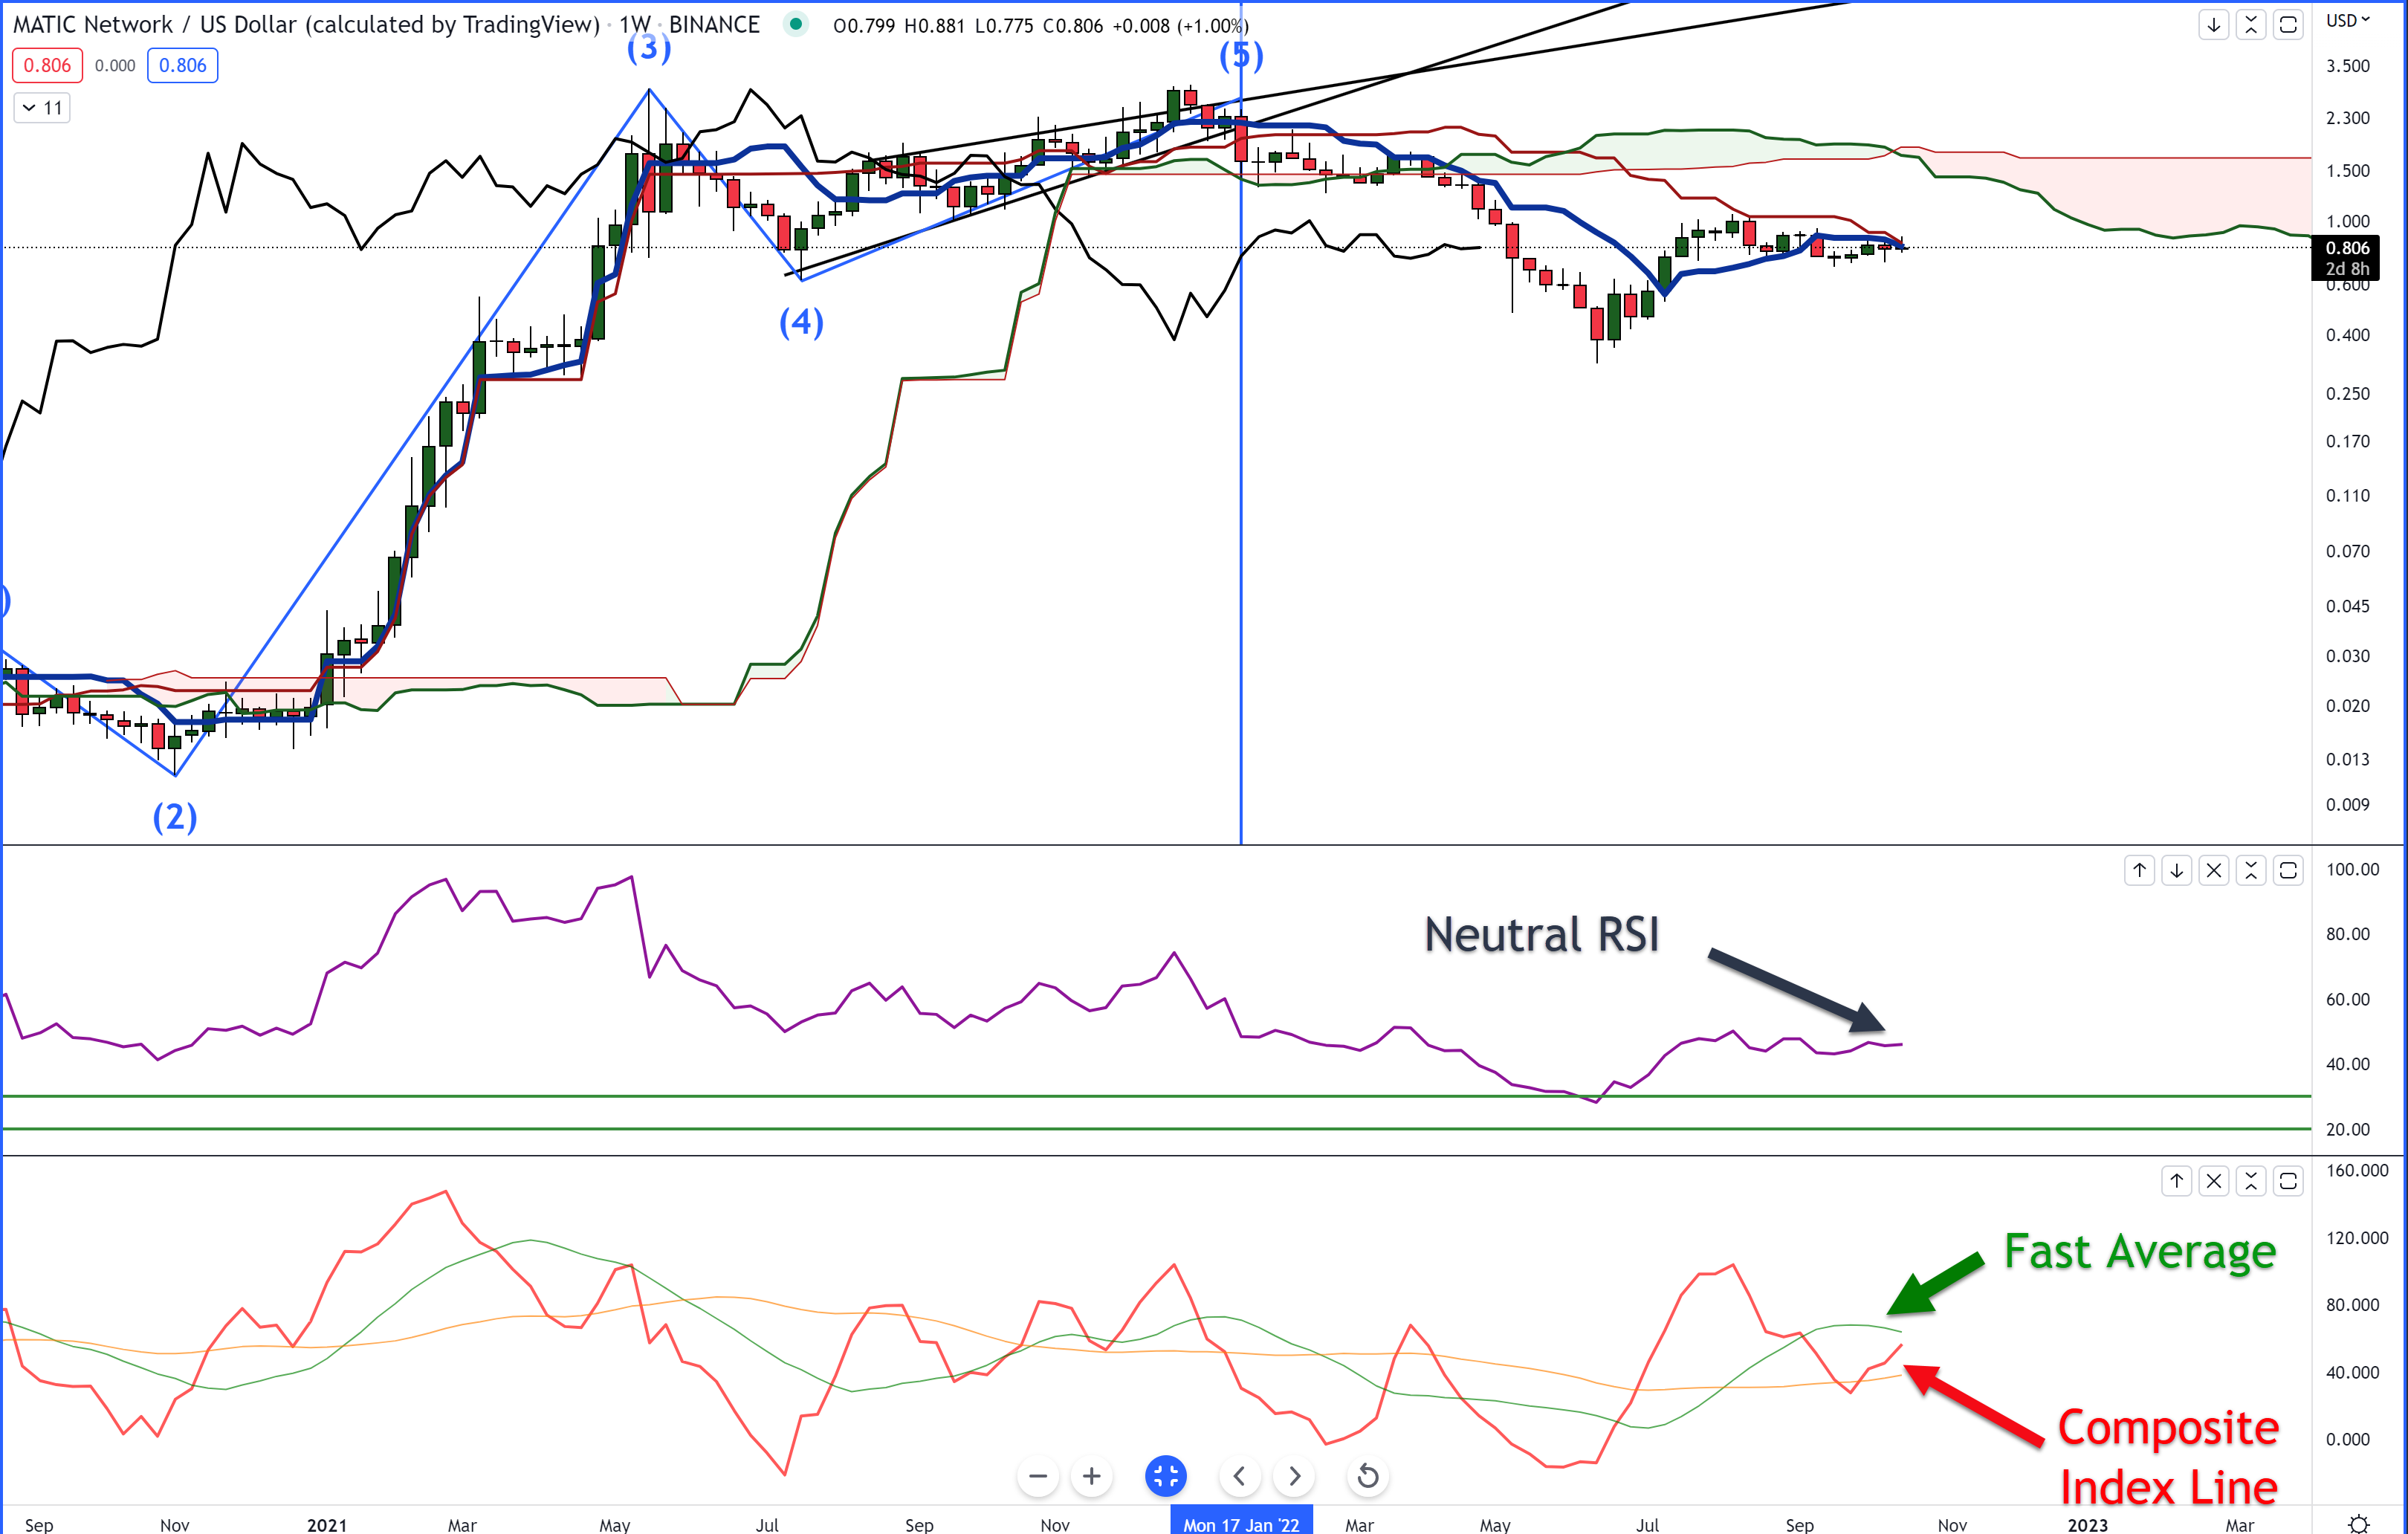
While Polygon will remain bearish as long it remains below the Cloud, a close at or above $0.99 would likely terminate any further immediate selling pressure. The Relative Strength Index supports this outlook due to its neutral position.
The Composite Index is the only weekly indicator hinting that a bullish break may occur. The angle of the Composite Index line suggests it could cross above its fast moving average very soon – which is a bullish event if price action has been sideways.
The Bad
Nexo ($NEXO.X) has several ugly conditions affecting its price action, technically and fundamentally. From a fundamentals point of view, Nexo is facing several investigations and/or cease and desist from at least eight US states.
The technicals for Nexo don’t exactly look that great, either. Nexo remains below all of the Ichimoku levels, giving us clear signs of how bearish it is. The only saving grace is the Chikou Span is not in open space.
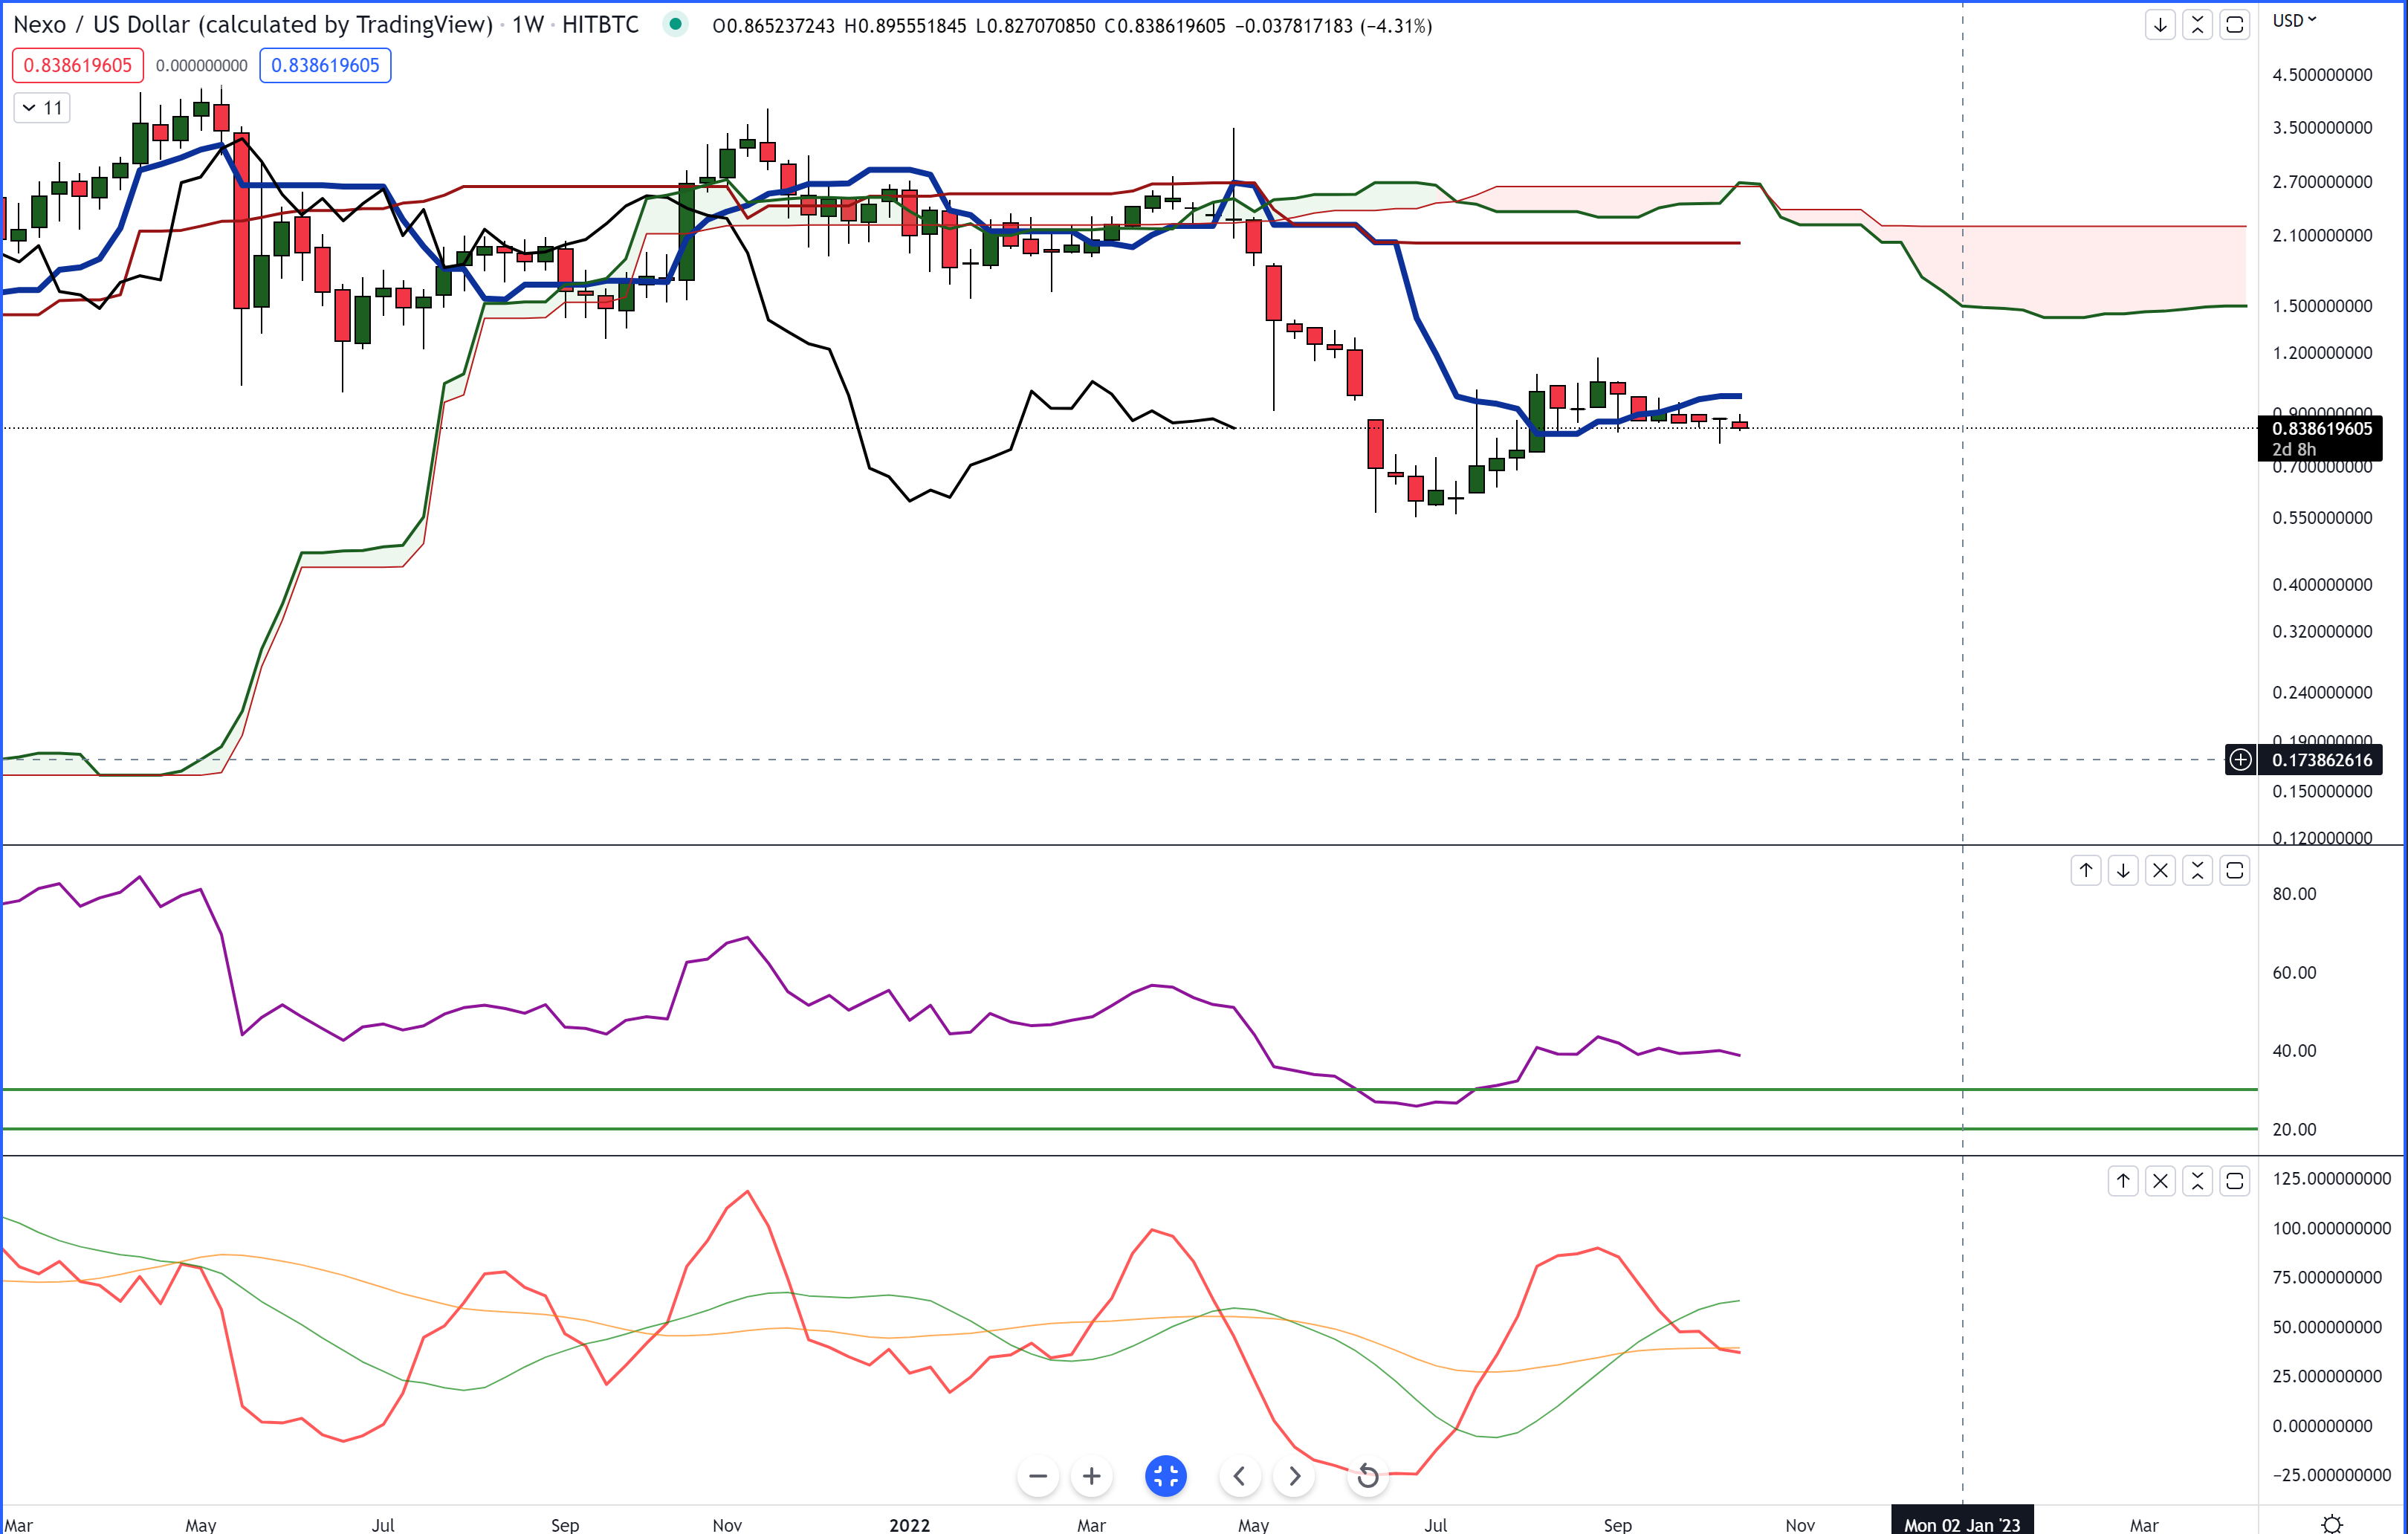
The Relative Strength Index has a slight tilt lower, indicating Nexo may drift lower toward the first oversold level at 30. The really dangerous condition is the Composite Index line crossing below its slow moving average.
It could be that Nexo will be a severe underperformer soon, even if the broader market experiences a rally.