Imagine you walk into a room, and there’s a gymnastic floor routine going on. The gymnast is twirling that ribbon in circles and throwing it in the air – just a wonderful display. 🎗️
Except it’s not a gymnast, and the room isn’t a gymnasium. It’s your toddler’s bedroom, and that’s not a ribbon in his hands; it’s a diaper. And it needed to be changed before he turned his walls and crib into 360 degrees of brown paint splatter art hell.
That’s what BTC’s weekly chart looks like.
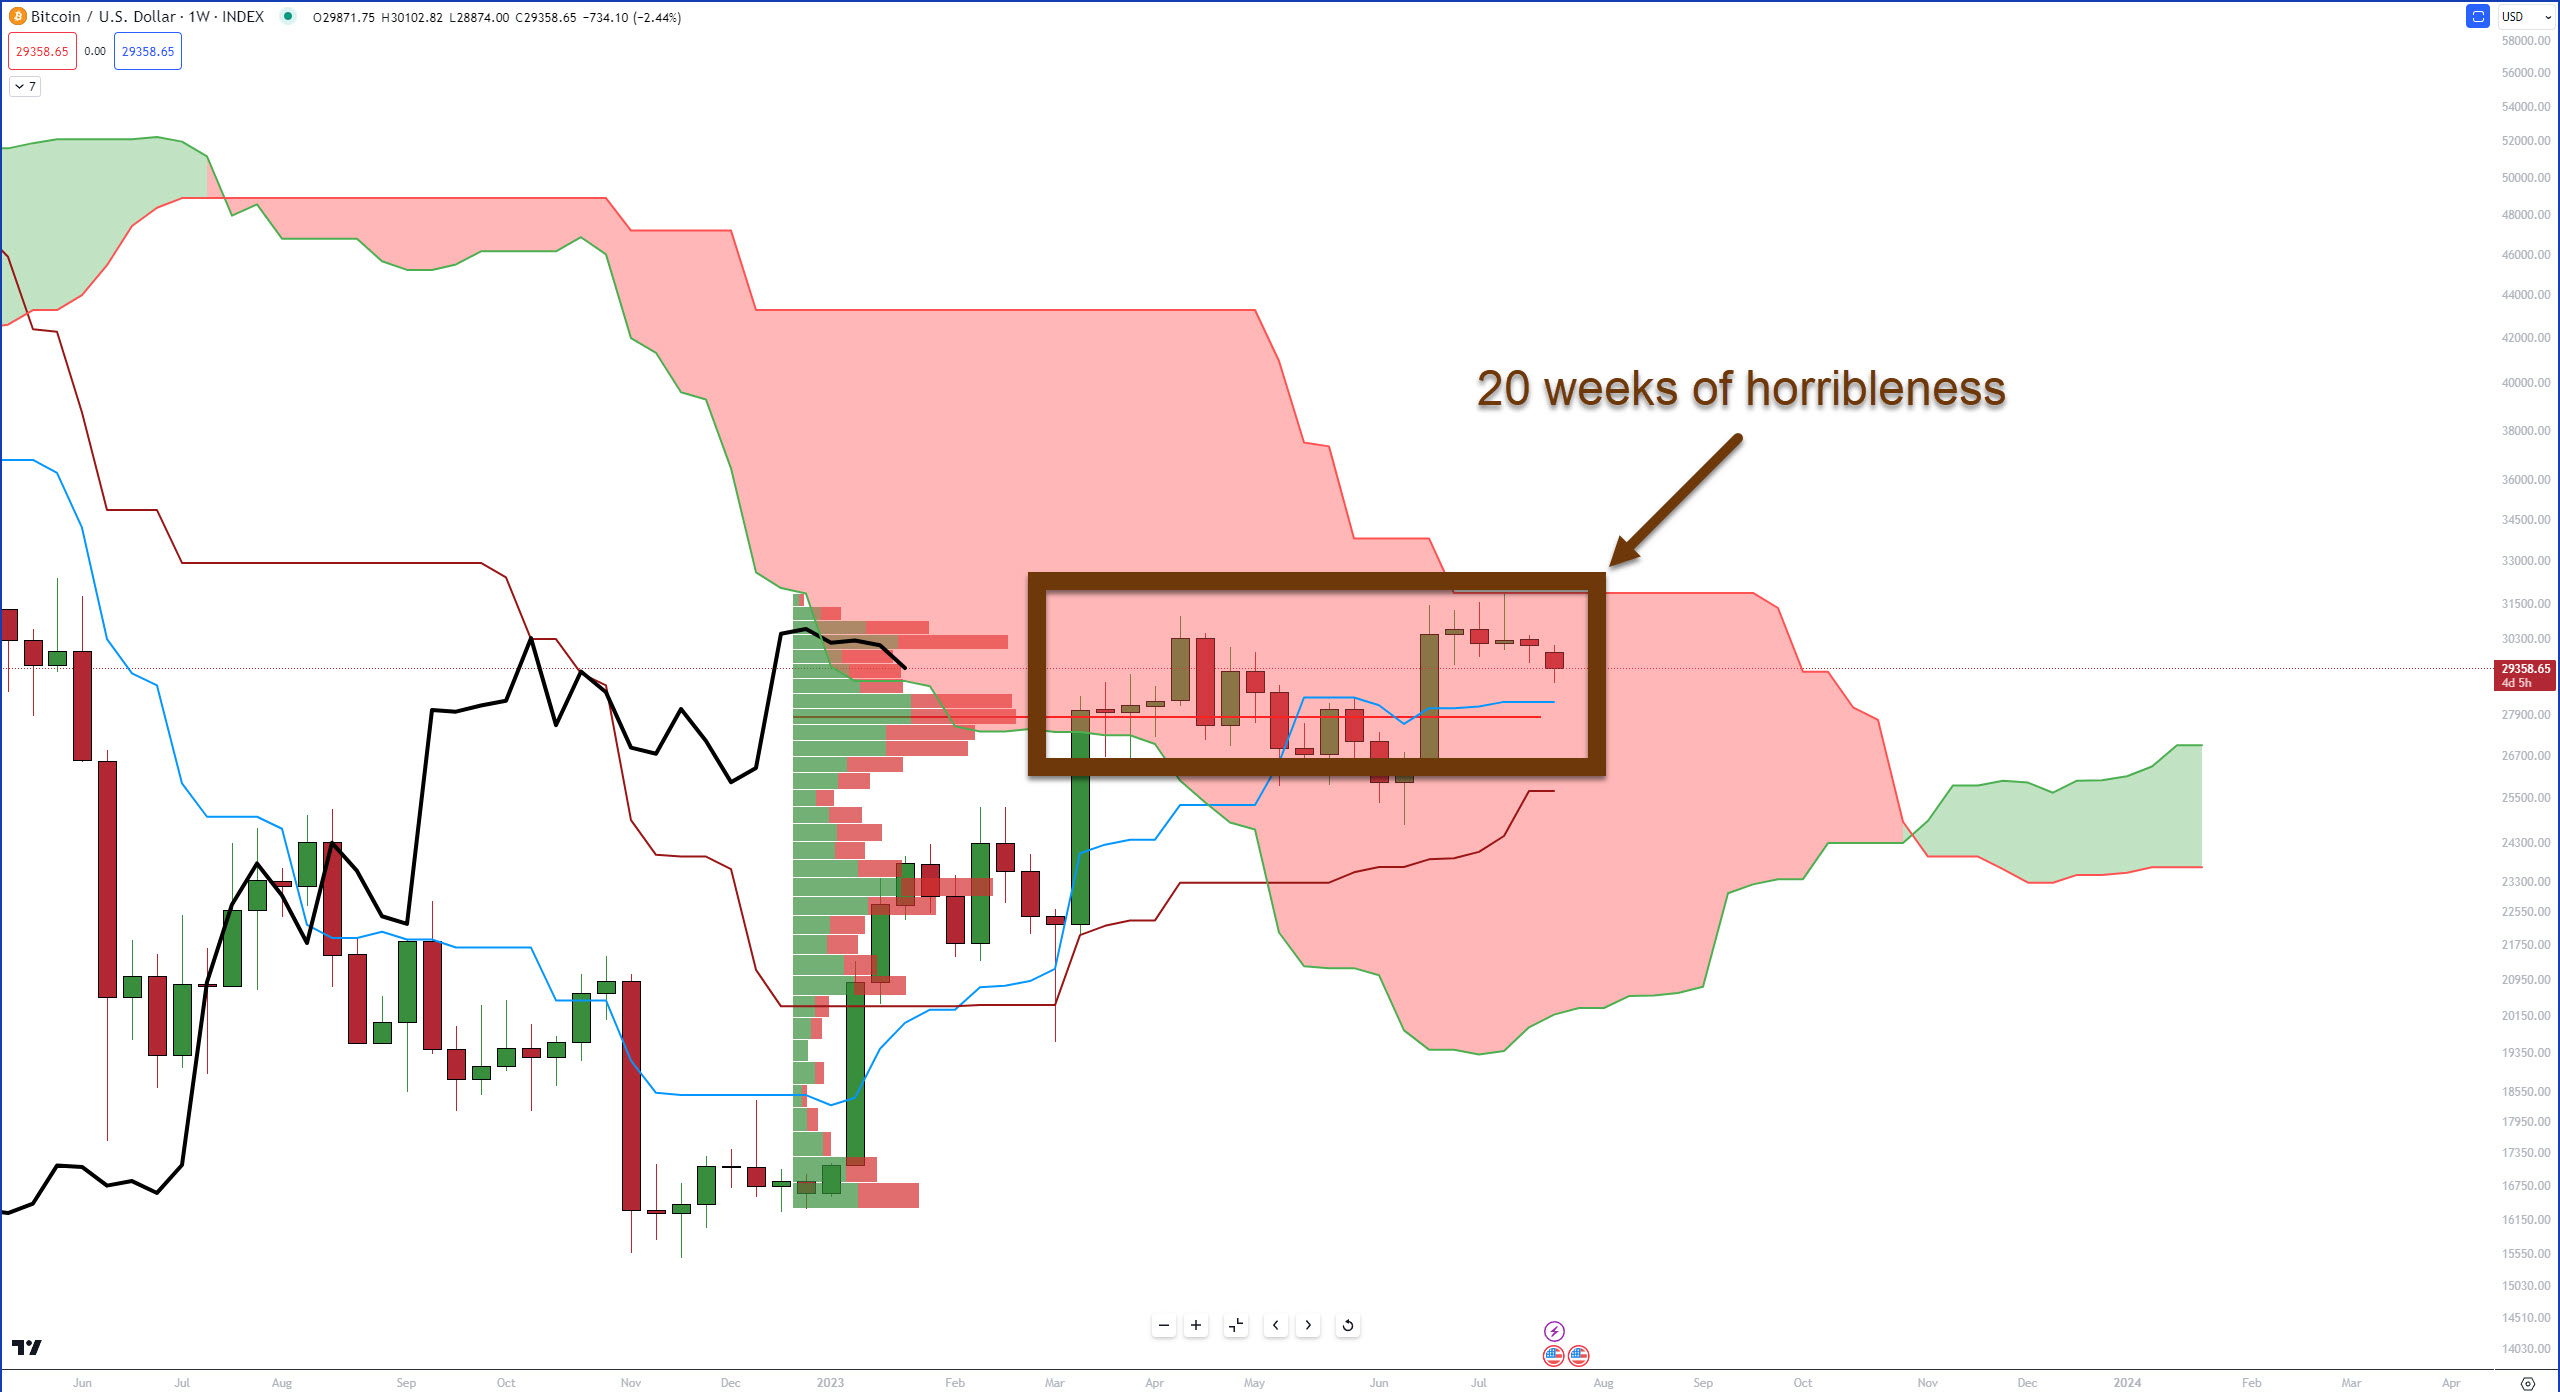
Twenty weeks. 20 God-damned weeks of sitting inside this stinking Cloud. That’s a record by the way. People have written about this being the longest and most painful bear market in crypto history.
And Bitcoin’s weekly Ichimoku chart is a perfect reason some people believe it’s been so bad.
Worldcoin
The newest evil big-name crypto, the anti-Christ’s Worldcoin is also the creepiest because you have to sell your soul scan your eyeball. It’s been ‘out’ for barely two days, and on the hourly chart, it’s showing some bullish conditions. 🌏
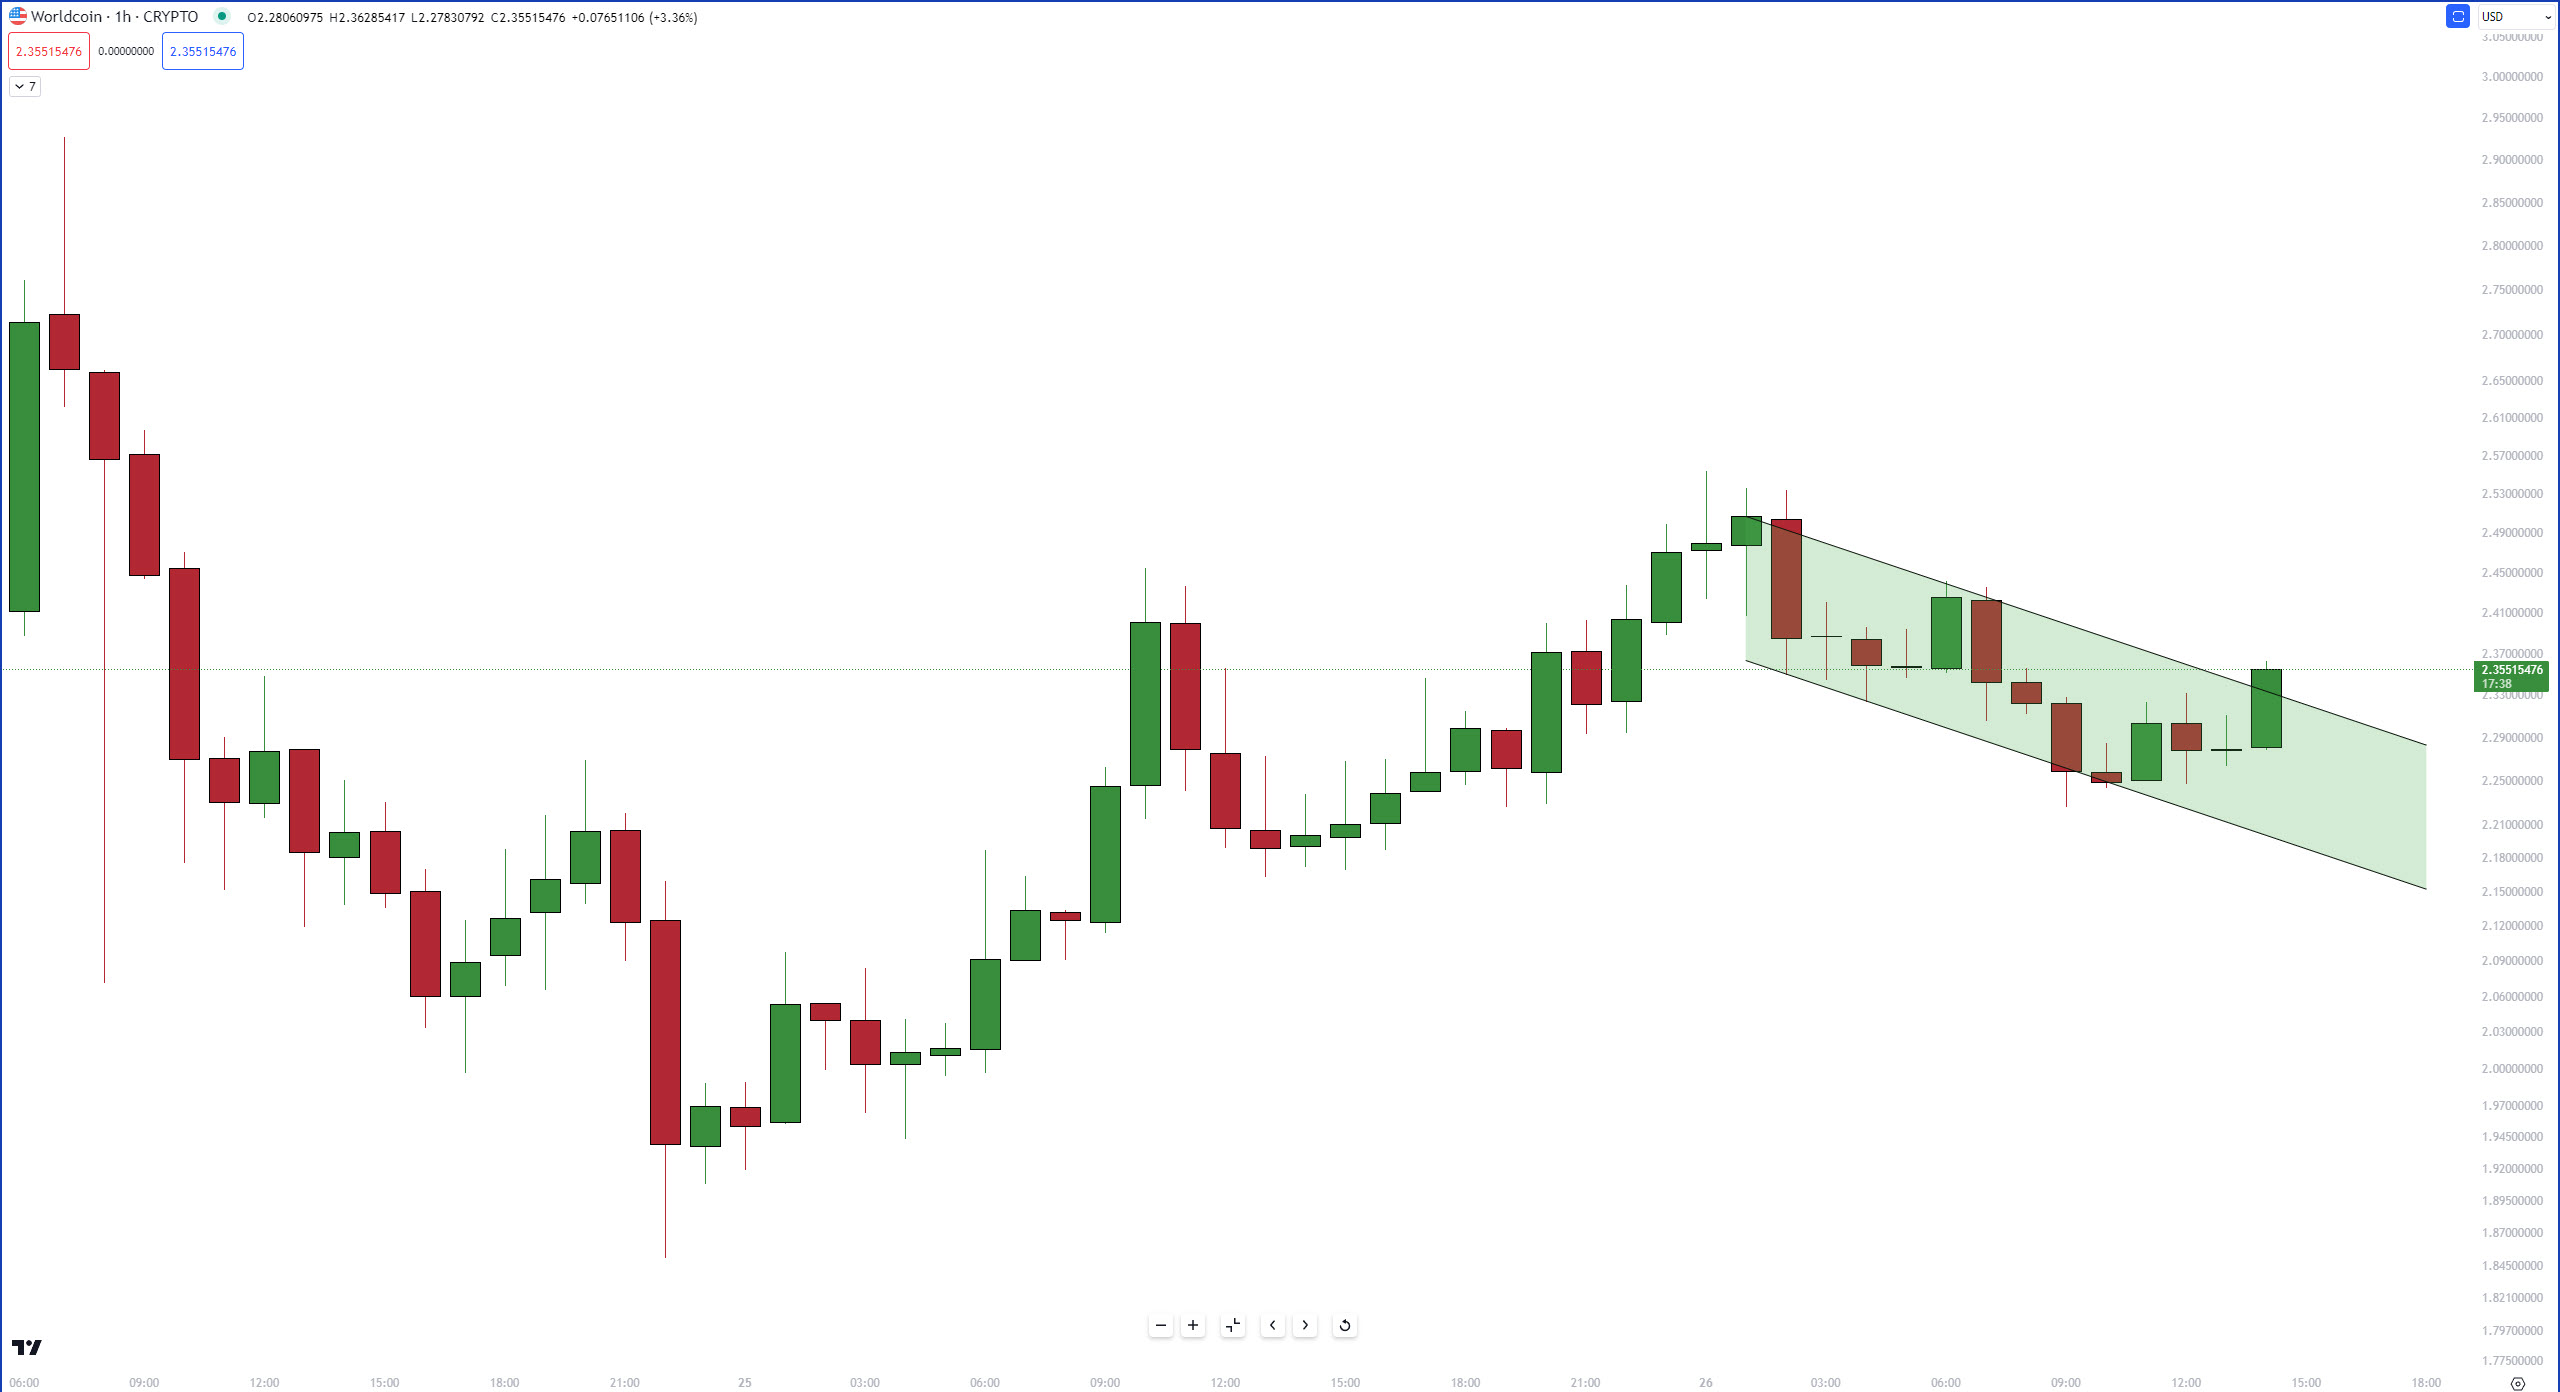
A bull flag currently exists on $WLD‘s hourly chart – but let’s not get crazy. It’s OpenAI and ChatGPT founder Sam Altman’s crypto baby, so some wild swings should be expected.
Dogecoin
From an Ichimoku perspective, $DOGE exhibited some interesting behavior yesterday. 😯
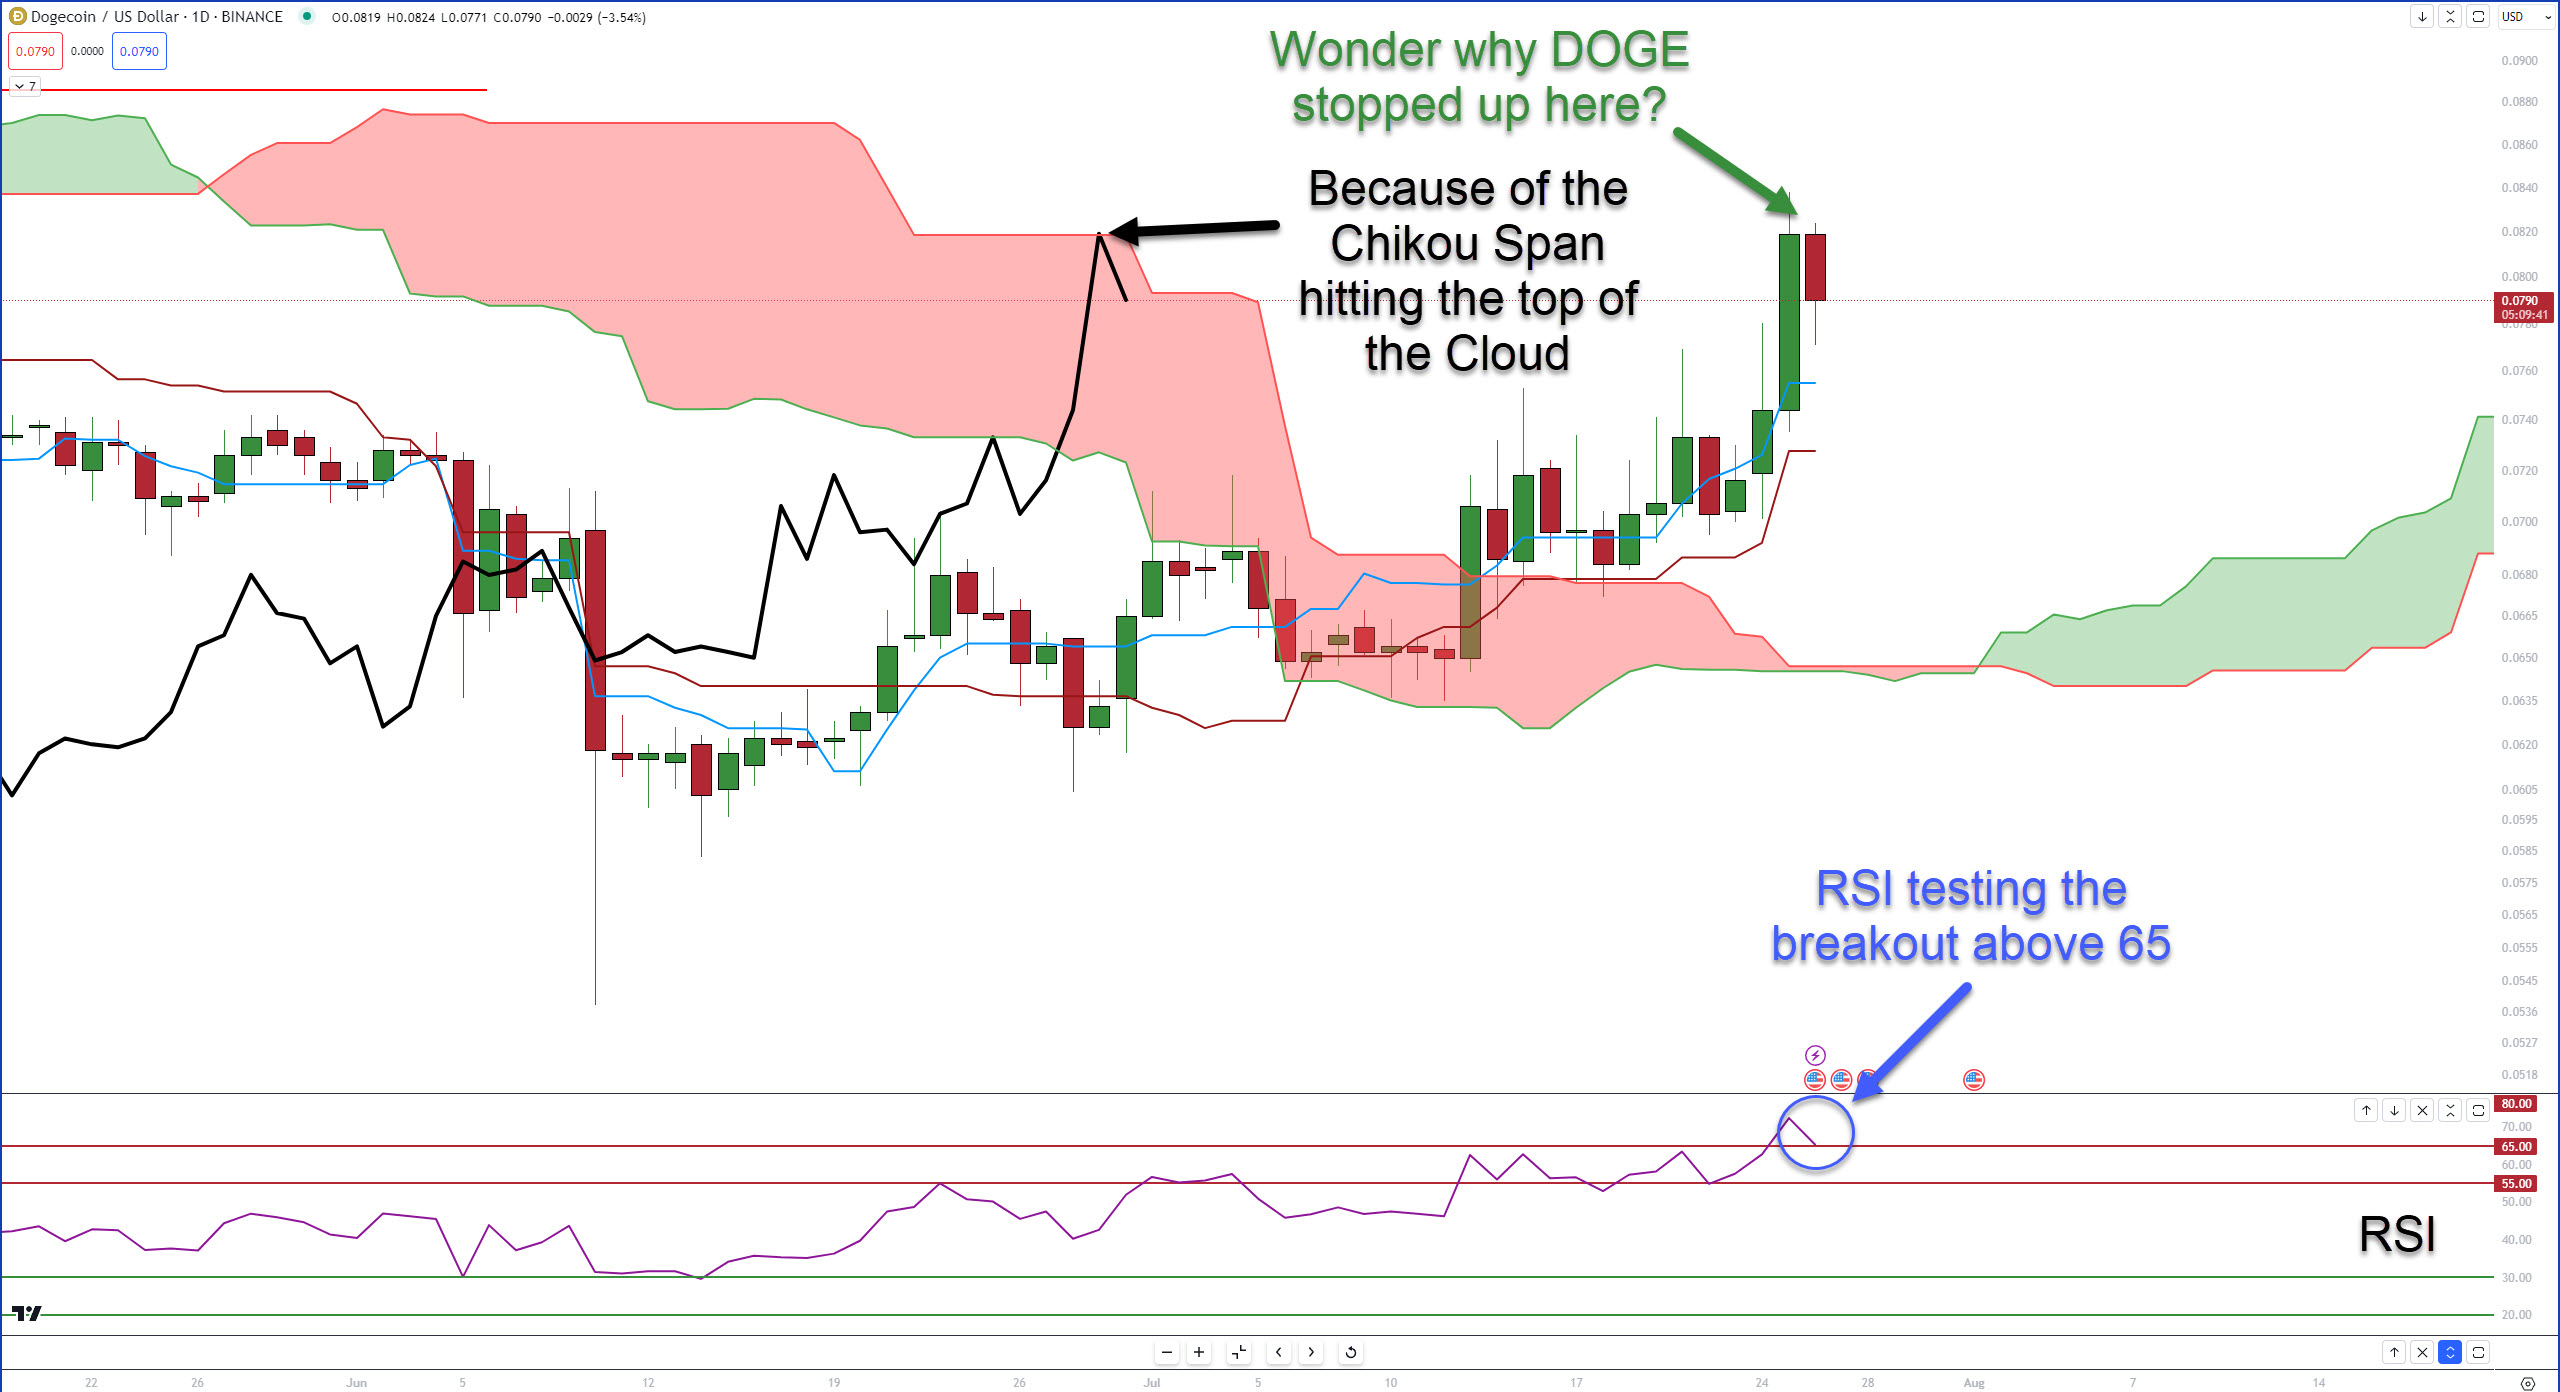
The most potent support/resistance level in the Ichimoku system Senkou Span B. This is precisely where the Chikou Span halted yesterday.
Currently, there’s a noticeable gap between the body of the daily candlestick and the Tenkan-Sen ($0.075). This gap suggests an increased likelihood of the price moving back into equilibrium to that support level.
Looking ahead, another crucial piece of Ichimoku data to observe is the Kumo Twist, which will occur on August 1. The theory proposes that if there’s selling pressure on Dogecoin leading up to the Kumo Twist, a brief low could occur.
Conversely, a strong and sustained upward movement leading into the Kumo Twist could indicate a short-term swing high.
Analysts are also keeping a close eye on the daily Relative Strength Index (RSI) for Dogecoin. For the first time since April 3, 2023, Dogecoin’s daily RSI has broken out above the final overbought level in a bear market, which is 65. If the RSI finds support and/or bounces, it could be an early warning sign that a broader turnaround may be on the horizon. 🌆
Ethereum
It’s. Still. There. Inside. That. God. Awful. Cloud. 😢
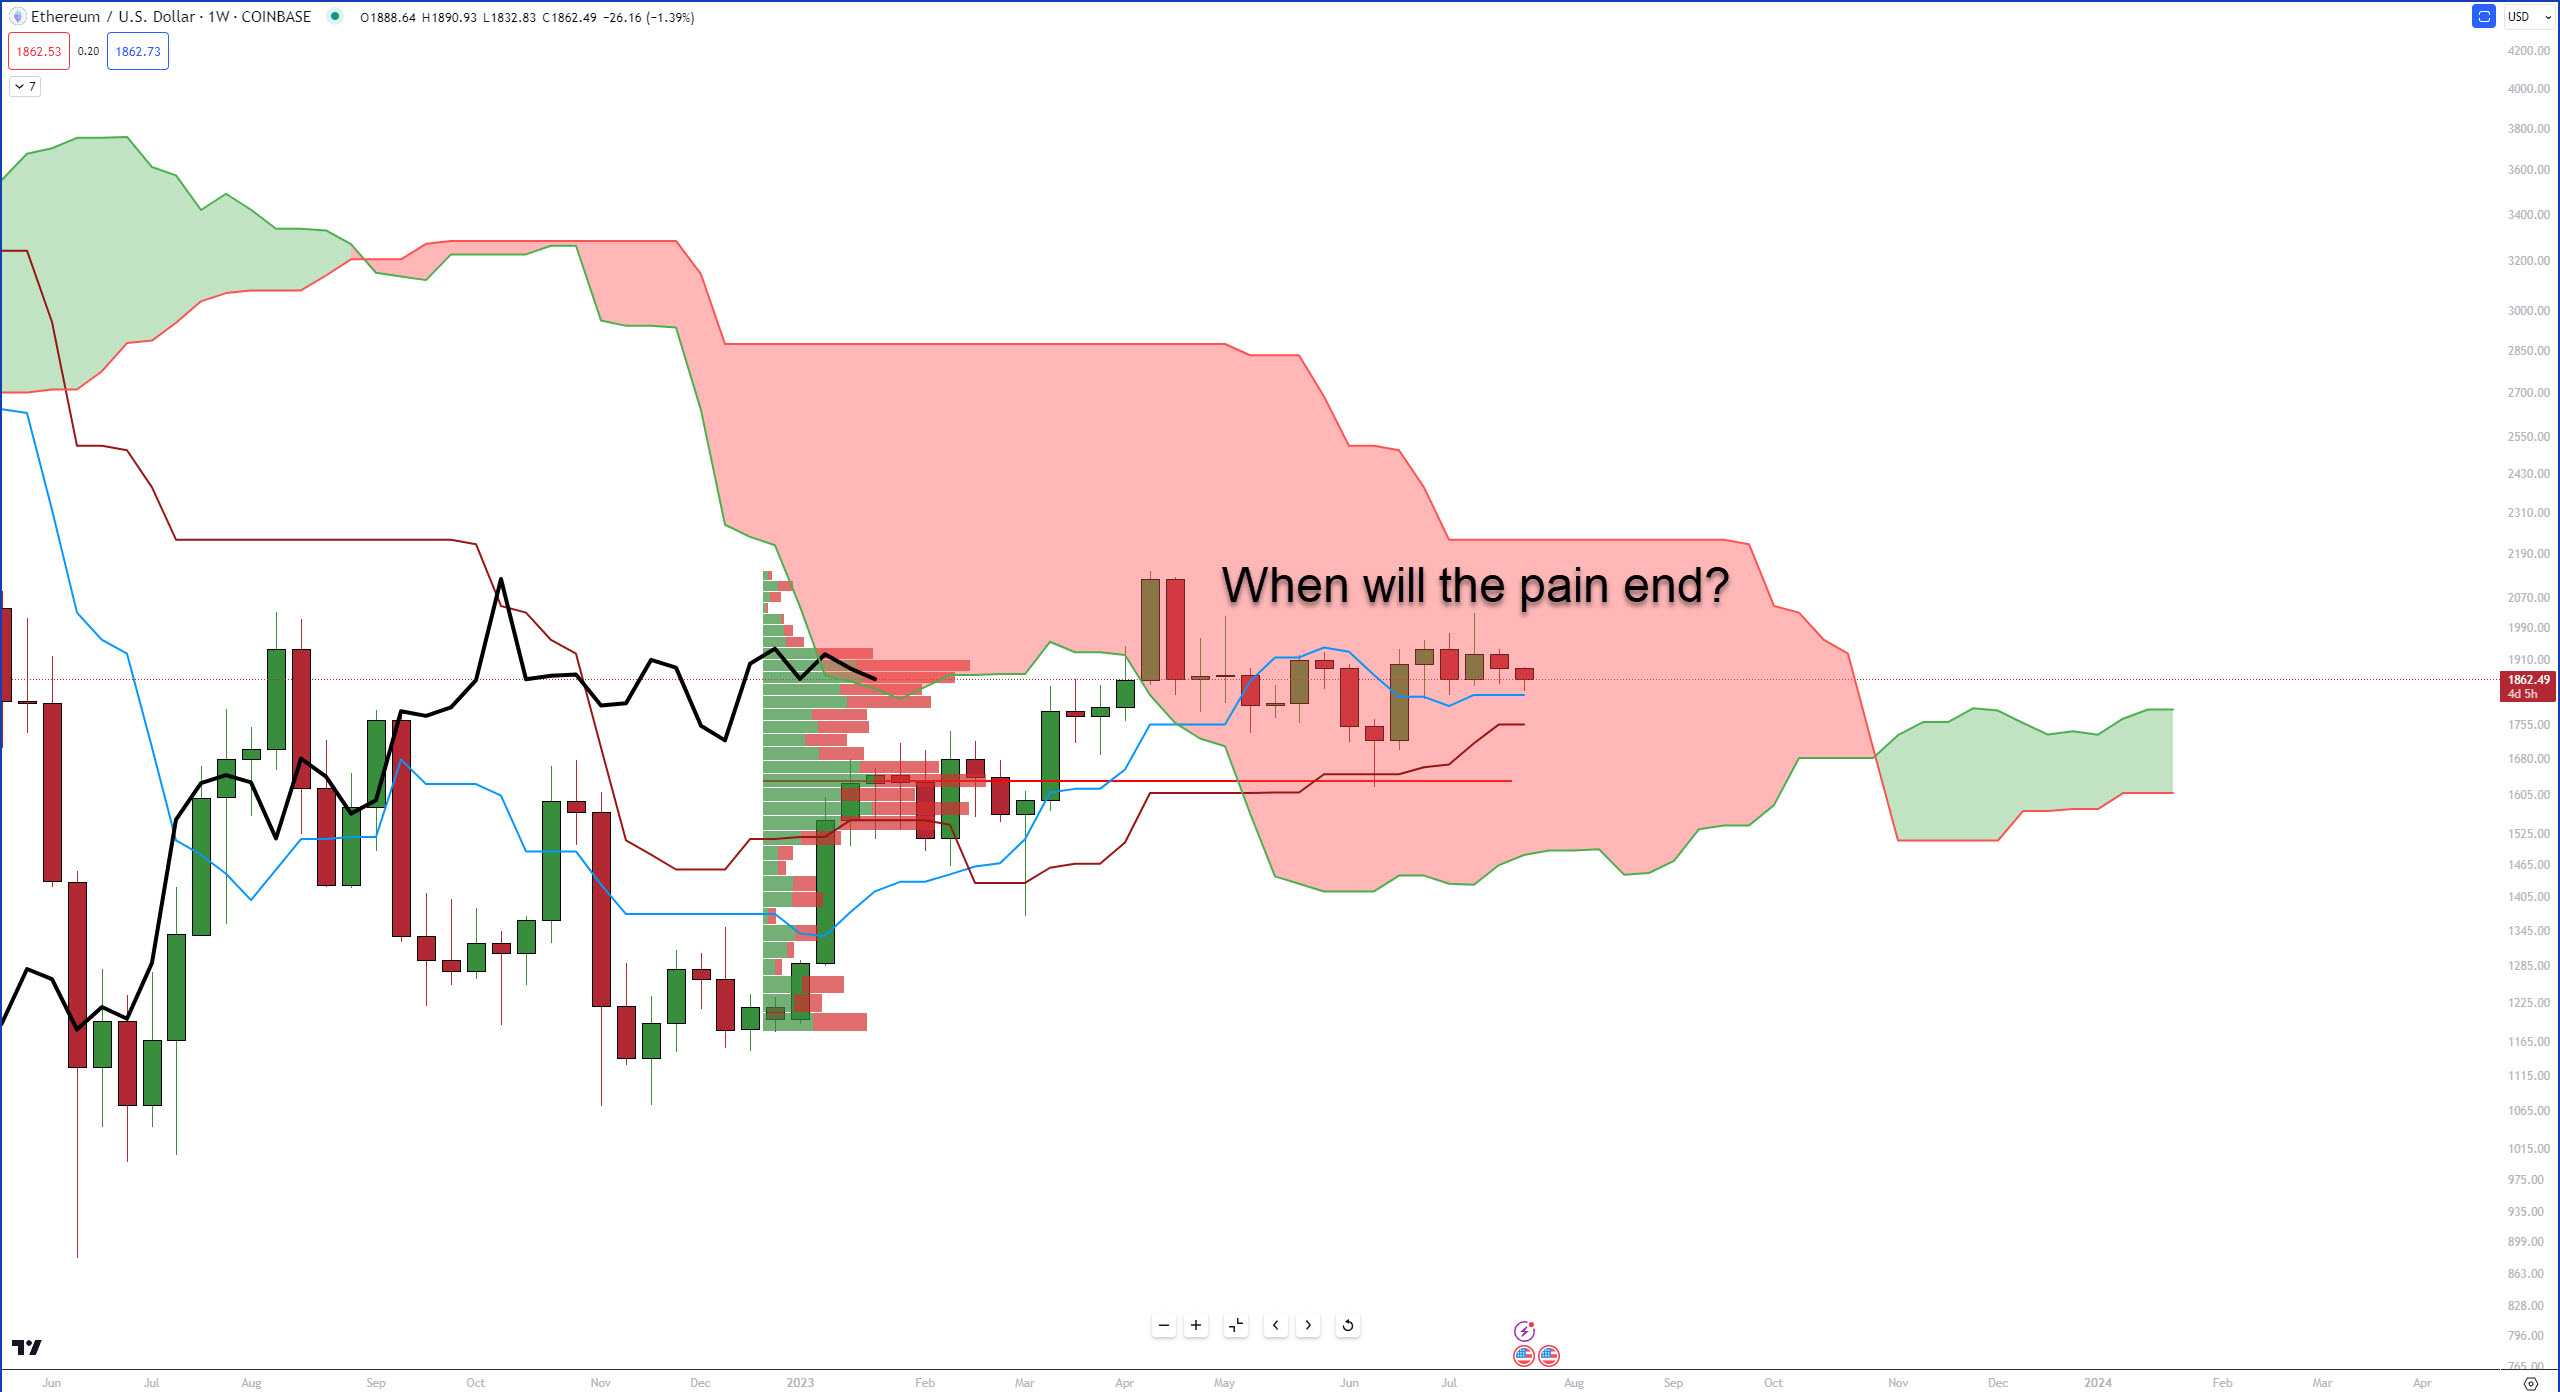
And that’s pretty much all the analysis needed on this POS of an Ichimoku chart.
Seventeen weeks of Ethereum sitting inside the Ichimoku Cloud has made $ETH bulls and bears more pissed off than a squirrel that can’t remember where it stashed its nuts. ☁️