Technically Speaking – December 22, 2023

Here are two of the biggest questions rattling through every crypto trader and investor’s head:

  1. This rally is awesome, but can it keep going?
  2. We’re probably going to see a flash crash/pullback, right?

Let’s take a peak at Ethereum and see why there’s a sense of indecision out there.

Ethereum

$ETH‘s monthly chart is probably one of the most ‘volatile’ looking charts out there. 

ETHUSD Monthly Chart – Click to enlarge.

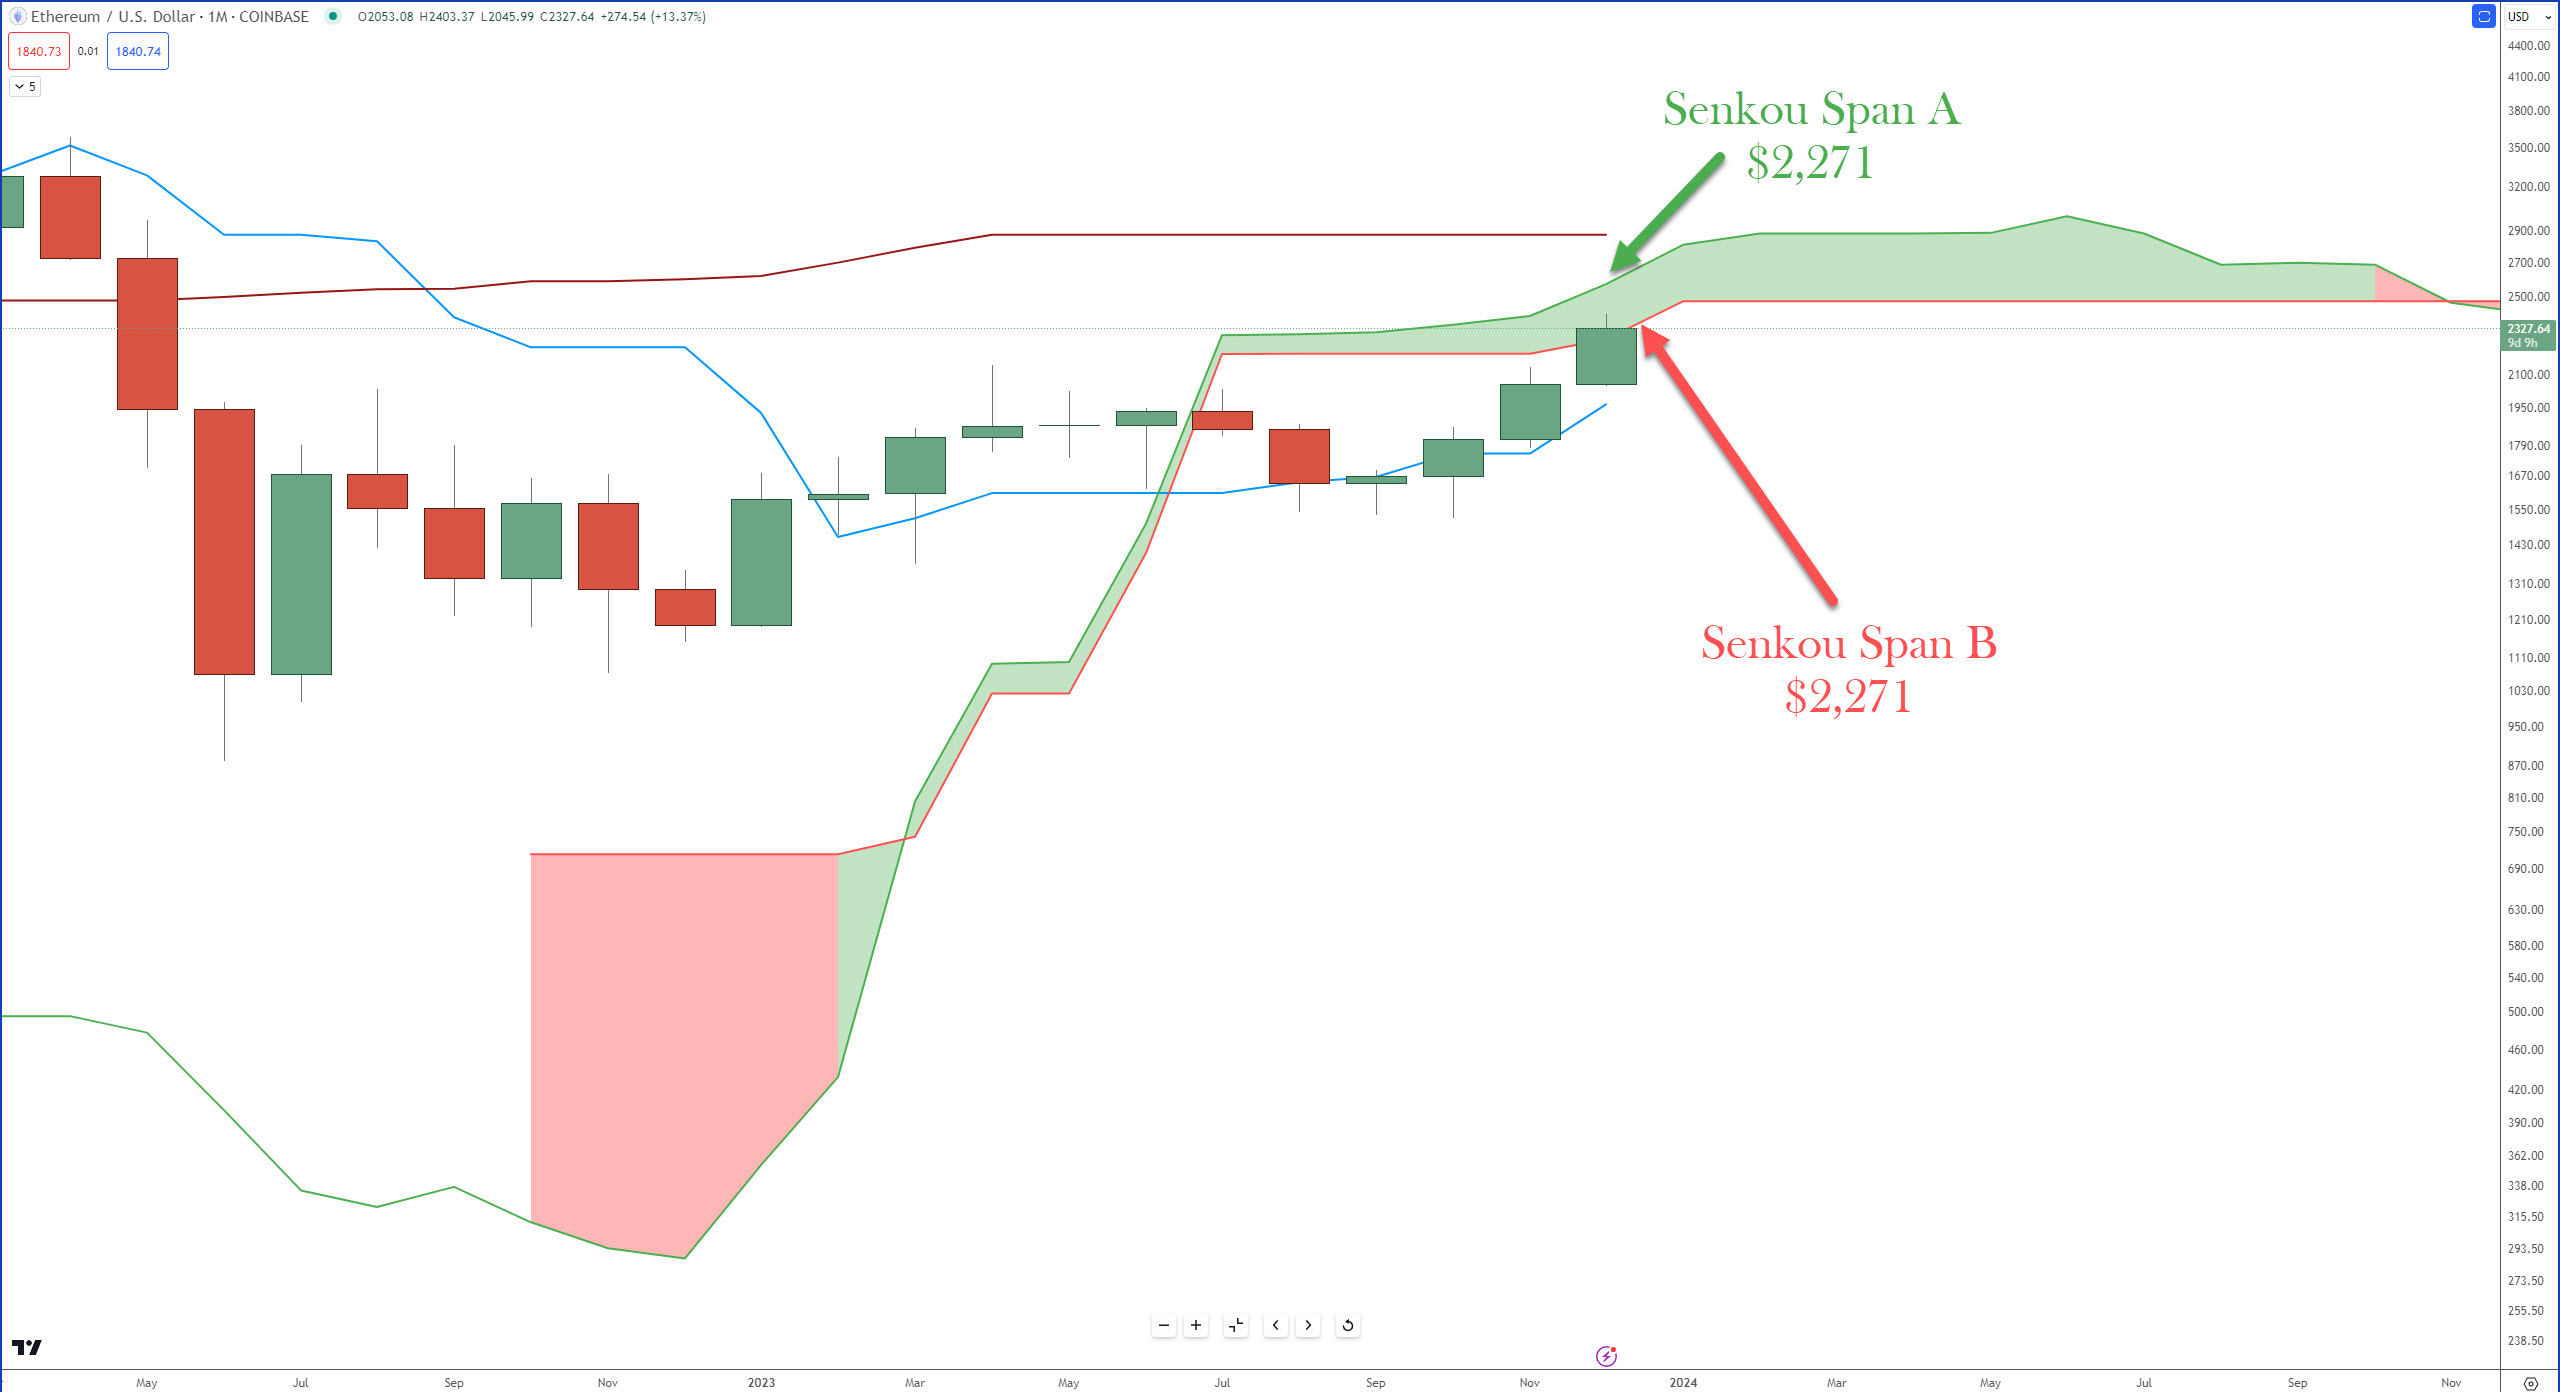
Bulls are attempting to push Ethereum above Senkou Span B – the strongest support/resistance within the Ichimoku Kinko Hyo system – and have a week left to do it. 

Now let’s look at the weekly chart:

ETHUSD Weekly Chart – Click to enlarge.

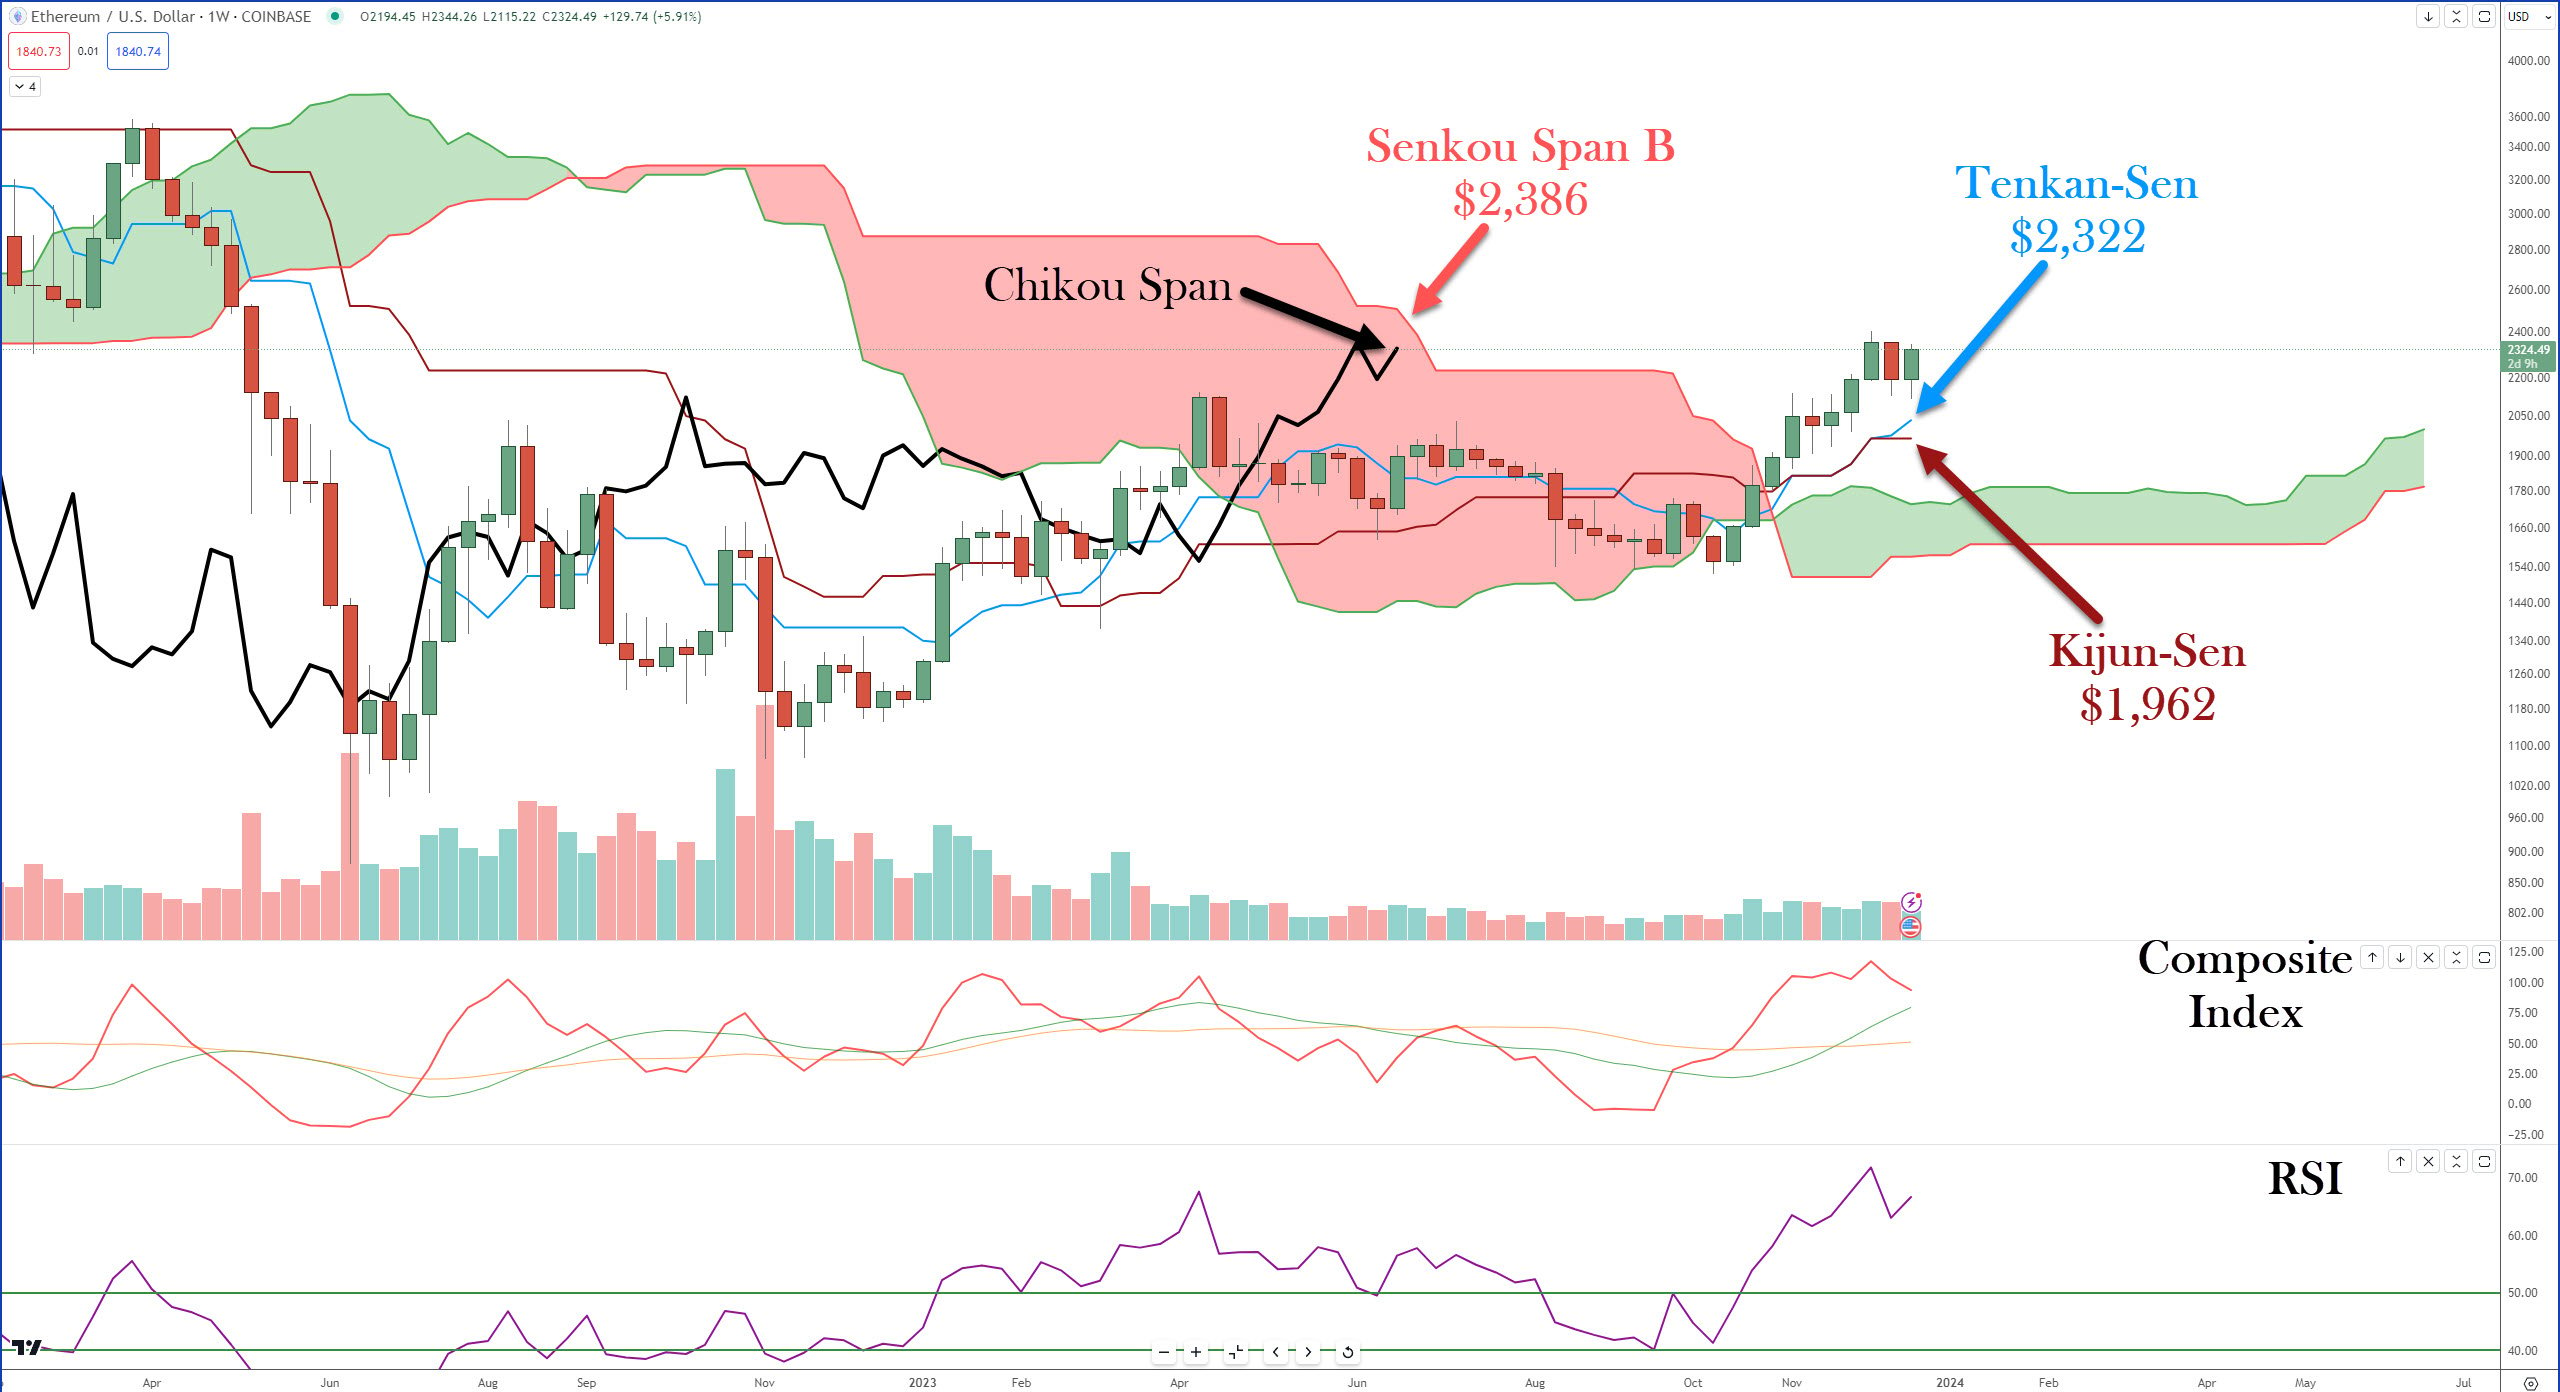
At first, it may look like there’s no resistance ahead for Ethereum – but here’s where the genius of the Chikou Span comes into play. The Chikou Span reacts to the same support/resistance levels as the current price action does. 

That means for the remainder of this week, resistance is Senkou Span B at $2,504 and $2,386 for next week. 

From an oscillator perspecitve, the Composite Index is coming off of the highest levels since January 2021 – that by itself doesn’t mean a pullback is imminent, it may just signal a pause. 

And a pause or consolidation might be the name of the game. The RSI just converted into bull market conditions. 

Keep an eye on Ethereum’s weekly chart for a test of the Tenkan-Sen and Kijun-Sen as support. If this happens, check the RSI. If it’s between 40 and 50, it’s an ideal support level for bulls to maintain to push ETH’s price higher. 

FYI

As we transition into a long weekend and the Christmas holiday, expect to see some shenanigans on the bullish and bearish side of the market. 

More in   Crypto

View All

BlockFi Customers Rejoice!

BlockFi’s customers might finally feature a financial comeback, thanks to a deal with FTX and Alameda Research. 😍

How much? Up to $874 million, contingent on court approval. This settlement could be the lifeline for customers left adrift after the 2022 crypto upheaval.

Read It

Bitcoin Blasts TF Off

Alright, now we know this is primarily an equity-focused newsletter. But speculation in the market has been building extensively through the last few months, and there’s no better vehicle to visualize that than one with no intrinsic value. 😆

Ok, you had to let us get one joke in there. After all, we just said what we were all thinking but wouldn’t say out loud. Let’s dive into some wild stats. 👇

Read It

Bitcoin in March: A Data Dive into Historical Performances

Here are some interesting stats on how Bitcoin performed historically in March. 📚

Bitcoin closed March in the green four times versus eight times in the red.
In the green months, Bitcoin showed off with an average percentage gain of +48.91%.
On the downside, the average percentage loss during the red months was -15.62%.

Read It

BlackRock’s Bitcoin ETF Surpasses Silver Trusts with $10 Billion in Assets

When the first gold ETF came out, it took a couple of years to reach $10 billion in AuM (assets under management). How long did it take Blackrock’s $IBIT? 2 months. 😱

Bitcoin spot ETFs have now eclipsed the largest silver trusts regarding assets under management (AuM), setting their sights on surpassing gold trusts next. According to recent data from HODL15Capital, BlackRock’s IBIT has achieved an impressive milestone, amassing an AuM of $10.03 billion, translating to a remarkable year-to-date (YTD) increase of 35.2%.

Read It