Welcome to the Stocktwits Crypto Data Dive for Week 51 of 2022!
This is the fourth crypto newsletter of our new Saturday edition of the Litepaper that we’re testing out through the end of the year. 👍
The data-centric issue aims to keep track of the overall crypto market’s progress and highlight new and old trends. It’s very similar to The Daily Rip’s Saturday issue, which tracks the performance of the top stocks in the S&P 500, Nasdaq 100, and Russell 2000. 🤩
The Stocktwits Crypto Data Dive serves three main purposes:
- Tracks the crypto total market cap every week.
- Tracks the 25 best-performing cryptocurrencies of the week.
- Tracks the top 10 cryptocurrencies in each of the three best-performing indices of the week. Our custom indices include “Proof of Work,” “Web 3,” “Smart Contracts,” and more!
So without further adieu, let’s get into the data from week 51:
Total Market Cap
Total Market Cap Update
What is the broader trend within the crypto market? The simplest way to track that is using a total market capitalization chart. So let’s see what we’ve got. 🔭
The continued fall from $2.25 trillion at the beginning of 2022 has certainly been painful for short-term bulls. The market bottomed out (so far) in the $727 to $745 billion value areas.
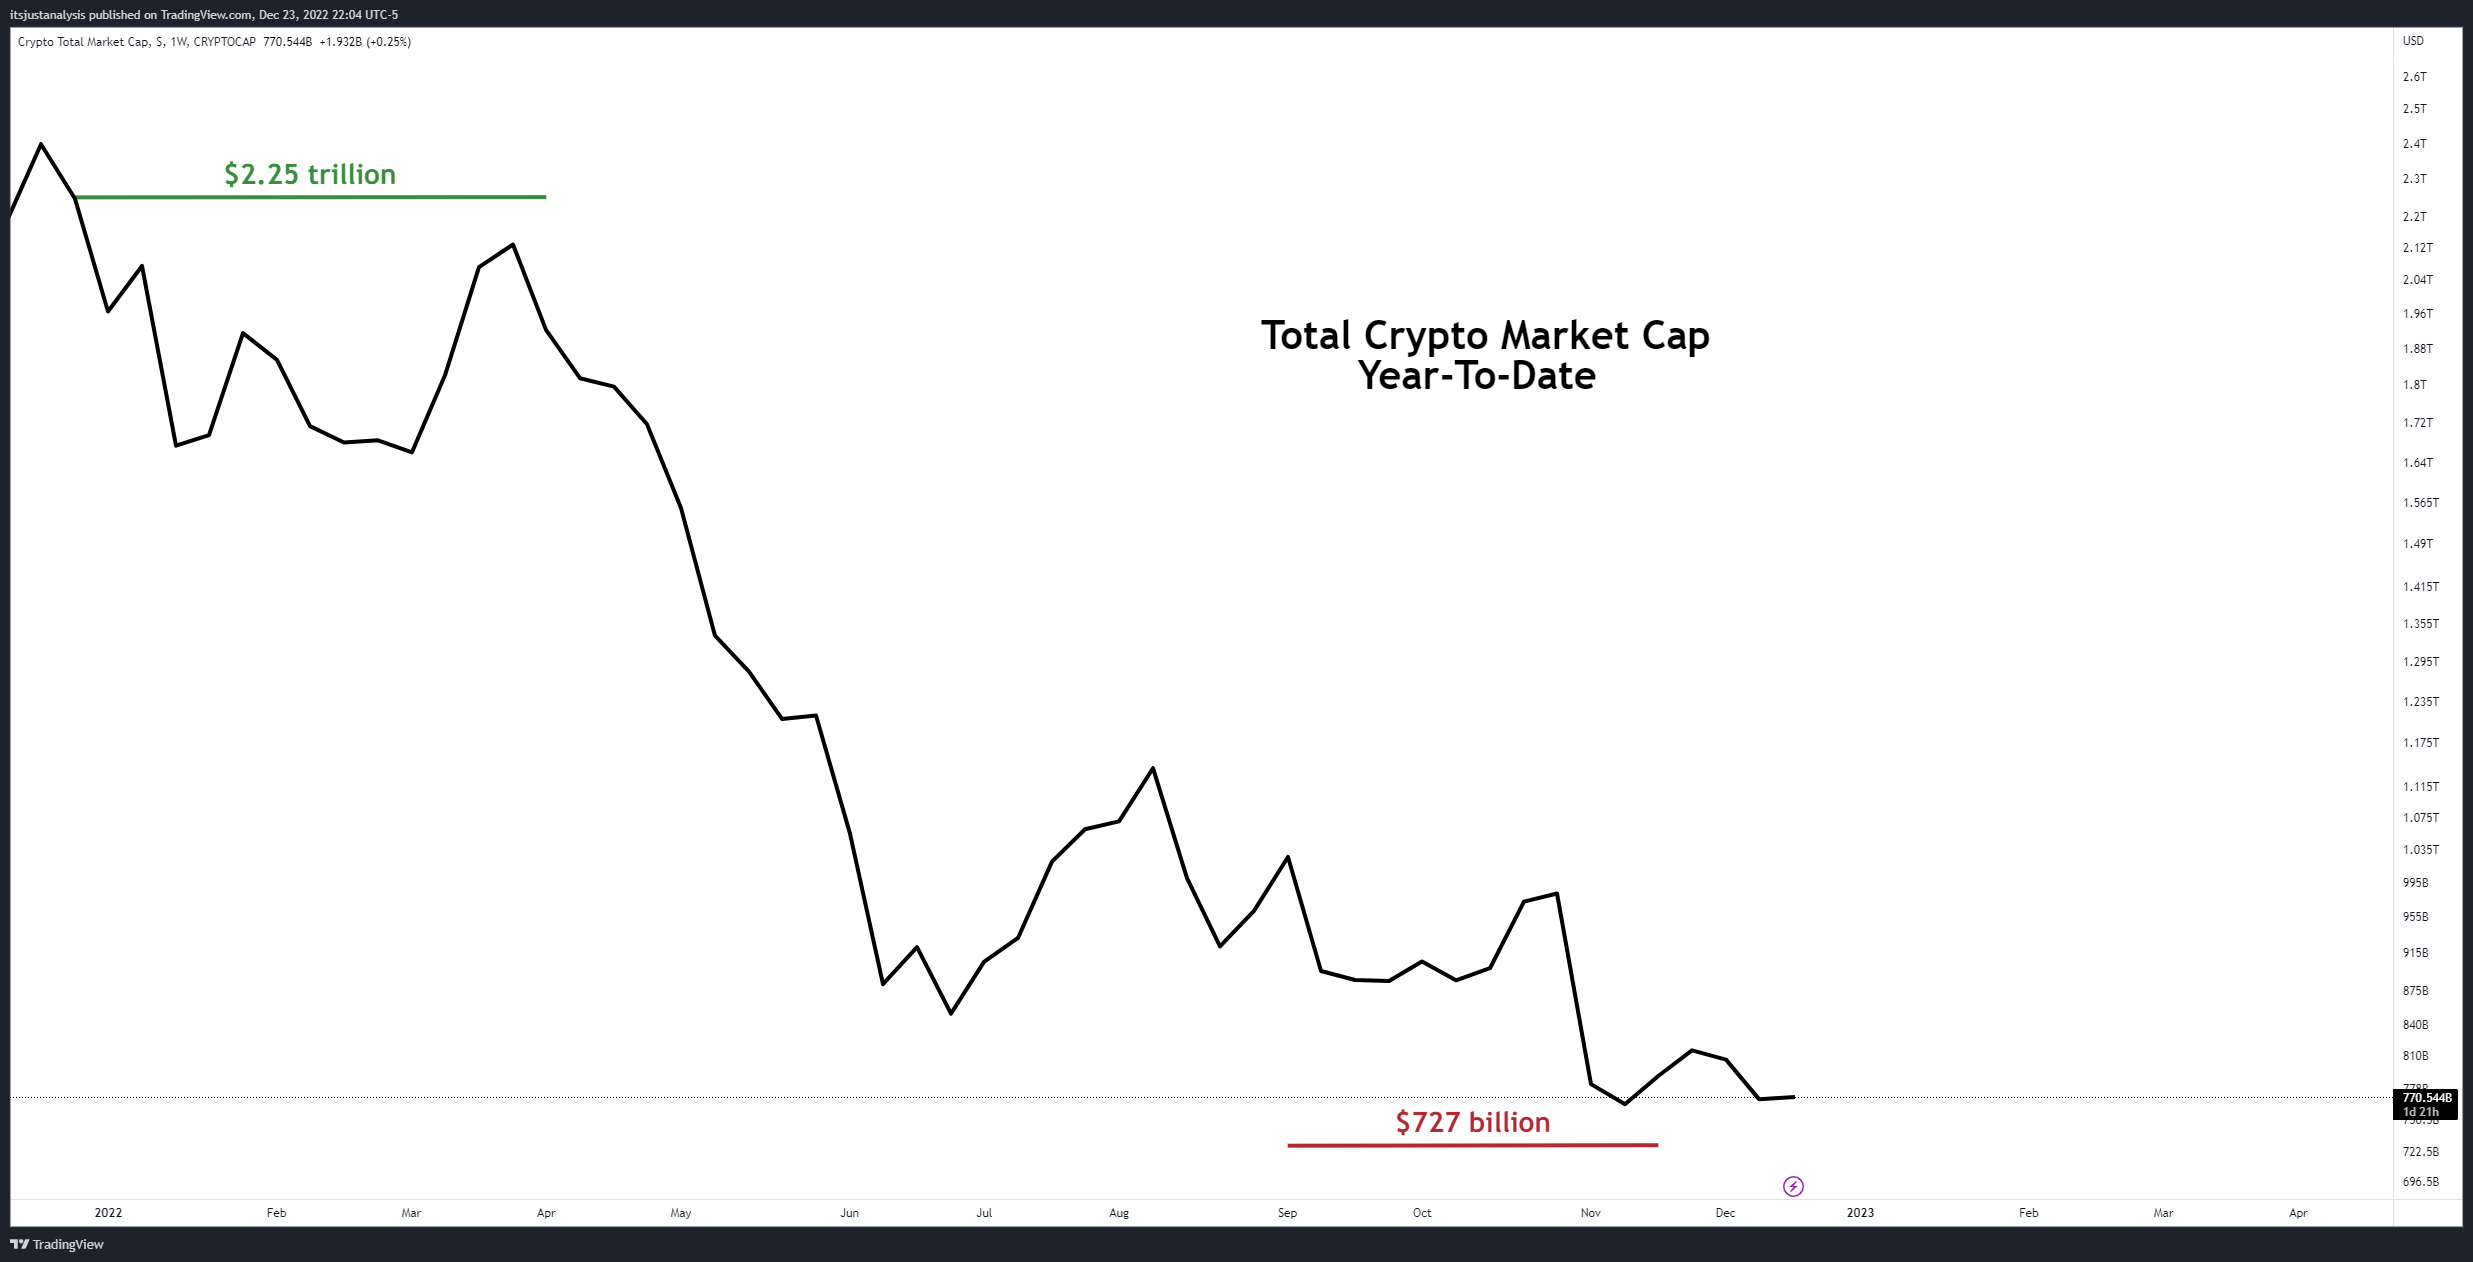
Last week was a blood bath, but this week was a little more tame. The market has flattened out, even showing a slight shift higher – but nothing that would make analysts think a reversal is coming soon.
Analysts still see extreme bearish signals in the technicals and fundamentals, warning that Bitcoin ($BTC.X) could dip below even the $10,000 value area. 🕵️♀️
Top 25 Cryptocurrencies
Top 25 Cryptocurrency Update
No major changes to the list this week.
Cronos ($CRO.X) +4.9% and Ethereum ($ETH.X) +2.5% were the best performers this week. Ethereum also shifted into positive territory for the last 30 days.
Overall, the Top 25 cryptocurrencies were net positive for the week with a gain of +0.57%. 👌
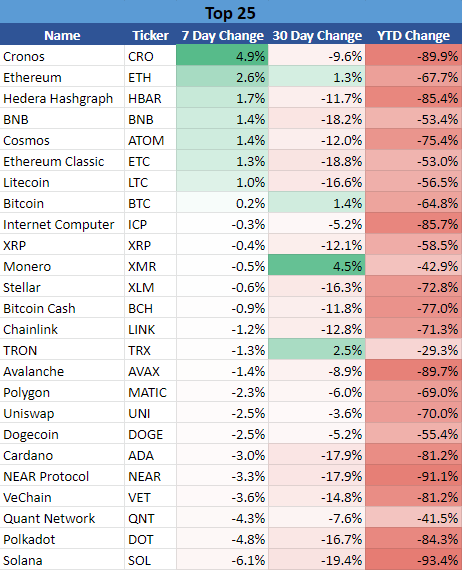
*The universe used to construct the Top 25 list consists of all cryptocurrencies with at least $1 billion market caps, excluding stablecoins.
Stocktwits Crypto Index RRG
Stocktwits Crypto Index RRG
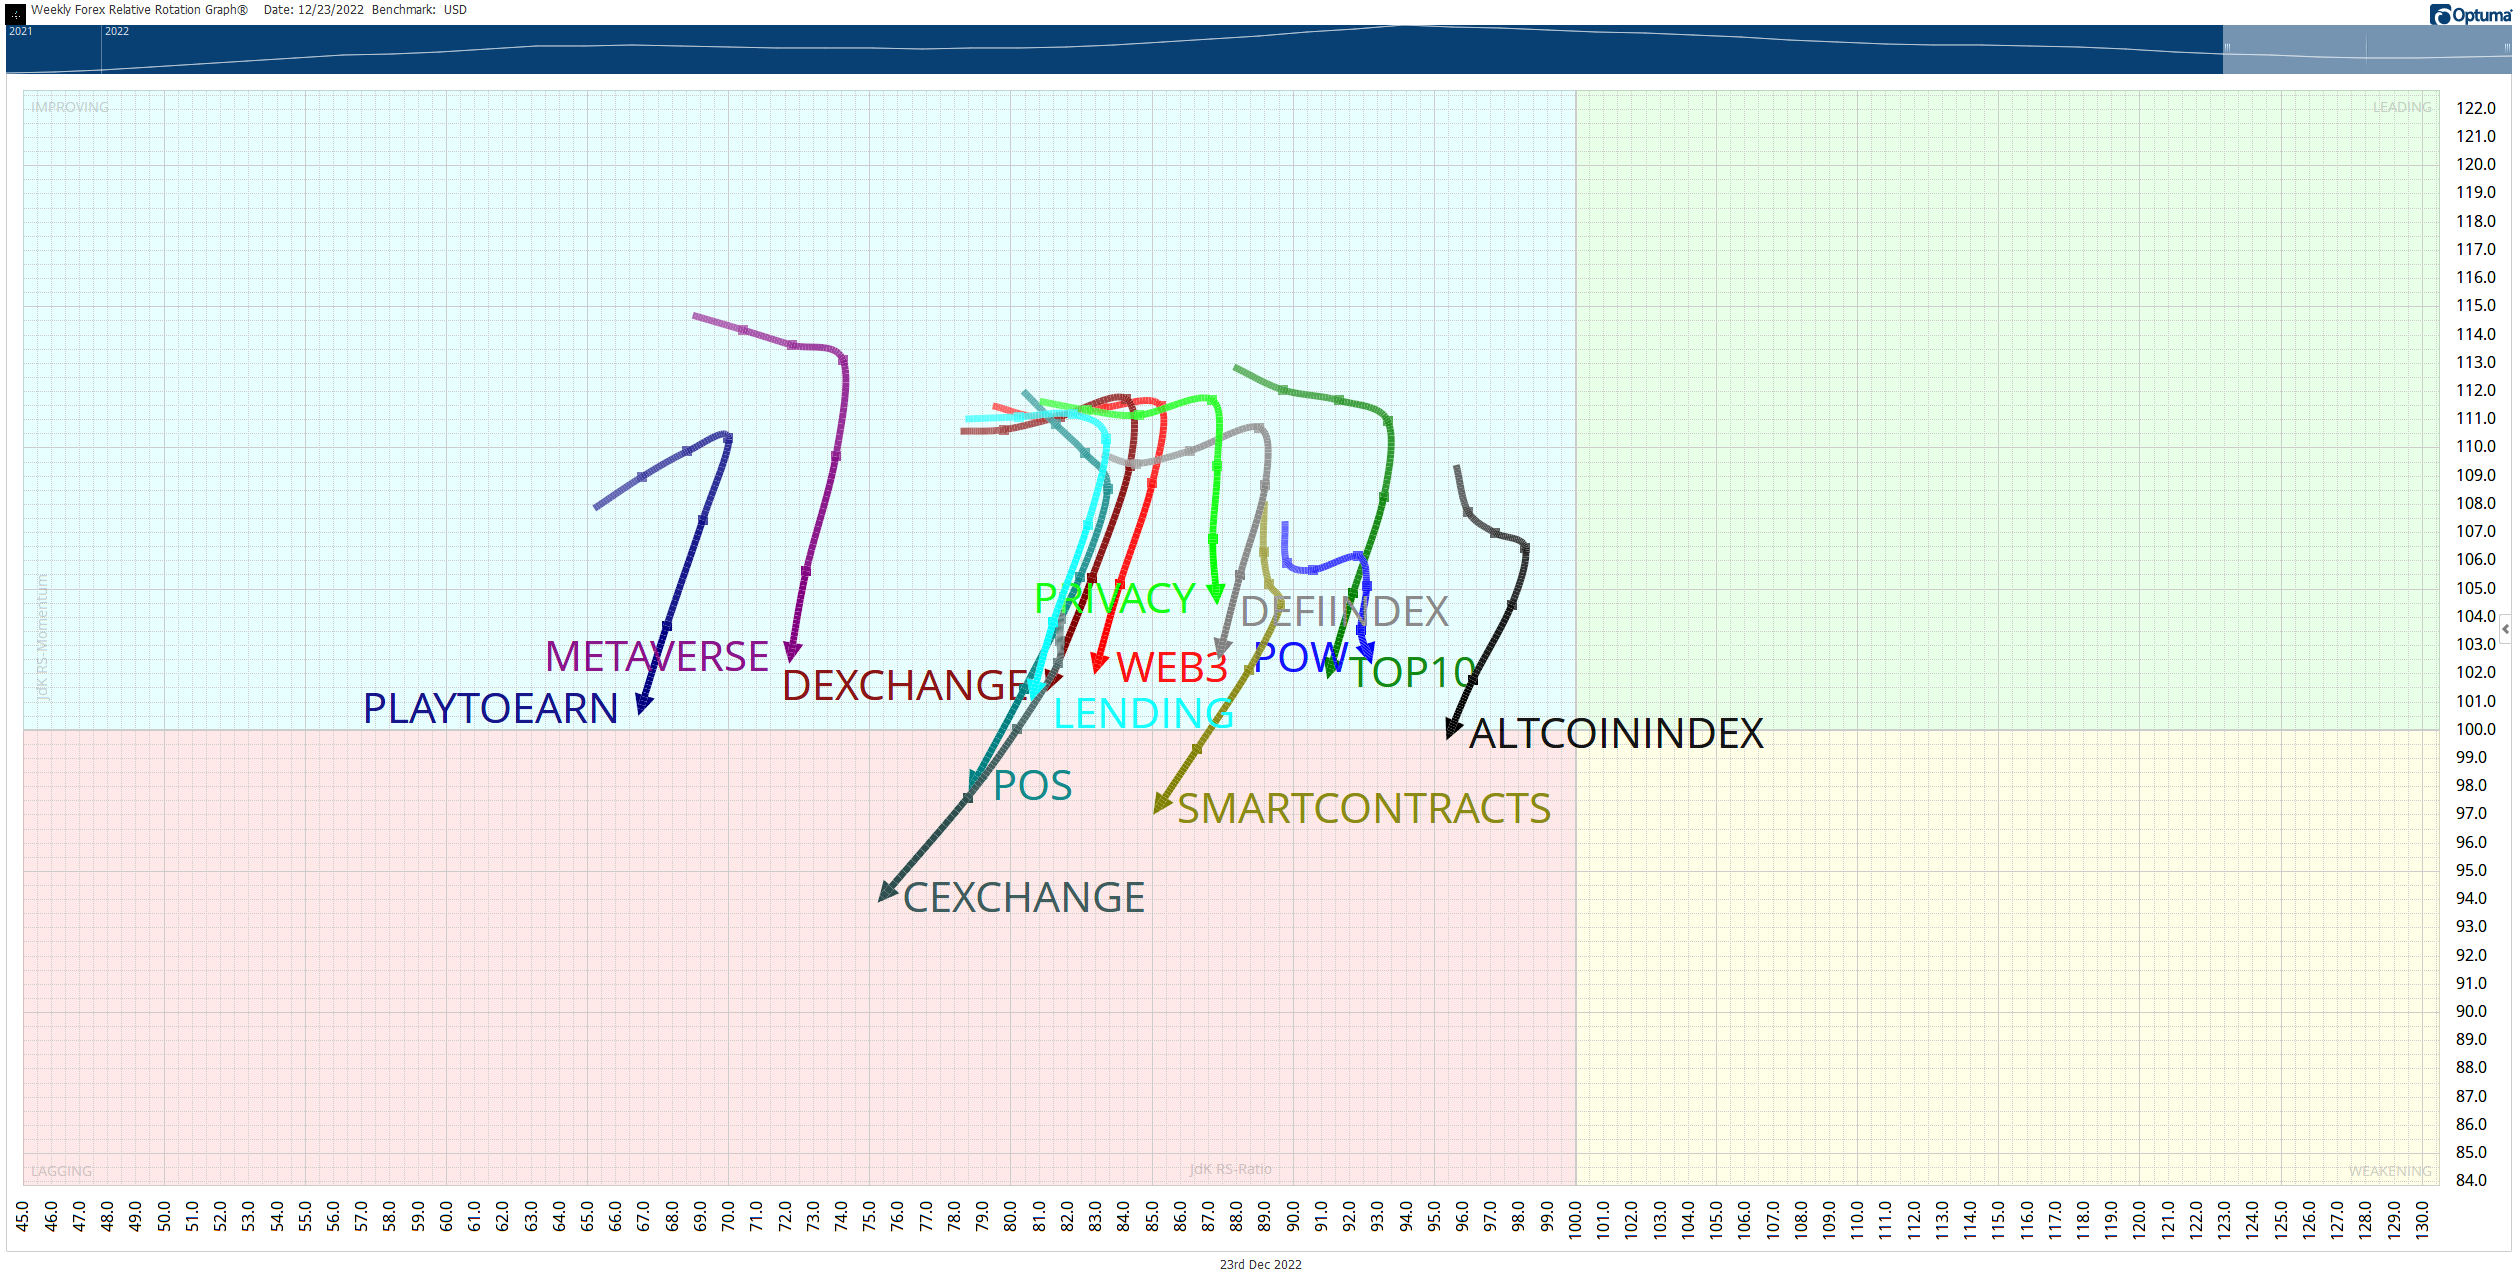
Relative Rotation Graphs (RRG) are useful visual tools to identify how an instrument or a sector performs against a benchmark. The RRG image below shows eleven customized crypto indices. Each contains the top ten by market cap (excluding stablecoins and some exchange-based tokens).
The indices are Proof-of-Work, Web3, Smart Contracts, Decentralized Exchanges (DEX), Non-Fungible Tokens (NFT), Decentralized Finance (DeFi), Proof-of-Stake, Centralized Exchanges (CEX), Privacy, Metaverse, and Lending.
They are rebalanced monthly, and the RRG tracks the last seven days’ performance.
Without going into the nitty-gritty details, the four colored sectors can be thought of like this, so imagine you’re in a race:
- Leading Quadrant (green) – You are in 1st, 2nd, or 3rd place. You are leading the pack. You’re going to medal. Anthems will be sung, tears will fall, and you may or may not pass a doping test.
- Weakening Quadrant (yellow) – You’re losing your momentum and out of breath. You just realized that your spouse or your mom didn’t show up to watch you, sapping your enthusiasm. You’re falling back and in the middle of the pack.
- Lagging Quadrant (red) – You pulled a hamstring. You pulled a Michael Scott and ate five pounds of fettuccine alfredo an hour before your race. You fell down. You’re dead last. No anthems will be sung, but tears will fall, and no one will remember your name.
- Improving Quadrant (blue) – You see your spouse or your mom in the stands. The crowd starts to see you get up. Emotional music begins, and the camera pans to the crowd in slow motion. You’re back on your feet and in the middle of the pack, gaining on the leaders.
The Altcoin index remains the best-performing on the RRG, followed by the Top 10 and Proof-Of-Work – same as last week.
The Centralized Exchanges (CEX) index is still the biggest laggard. The Proof-of-Stake Index dropped in the Lagging Quadrant this week. 👁️
Smart Contracts
The Smart Contracts Index
The Smart Contracts Index includes cryptocurrencies whose blockchains allow for smart contracts. Ethereum and Cardano would be examples of cryptocurrencies that fall into this index.
We construct this index by limiting the assets in this space to a minimum market cap of $250 million.
This is the first time the Smart Contracts Index has led all other indices.
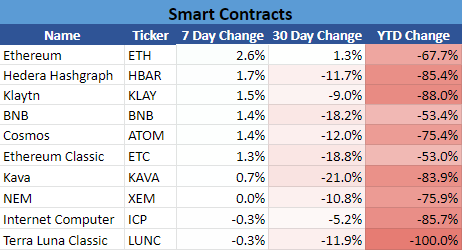
The Smart Contracts Index was the best performer of the week, up +1.4%%.⏳
NFTs
The NFT Index
The NFT Index is made up of cryptocurrencies that offer non-fungible tokens.
We construct this index by limiting the assets in this space to a minimum market cap of $50 million.
There were no major changes to the list this week.
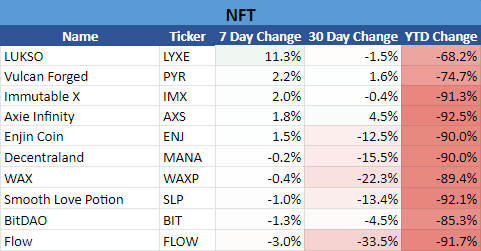
The NFT Index was the second best-performing index, up +0.51% for the week. 🤫
Proof-Of-Work
The Proof-Of-Work Index
The Proof-Of-Work Index is a collection of cryptocurrencies that, you guessed it, are blockchains that use Proof-Of-Work as their primary consensus mechanism. Bitcoin is the most well-known and biggest Proof-Of-Work cryptocurrency.
We construct this index by limiting the assets in this space to a minimum market cap of $100 million.
There were three major changes to the list this week.
Digibyte ($DBG.X), last week’s leader in this index, was kicked out along with Bitcoin SV ($BSV.X) , and Bitcoin Gold ($BTG.X).
Ethereum Classic ($ETC.X), Horizen ($ZEN.X), and Litecoin ($LTC.X) were added.
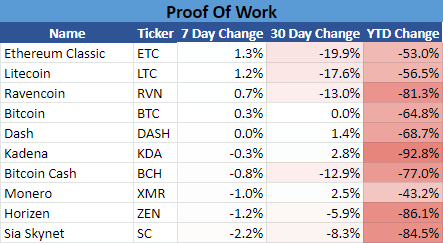
The Proof-of-Work Index was the third best-performing index, up +0.13%. 💪
Bonus Index - Proof-Of-Stake
The Proof-Of-Stake Index
The Proof-of-Stake Index includes any cryptocurrency that has a Proof-of-Stake consensus mechanism.
We construct this index by limiting the assets in this space to a minimum market cap of $100 million.
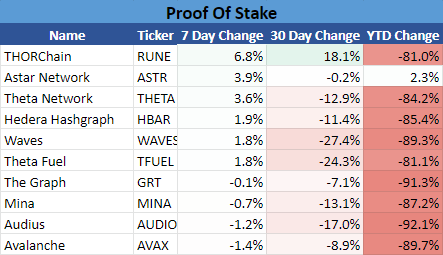
The Proof-of-Stake Index was the worst performer of the week, down -3.17%.
Summary
Putting It All Together
No matter how bad you’ve been this year, Santa doesn’t hate you as much as he hates crypto. 🎅
However, at least this week, Santa didn’t run over crypto with his sleigh, back up, and then let his reindeer stomp on crypto’s head repeatedly like he did last week.
This week he just ran crypto over.
Only 3 out of 11 indices closed in the green this week. 🟩
See You Next Saturday!

Credits & Feedback
Today’s Litepaper was written by Jon Morgan. Let him know how he did: