Welcome to the Stocktwits Crypto Data Dive for Week 10 of 2024! 📊
In this issue, we’ll dive into the data to keep you informed about the progress of the overall crypto market and shine a spotlight on emerging and established trends.
The Stocktwits Crypto Data Dive has three main objectives:
- Tracking the weekly total market cap of the crypto market.
- Highlighting the 25 best-performing cryptocurrencies of the week.
- Monitoring the top 10 cryptocurrencies within various high-performing indices, including “Proof of Work,” “Web 3,” “Smart Contracts,” and more!
We track the performance of these indices from Thursday to Thursday to ensure a more accurate representation and account for weekend volatility.
So, without further delay, let’s jump right into the data from week 10 and explore its intriguing insights! 🚀
Total Market Cap
Total Market Cap Update
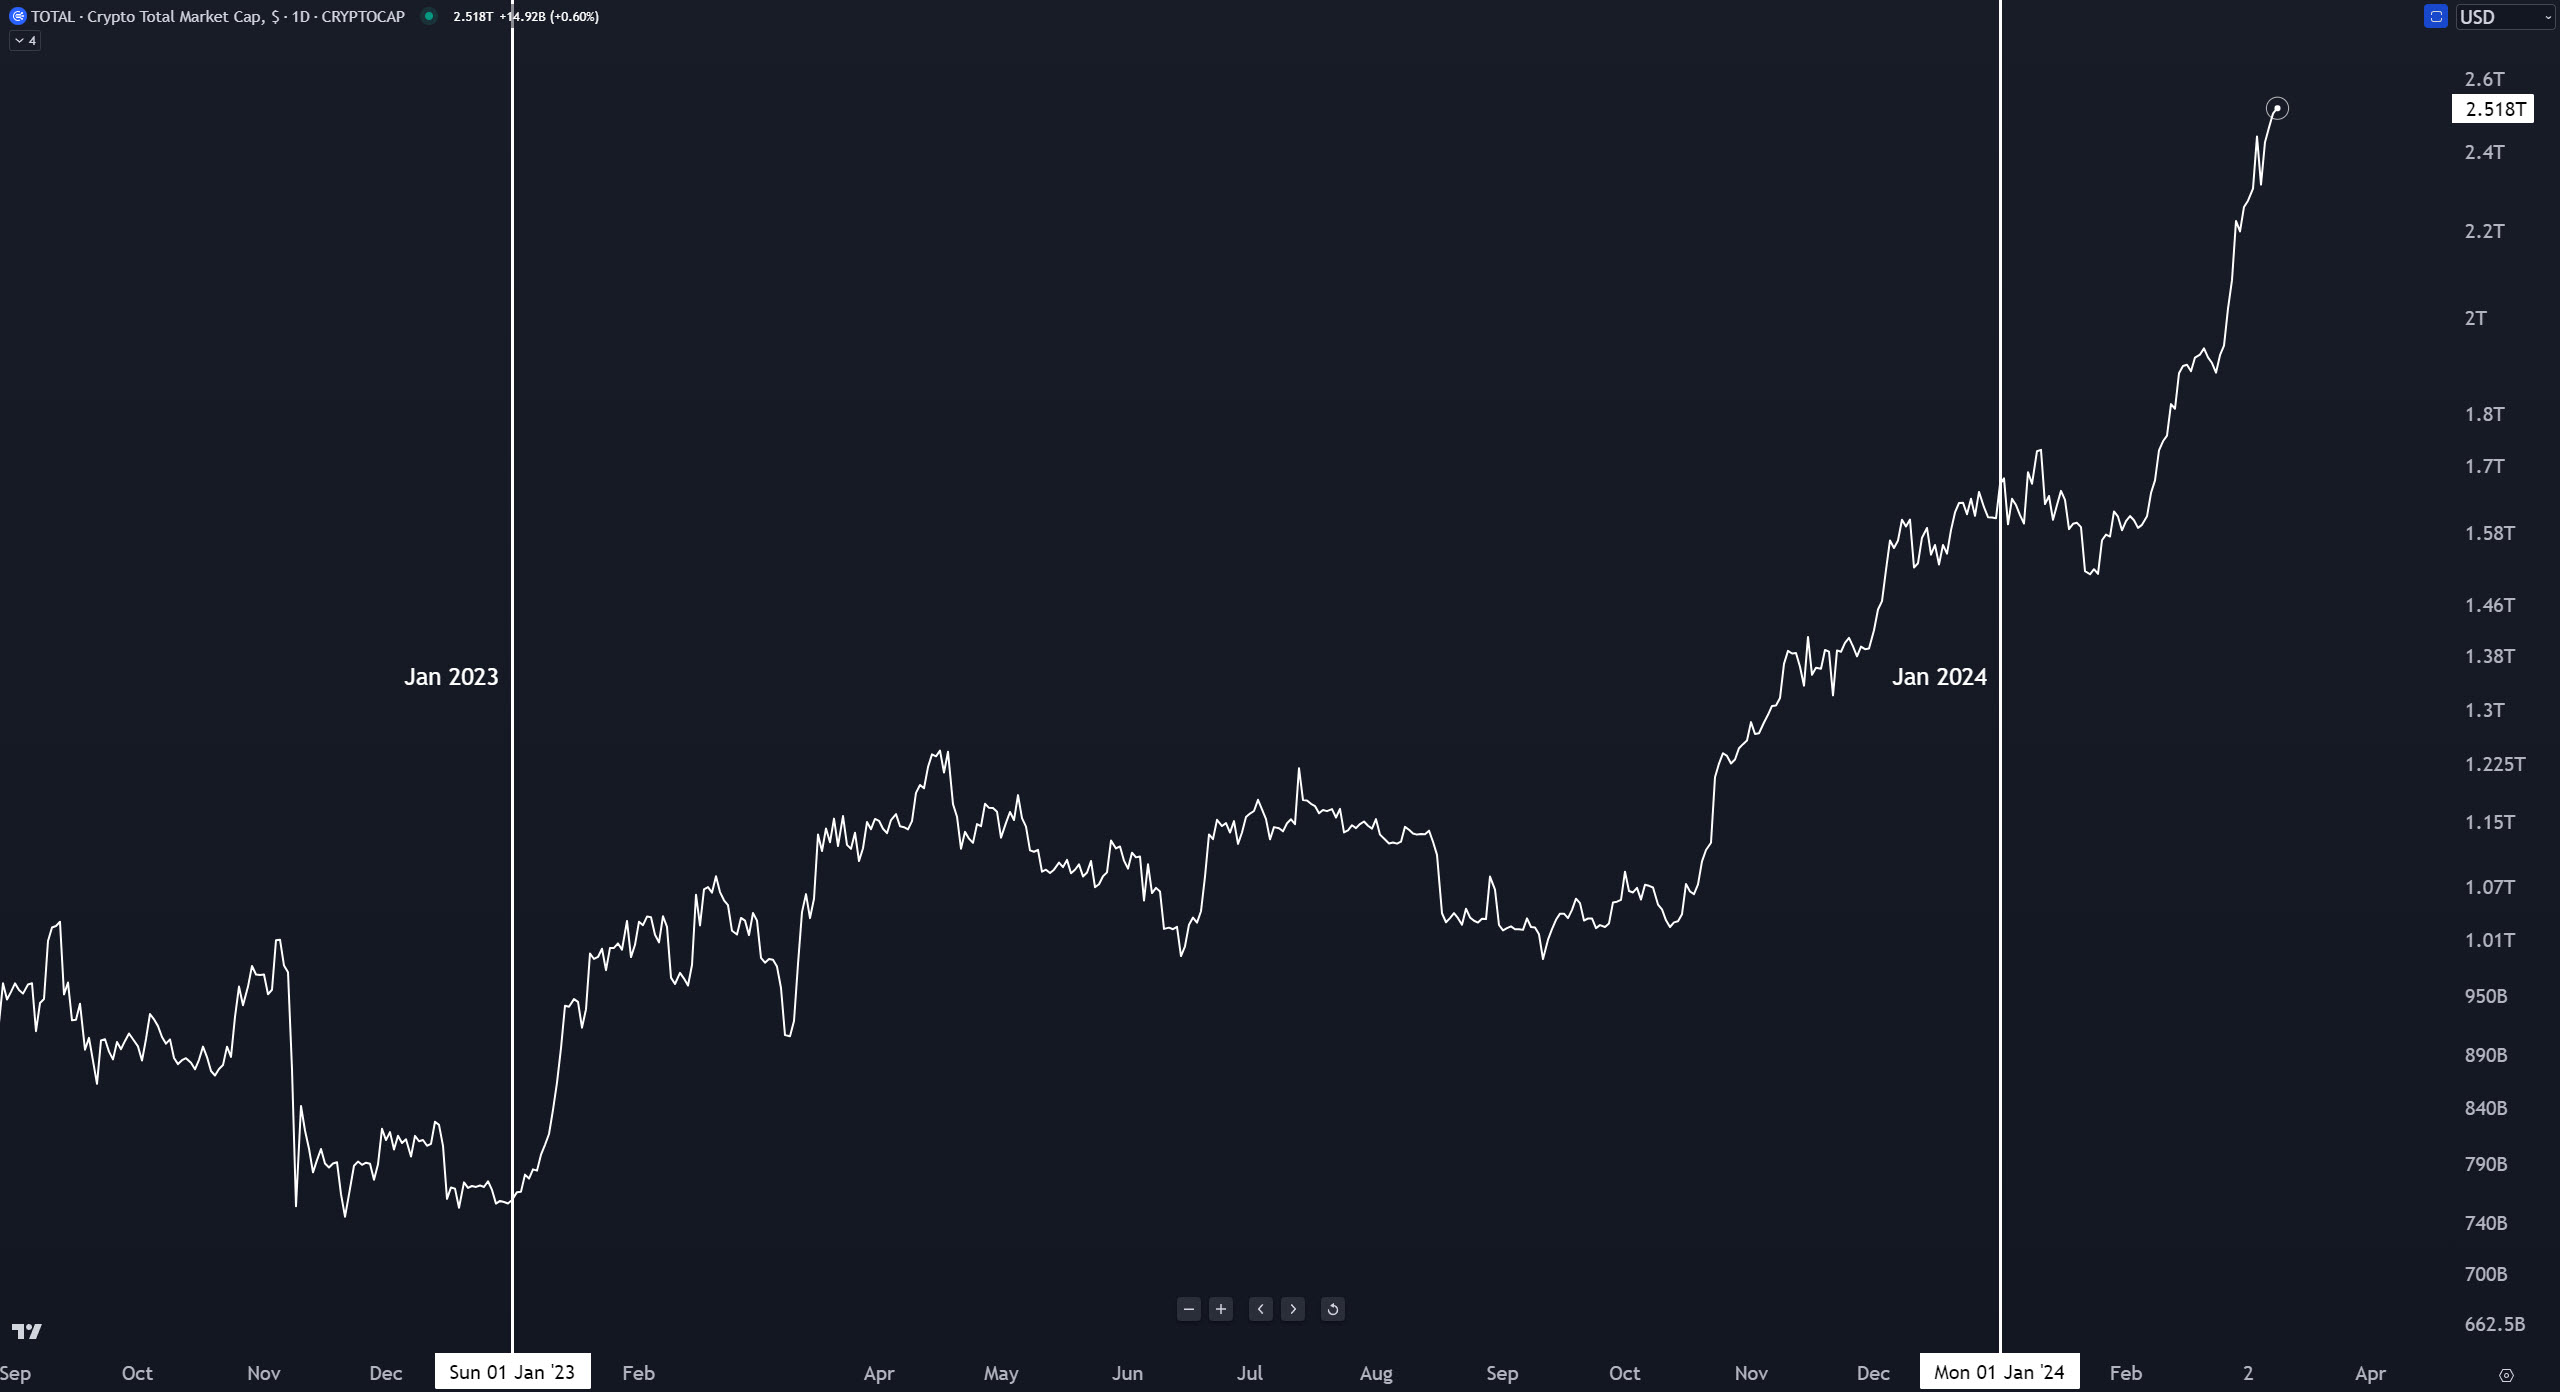
What is the broader trend within the crypto market? The simplest way to track that is using a total market capitalization chart. So let’s see what we’ve got. 🔭
From the highest all-time market cap close of $2.834 trillion, crypto is down -15.01%.
The cryptocurrency market is up +47.98% YTD and +151.36% YoY.
*the price levels and performance values may be very different from what you read in your mailbox vs. what’s happening in the live market. This is especially true when crypto faces a new bull or bear run.
Top 25 Cryptocurrencies
Top 25 Cryptocurrency Update
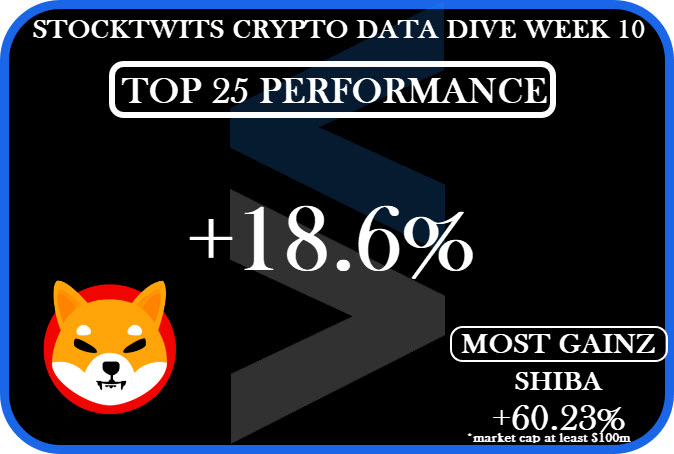
Overall, the Top 25 cryptocurrencies were higher for the week by +17.7% versus -1.4% prior.
*The universe used to construct the Top 25 list consists of all cryptocurrencies with at least $1 billion in market cap, excluding stablecoins.
Stocktwits Crypto Index RRG
Stocktwits Crypto Index RRG
Relative Rotation Graphs (RRG) help us visualize how a currency or sector performs compared to a benchmark – in this case, the U.S. Dollar Index (DXY). Think of the four colored sectors as stages in a race:
- Leading Quadrant (green) – You’re a champ! 🏆 You’re ahead of everyone else, and the crowd is cheering. But watch out; you might be overdoing it.
- Weakening Quadrant (yellow) – You’re slowing down 😓 and losing your lead. Maybe you’re a bit demoralized because your biggest fan didn’t show up. You’re now in the middle of the pack.
- Lagging Quadrant (red) – Disaster strikes! 😱 You’re injured, exhausted, or just made a big mistake. You’re now in last place, and it’s a sad scene.
- Improving Quadrant (blue) – Time for a comeback! 💪 Your motivation returns, the music swells, and you’re picking up speed. You’re back in the middle, catching up with the leaders.
Analyzing the RRG Examples
Example 1: Rapid Rotation
– If an instrument moves quickly through all four quadrants, it could indicate high volatility or erratic behavior. Traders may want to be cautious or use appropriate risk management strategies in such cases.
Example 2: Stuck in the Middle
– An instrument that remains close to the center of the RRG might be in a consolidation phase, lacking a clear trend or momentum. Traders might wait for a decisive move before entering a position.
Example 3: Consistent Leader
– If an instrument stays in the Leading Quadrant (top right) for an extended period, it could signify a strong, sustained uptrend. Traders might consider buying opportunities or riding the trend.
Example 4: Slow Recovery
– An instrument that gradually moves from the Lagging Quadrant (bottom left) to the Improving Quadrant (blue) and eventually to the Leading Quadrant (green) could indicate a slow but steady recovery. Traders might look for potential reversal or bottom-fishing opportunities.
The GIF below shows the past 10 days of movement on the RRG.
The GIF below shows the past 13 weeks of movement on the RRG.
Stocktwits Crypto Index Performance
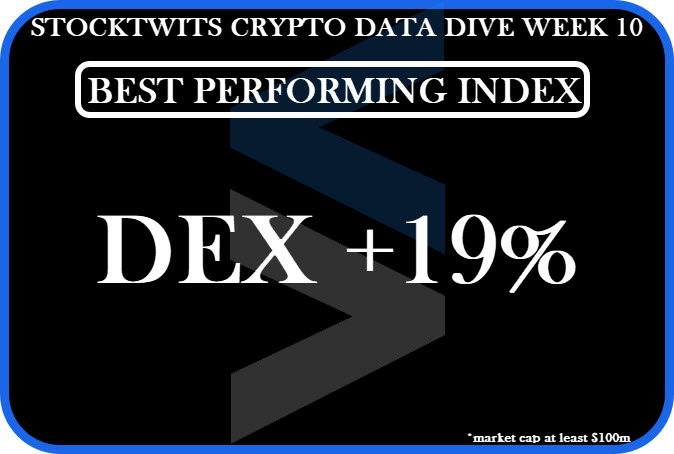
The DEX Index (Decentralized Exchange) comprises the cryptocurrencies and tokens that make up the DEX space.
We construct this index by limiting the assets in this space to a minimum market cap of $100 million.
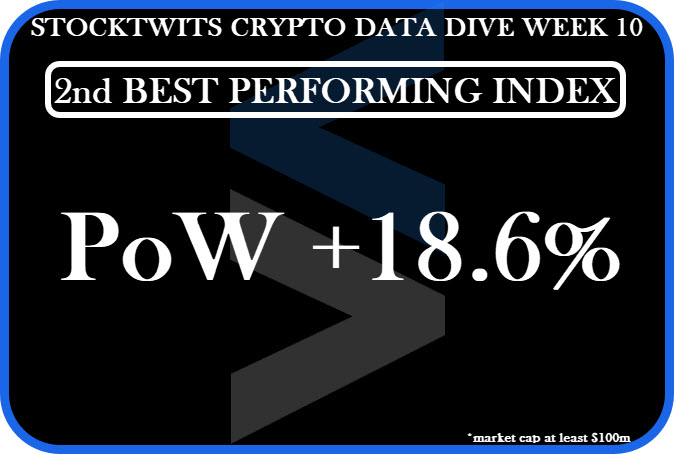
The Proof-Of-Work Index is a collection of cryptocurrencies that, you guessed it, are blockchains that use Proof-Of-Work as their primary consensus mechanism. Bitcoin is the most well-known and biggest Proof-Of-Work cryptocurrency.
We construct this index by limiting the assets in this space to a minimum market cap of $100 million.
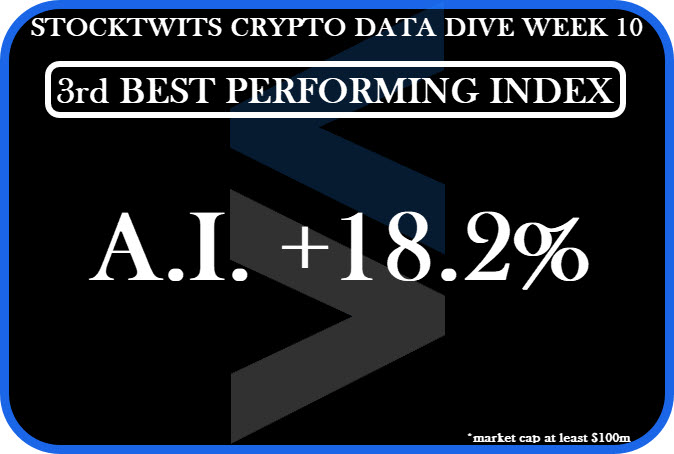
The A.I. Index comprises cryptocurrencies dedicated to making the Battlestar Galactica, 2001 Space Odyssey, I Robot, and the Terminator universes very real.
We construct this index by limiting the assets in this space to a minimum market cap of $100 million.
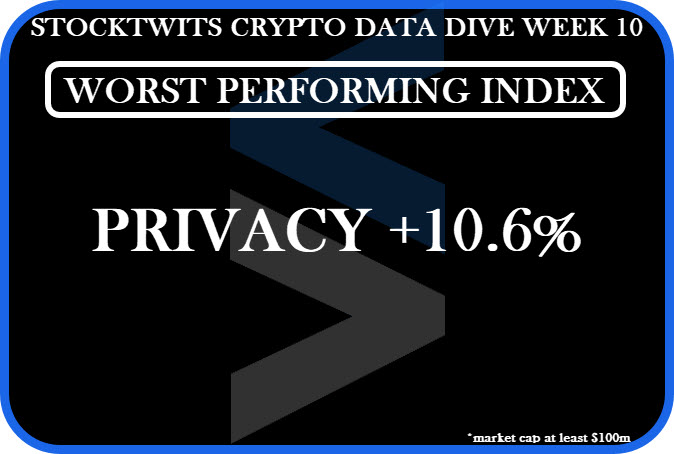
Privacy coins/tokens are cryptocurrencies that either focus on creating complete anonymity with transactions or offer anonymity as an option when performing transactions.
We construct this index by limiting the assets in this space to a minimum market cap of $100 million.
Summary
Putting It All Together
The following is from yesterday’s Litepaper (which can be read here) and best sums up some of the things to look out for as we transition into a brand new month:
A Damp Before The Pamp – The Bearish Case
This is where your tinfoil hat should be applied because this shit gets weird. I’m talking about time cycles.
W.D. Gann’s methods are some of the most crazy things you’ll ever learn. If you ever delve into Gann’s style of analysis, it will be the closest thing to being in an Indiana Jones story you’ll ever get. 🪖
Gann believed that the factor of time was why markets moved – not price, not the news, but time. He focused on price, too, but to him time was the most important. Gann focused on several time cycles, and when a good amount of those cycles ended in a cluster simultaneously, that was Gann’s way of saying pay the F attention to what happens around that period.
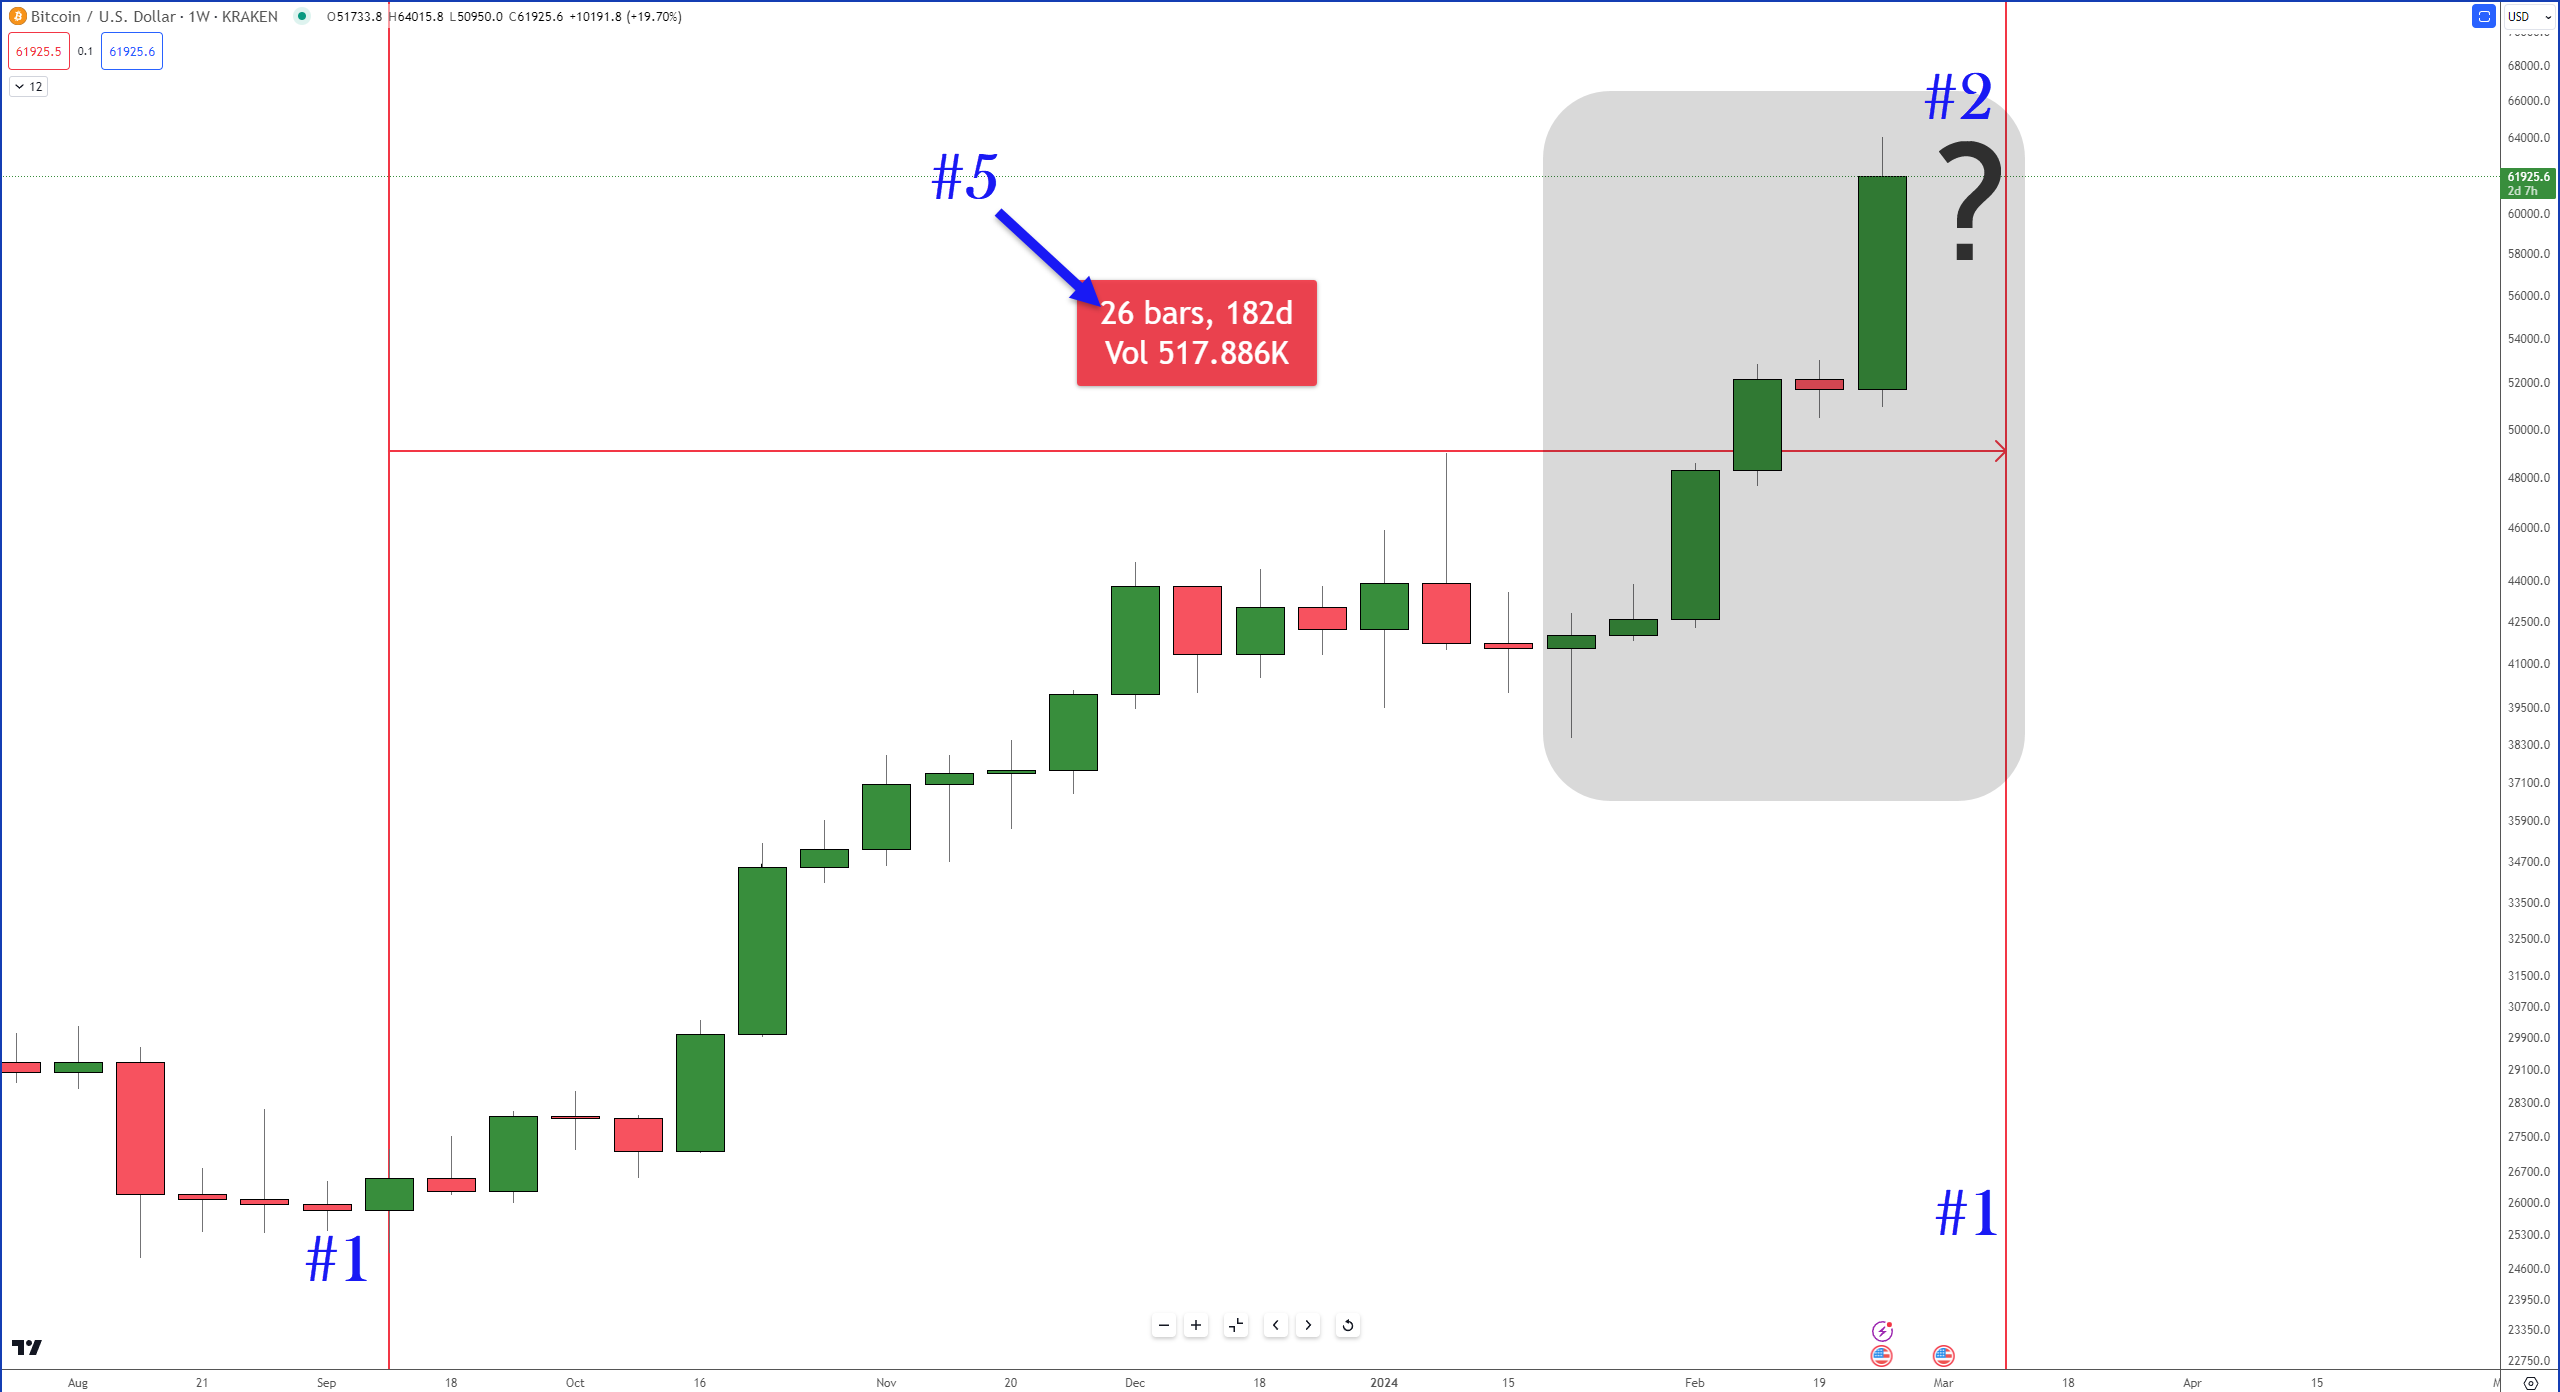
Here are some time cycle reasons for the bearish case and the respective numbers for the chart above:
- 180-day cycle: This is Gann’s second most important cycle, he consistently warned (and showed) that if an instrument is trending strongly in one direction over a 180-day (180 to 192 days to be specific) period, to be on alert for a violent pull back of broader trend change.
- 49-day Death Zone: Gann said that an instrument has a very high probability of retracing (pullback/throwback) if its been trending strongly over seven weeks (49 – 52 days to be specific).
- Six consecutive months higher is the longest Bitcoin has ever moved.
- As we read at the beginning of today’s Litepaper, March has a high probability of being a down month.
- 26 is an important number in Japanese Ichimoku Kinko Hyo analysis.
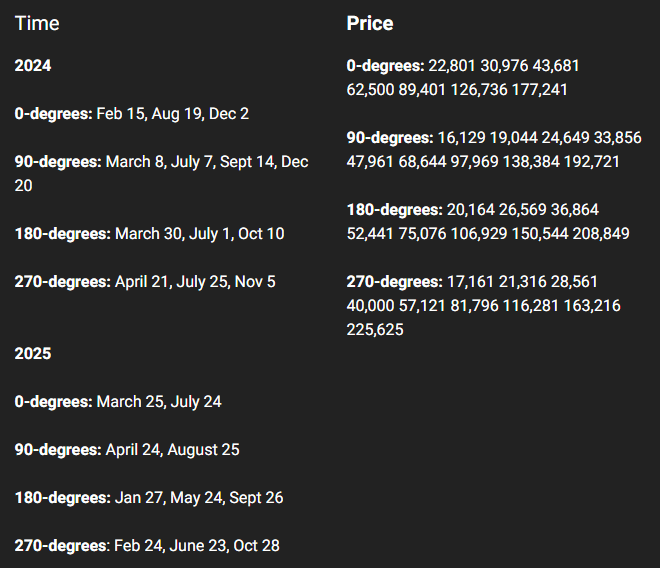
And as long as we’re talking about Gann, the following dates and price levels are from his Square of 9, which was one of Gann’s forecasting tools to identify important dates and price ranges in the future. 🔮
You’ll notice one of those dates is coming up soon and is inside the time cycles we just looked at:
That sums up the bearish case, now let’s look at the bullish case – which is much easier.
Continuation – The Bullish Case
This is crypto. Sometimes it seems like fundamentals and technicals don’t matter. It’s like Warren Buffet once said, “The market can remain irrational longer than you can remain solvent.”
And depending on how long you’ve been involved with crypto, you’ve probably seen or at least heard of some crazy ass parabolic moves that this market has.
Bitcoin’s halving is right around the corner. Februaries close nearly pulled off the highest monthly close ever, BlackRock has $10 billion in BTC and keeps buying, Wells Fargo and Bank of America are entering, Vanguard fired their big boss probs because he said no to BTC… you could go on and on about the fundamental strength behind Bitcoin and why it will only keep mooning.
In a nutshell – who the hell knows? Don’t risk money you can’t afford to lose; if you don’t know how much to risk, talk to one of those fancy schmancy financial advisors. And I mean a real one, not the 28-year-old with a mullet walking around his pond on TikTok. 🤑
See You Next Saturday!

Say Hello
💻 Questions? Comments? Email Jon at jmorgan@stocktwits.com 💻