Have you ever heard of whipsaws? They occur when price action moves crazy fast in one direction and then moves again in the opposite direction—just as fast and crazy. 🏎️
What happened to the altcoin market isn’t a whipsaw; it’s something nuttier and wilder.
In today’s Litepaper we’re looking at how bad the liquidations got overnight, the absolutely insane moves in SHIB, and a Technically Speaking over Chainlink, Shiba Inu, and Tron.
Also on deck: a look at some Stocktwits community members charts and a look at how I use the Stocktwits Social Data as a powerful tool.
P.S. Over the next month, we’ll be transitioning our newsletter platform to Beehiiv. To help ensure our emails keep making it to your inbox, please whitelist newsletter@thelitepaper.stocktwits.com
Here’s how the market looked at the end of the trading day:
| Bitcoin (BTC) | $66,462 | 4.24% |
| Ethereum (ETH) | $3,841 | 8.00% |
| Total Market Cap | $2.43 Trillion | 5.16% |
| Altcoin Market Cap | $1.13 Trillion | 6.26% |

If you thought yesterday’s Litepaper highlighting the $713 in liquidations was bad, well, it got worse. 😱
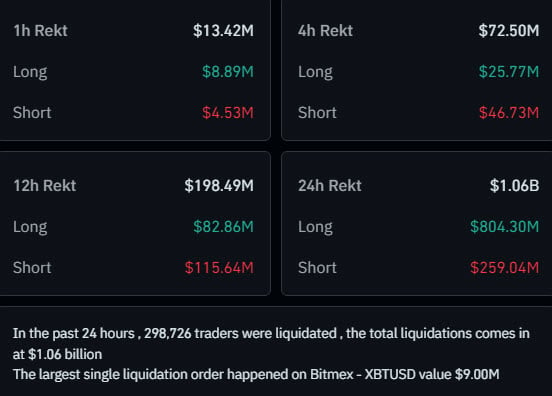
$804.30 million in longs and $259.04 in shorts for a whopping $1.06 billion in liquidations affecting nearly 300,000 traders.
Again, sometimes leverage is a double-edged sword, and other times it’s like Bill, who walks up to a guillotine, puts his head in the headrest, then shouts to his buddy Frank, “Hey, watch this!” before pulling the string. 🔪

Have you ever heard the phrase ‘volume precedes price’? It’s an old-school technical analysis 101 maxim. For example, if an instrument is in a downtrend but then you start to see volume tick up, the theory is that price will follow the volume. 🧑🎓
It’s what technical analysts call a leading indicator—a heads-up or a warning that the probability of change is high and that it might happen soon. Analysts and traders might apply that principle (volume precedes price) to the Stocktwits Social Data.
Here’s one way an analyst might use the Stocktwits Social Data:
- Identify things that are overbought or oversold – at extremes.
- Ensure it’s active and liquid, meaning people trade it.
- Look at the Stocktwits Social Data to spot divergences – for example, price action is bearish, but volume and sentiment are ticking higher.
- Work it into their regular analysis.
$RNDR is a good example from today, posted this morning:
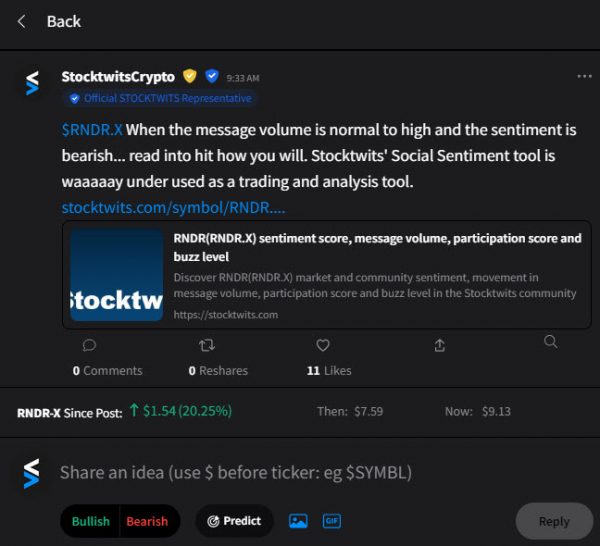
Like everything else in crypto, RNDR collapsed yesterday. But price action started to pop up a bit and recover. The message volume shifted to normal, and the sentiment over the past 24 hours was bearish.
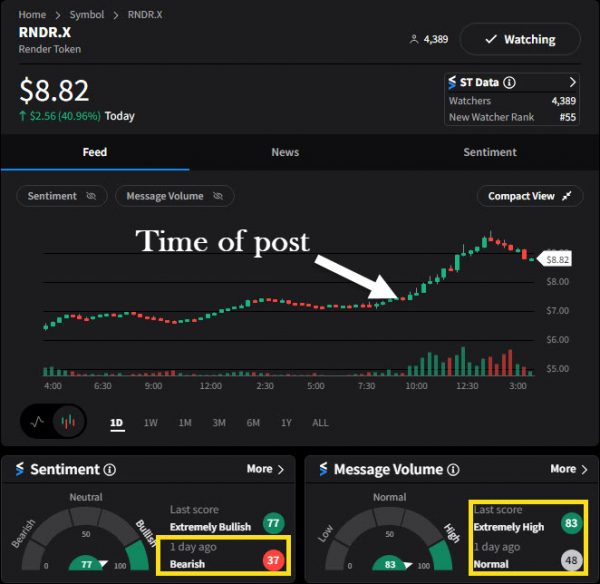
Using these tools, the StockTwits Social Data can be leading indicators, more so than the old-school volume-precedes-price approach—again, that’s just one way.
It’s like the Stocktwits Social Data leads the actual traded volume or supersedes it somehow—but it’s up to interpretation.
And please, for the love of Oreo cookies and milk, don’t take our word for it just because you read it in possibly the finest and best cryptocurrency newsletter in existence.
So do your due diligence before you nose dive into using a new tool or approach. 🧠
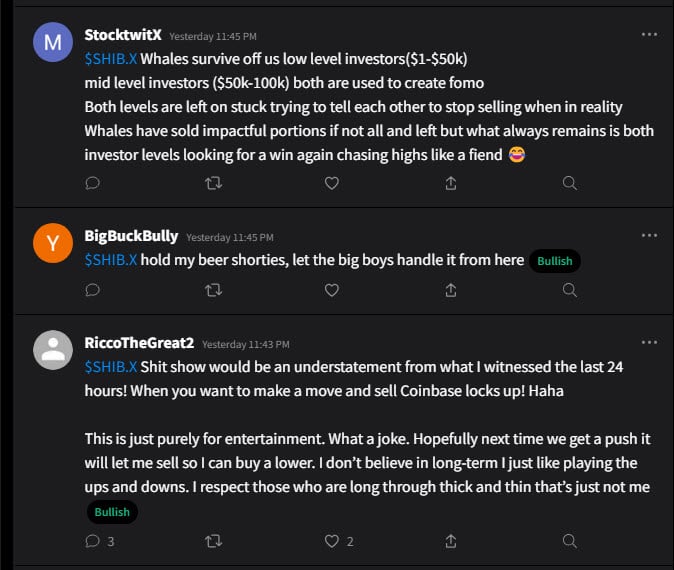
Look at the 1-minute chart below from yesterday’s intraday price action on $SHIB. 🤯
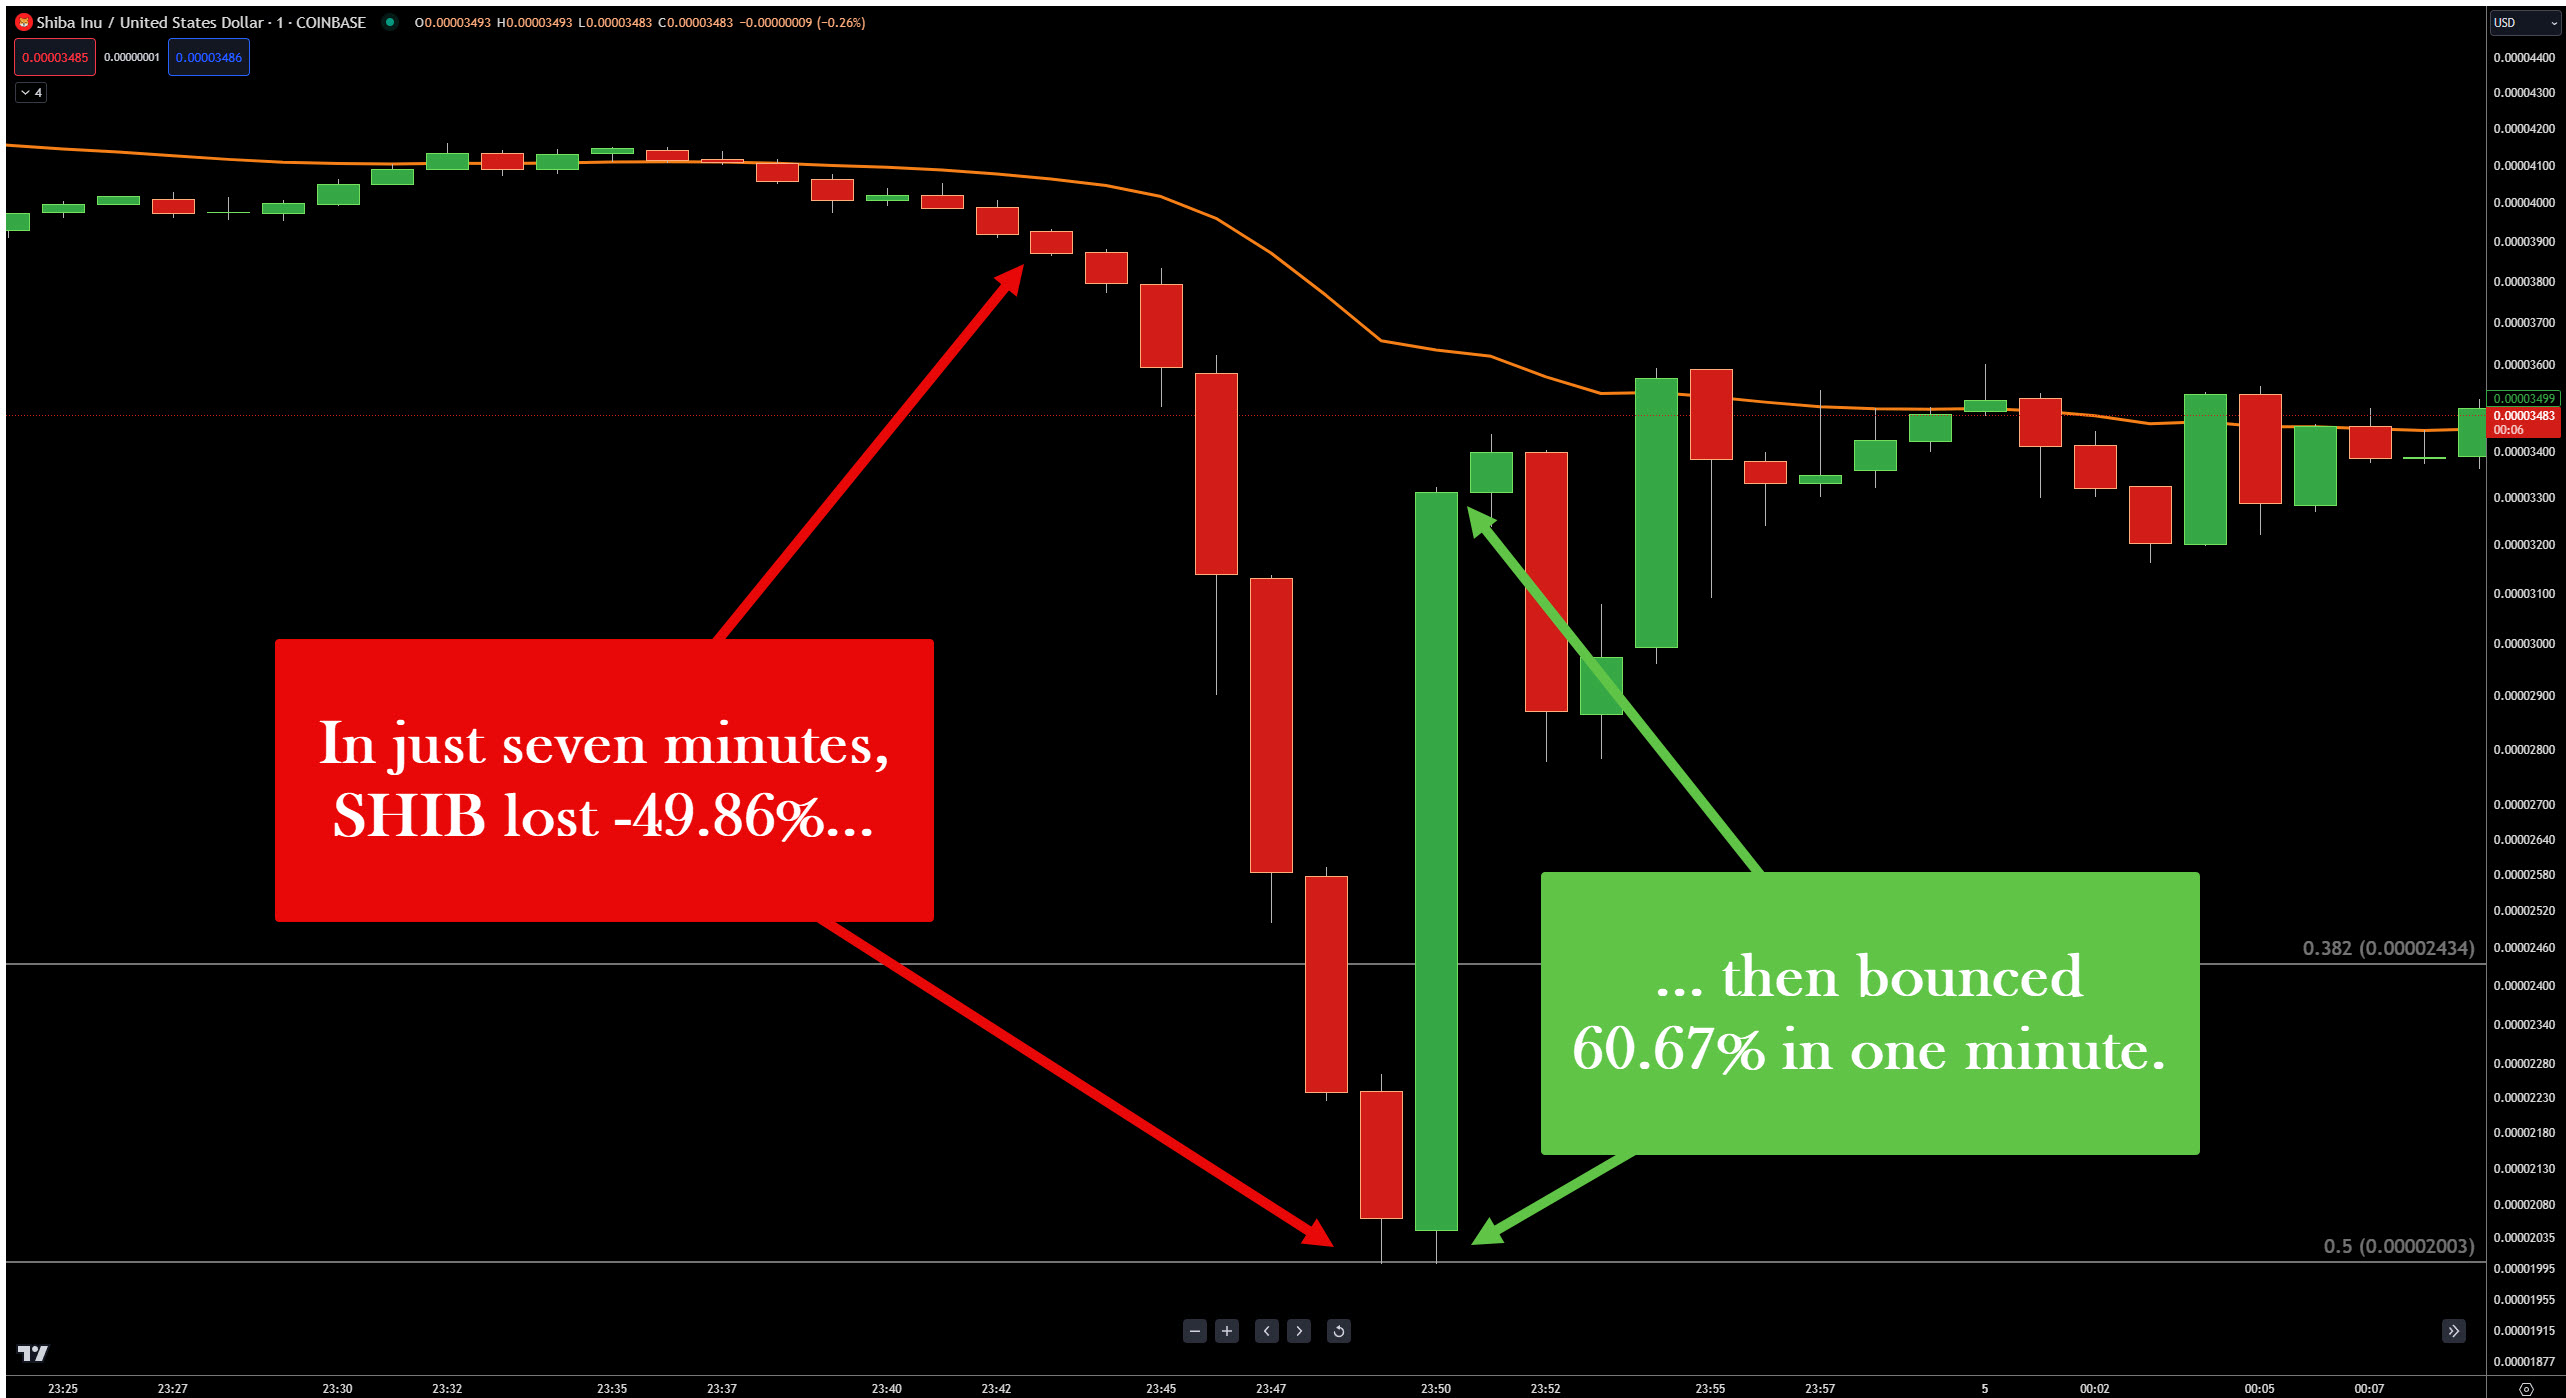
It was one of the craziest swings of all the major market cap memecoins by far, just an insane move. And how did the Stocktwits SHIB stream react? Like you’d expect any high class degen to react: Unf*cking fazed.
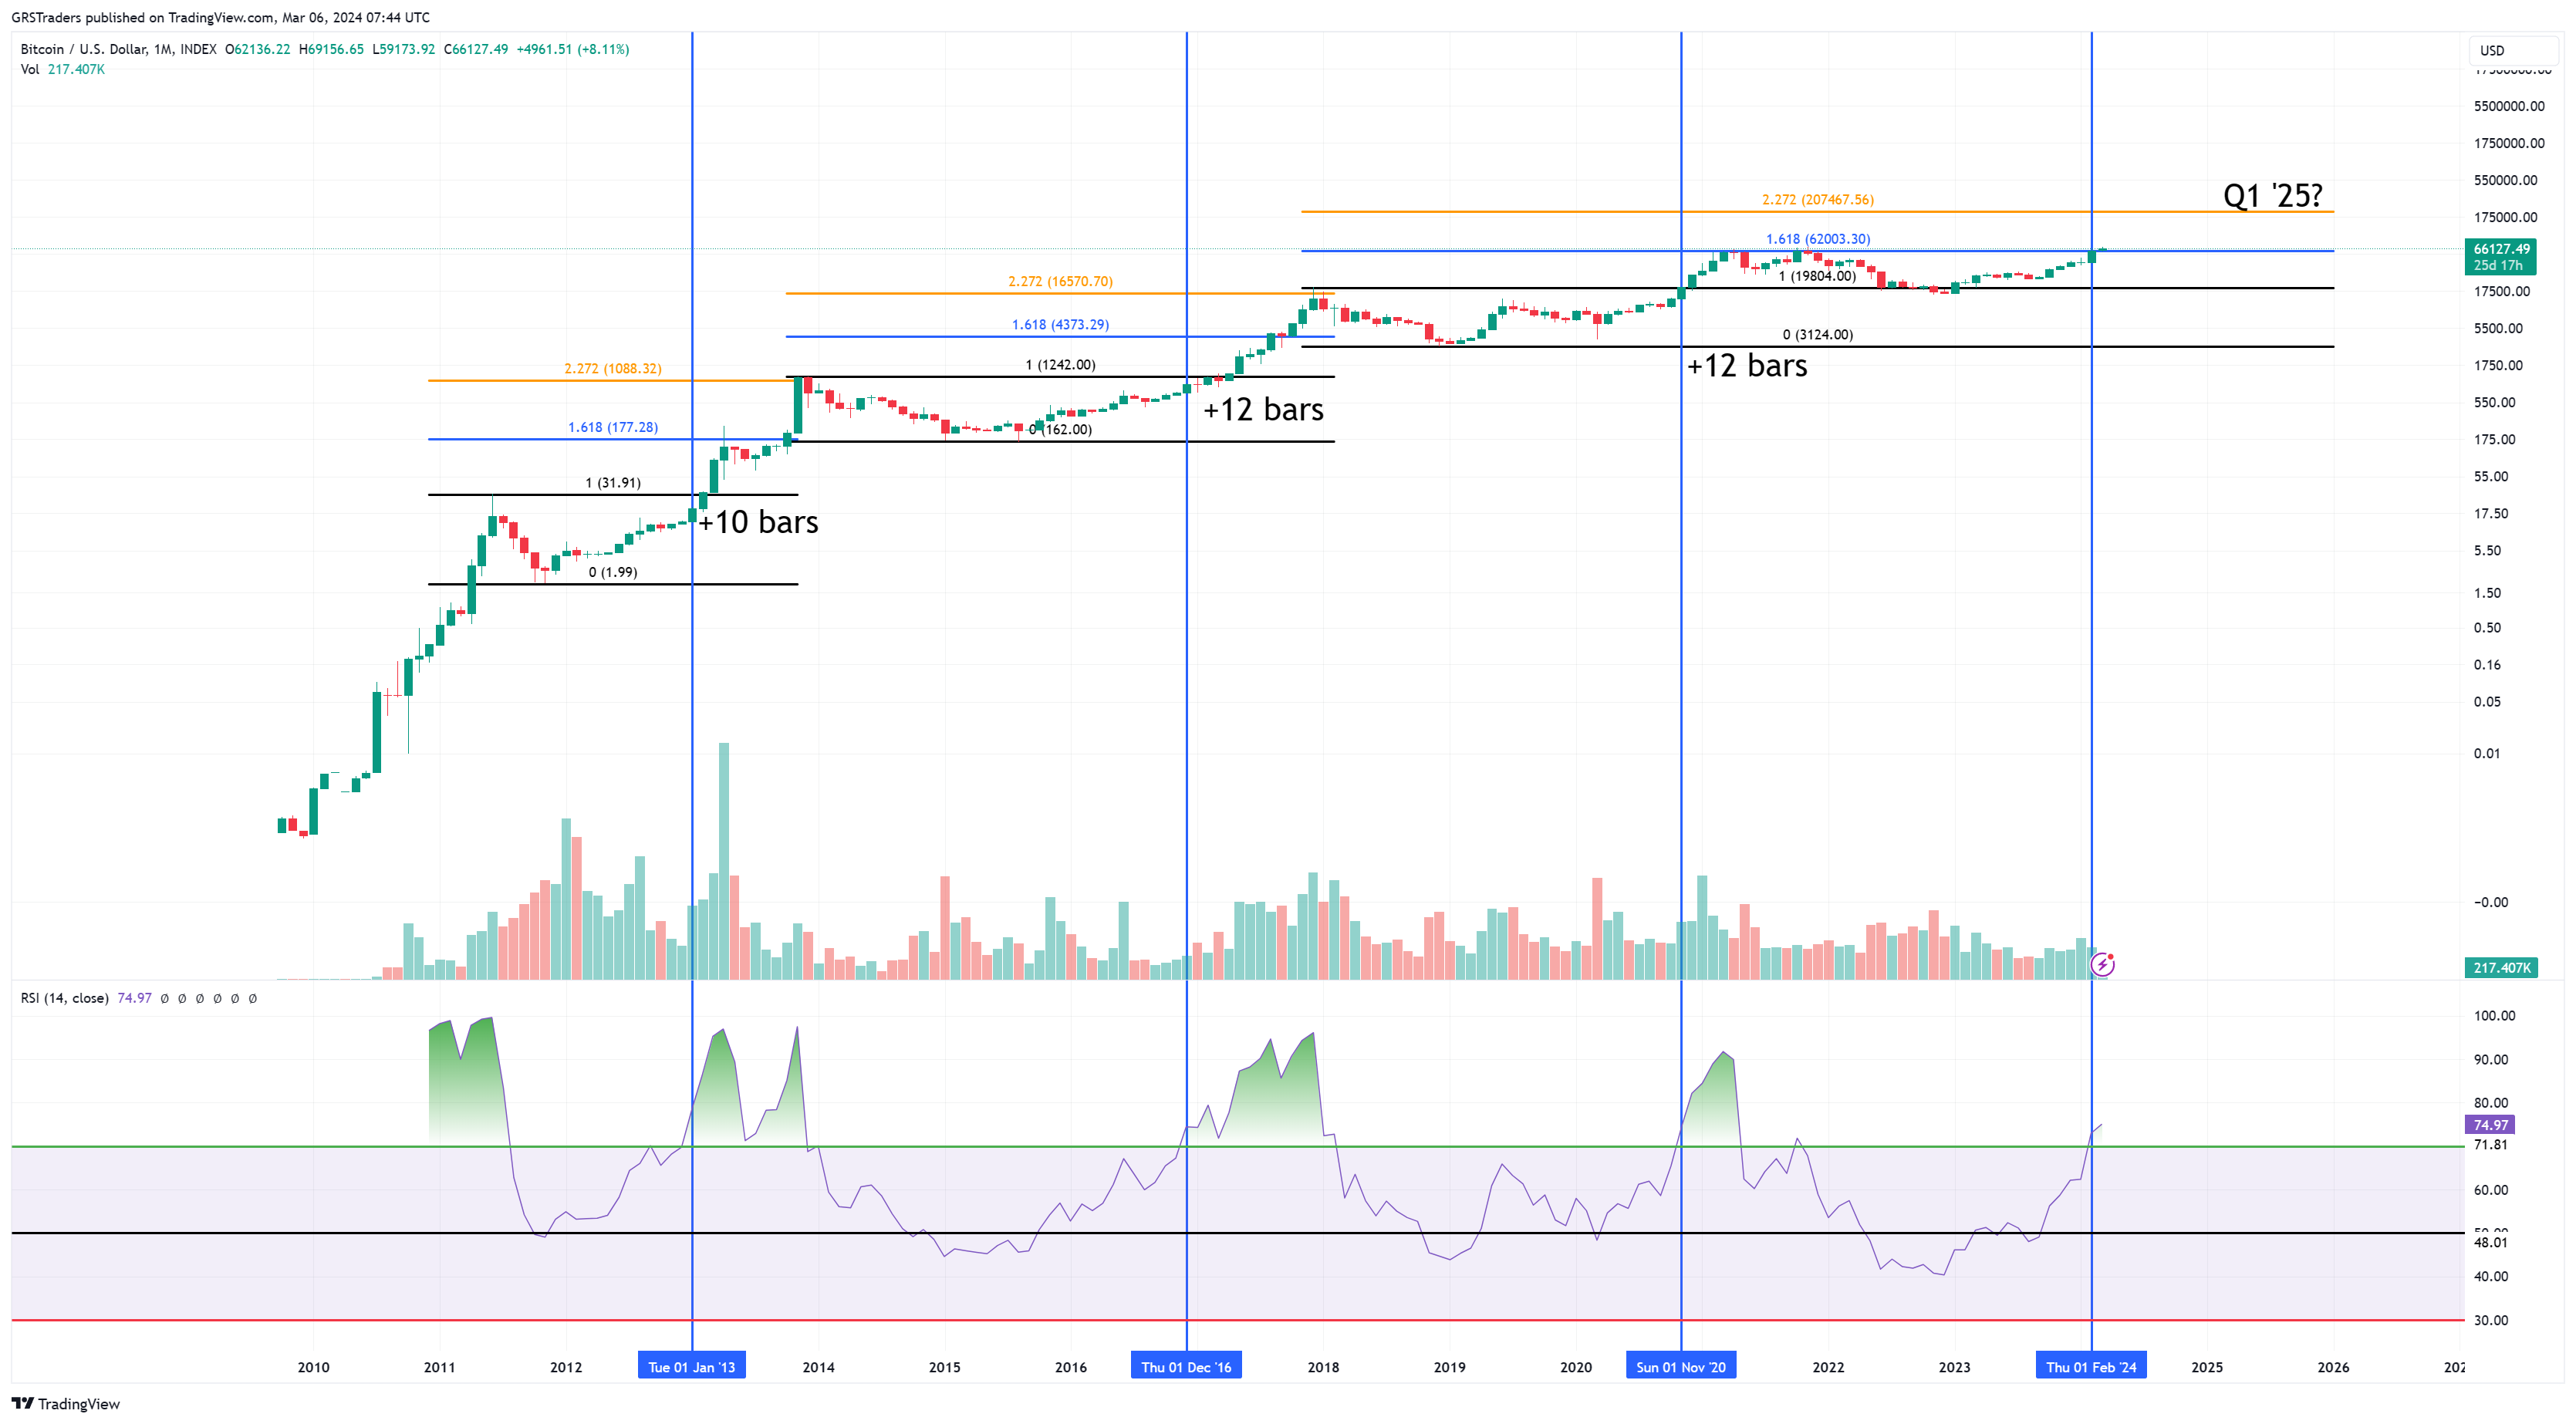
GetRichSlow shows off a beautiful logarithmic $BTC chart, hinting at $200k in Q1 2025.
His Fibonacci expansions highlight a series of projected price levels along with vertical blue bars highlighting when the RSI crosses 70.
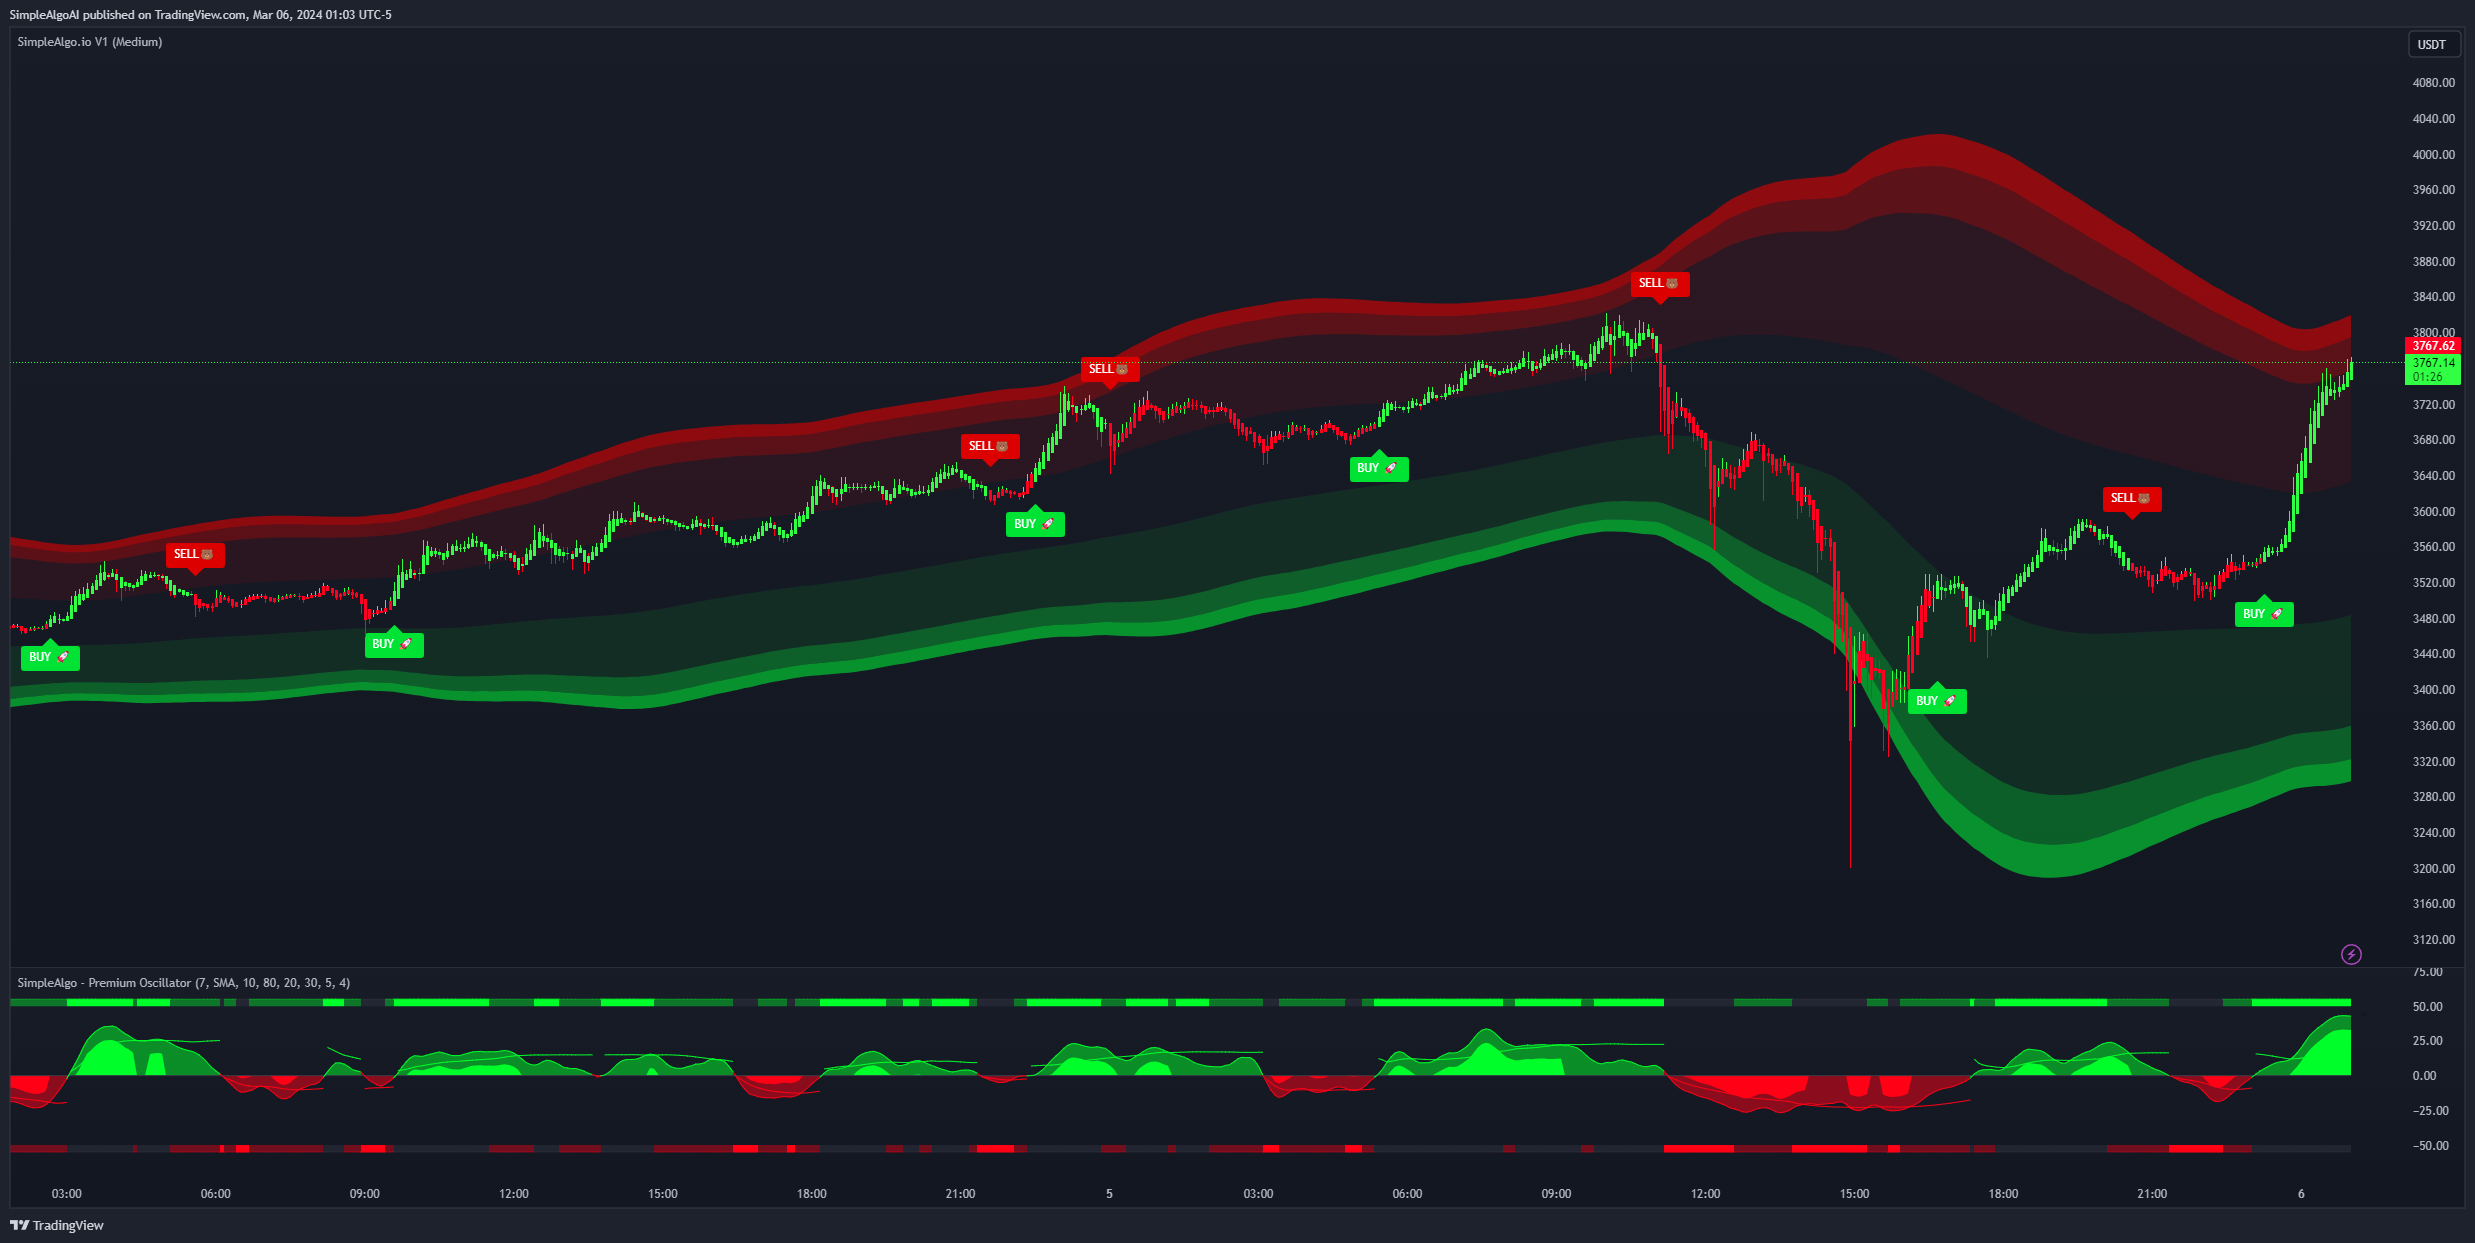
I have no idea what volatility bands realsimplealgo is using, but they’re pretty, and he’s calling out a buy signal on $ETH.
The chart shows either some form of Keltner Channels or a super-modified Bollinger Band; regardless, it almost certainly measures volatility. According to his modified Heiken-Ashi (essentially a Japanese version of a moving average), it flipped into his buy zone.
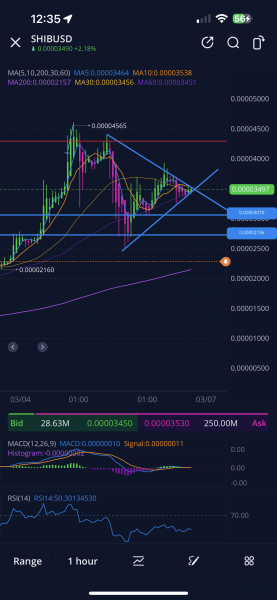
Finally, Spaghettisound1 braving his touchscreen to chart on $SHIB. Which makes sense because only a true Shiba Inu degen would chart on his phone.
Also using Heiken-Ashi, Spaghettisound1 identified a triangle pattern and the chart is right at the apex.

Let’s take a peek at some charts. 🧿
Chainlink
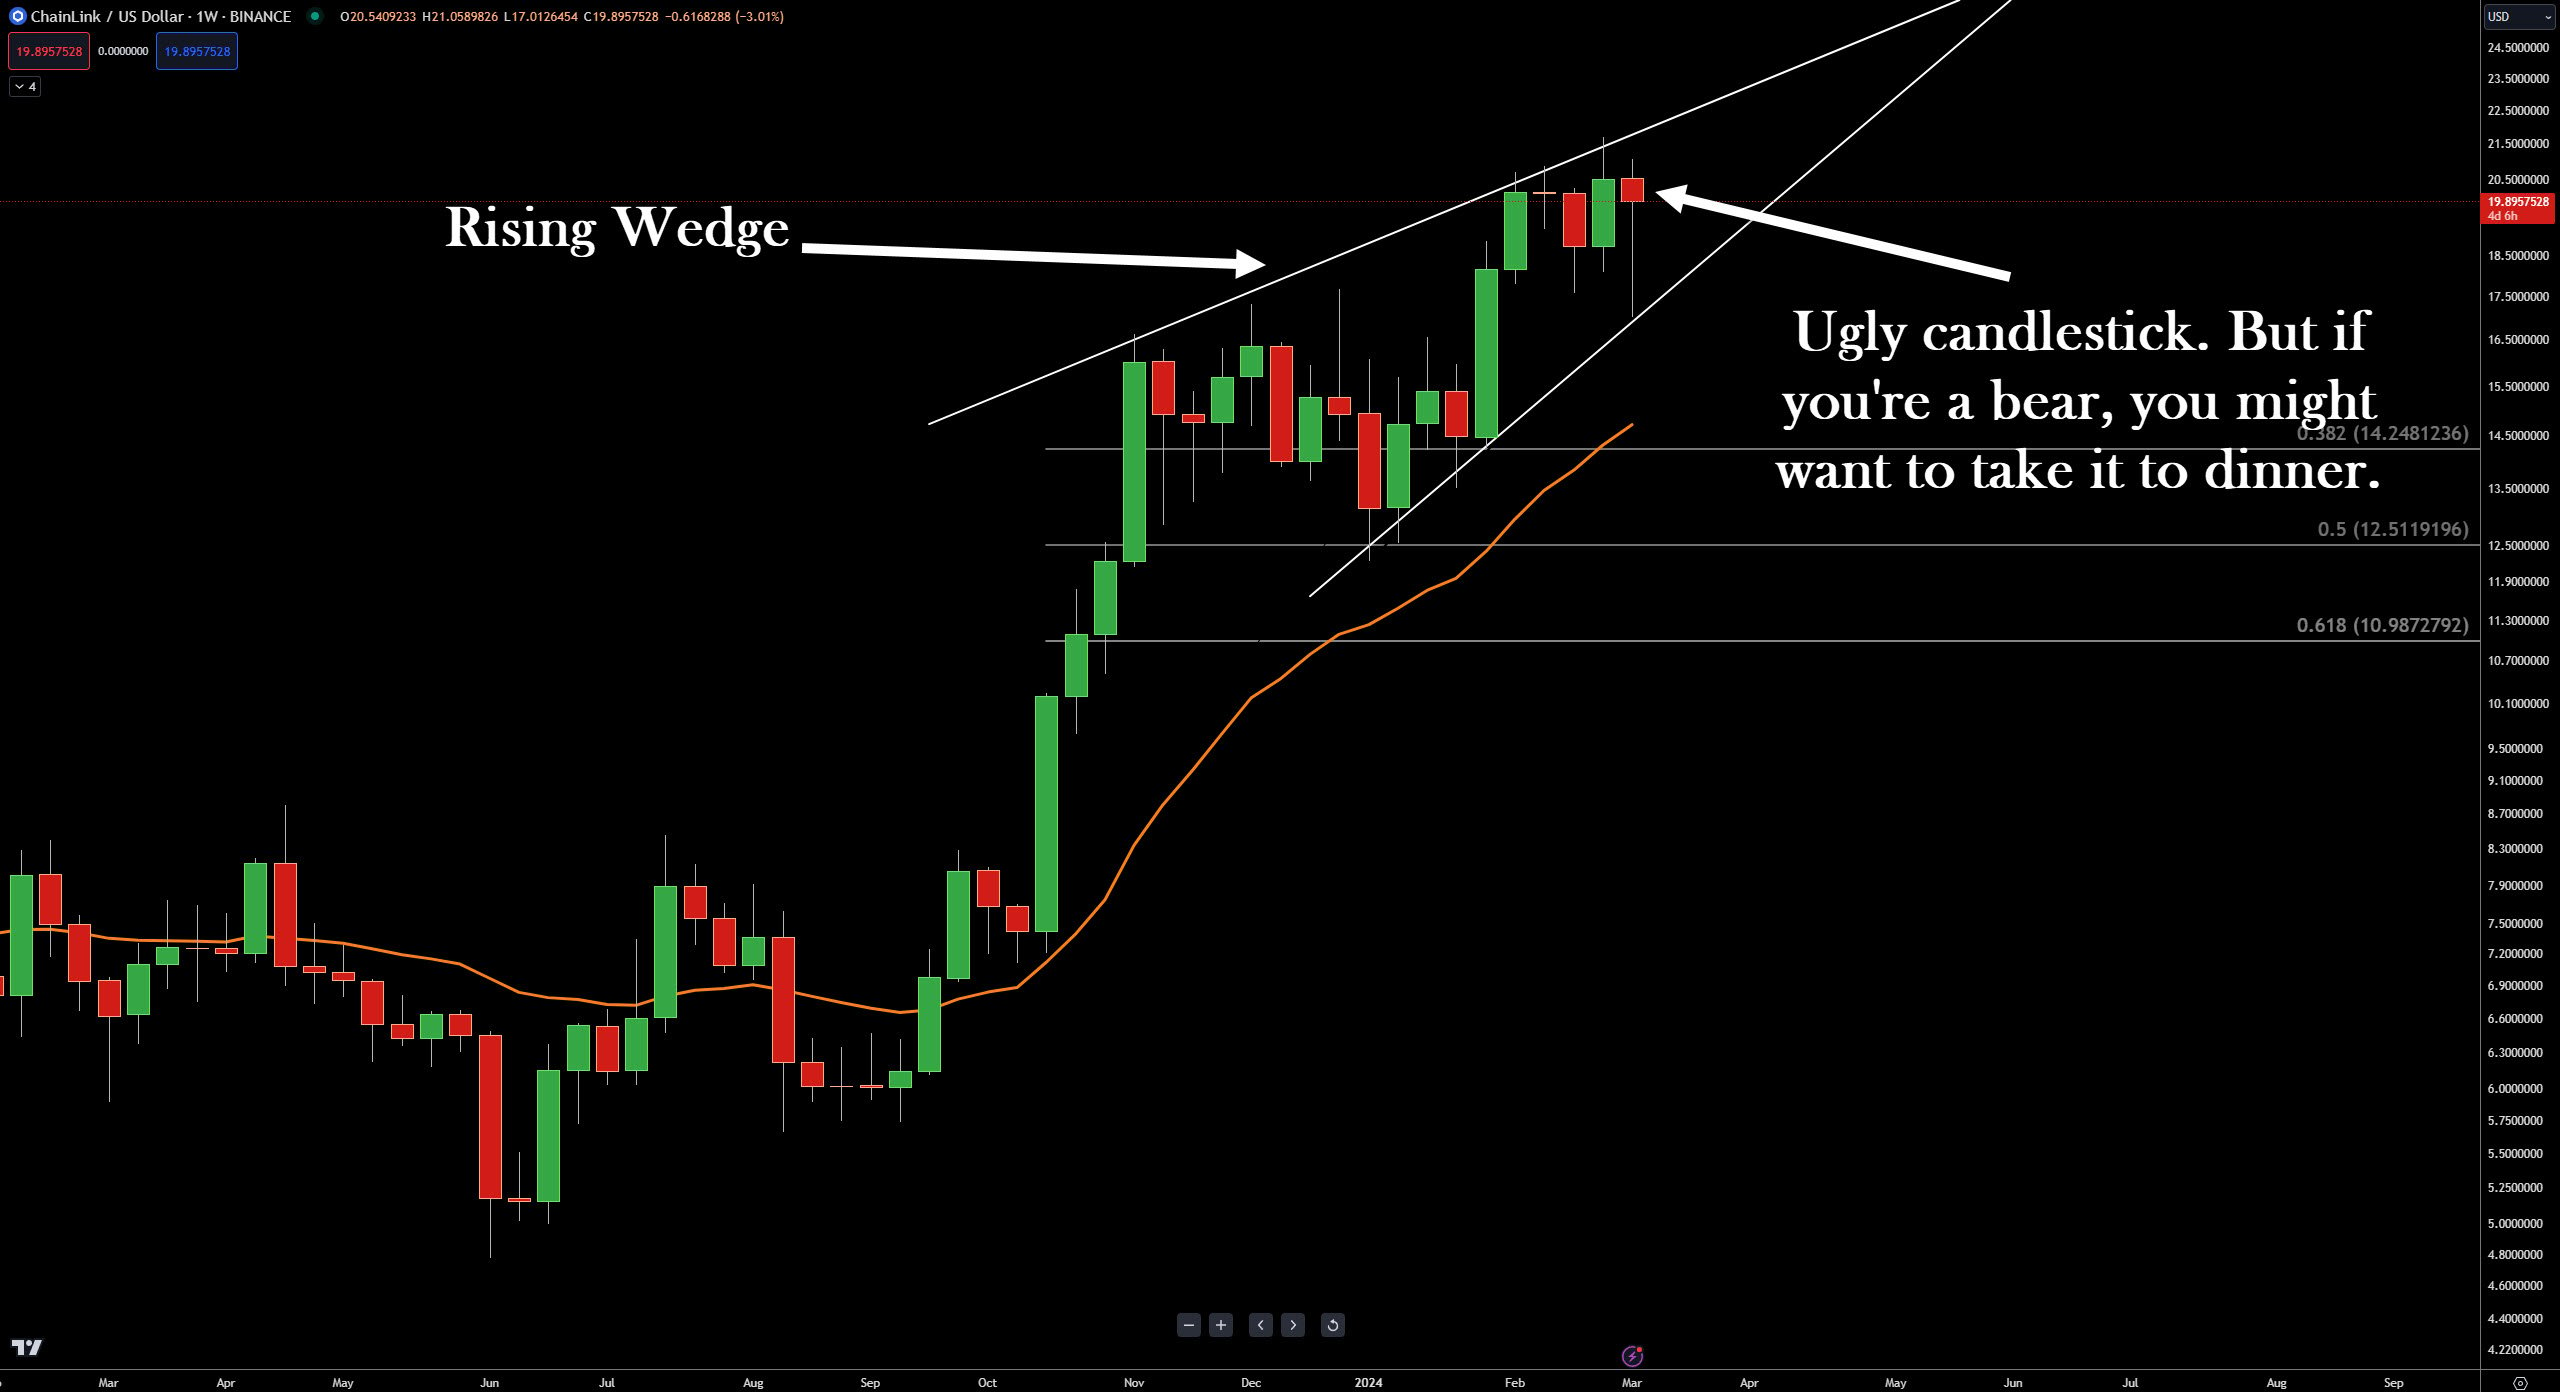
$LINK‘s weekly chart looks ugly as hell for bulls – maybe. There’s plenty of the week left, but the weekly candlestick is Ugly with a capital U. Additionally, there’s a rising wedge on the chart.
The rising wedge is arguably the most bearish common chart pattern that exists. Butas bearish as it is, when price action fails to collapse and instead breaks out higher, the move is often Dramatic with a capital D. ✅
Tron
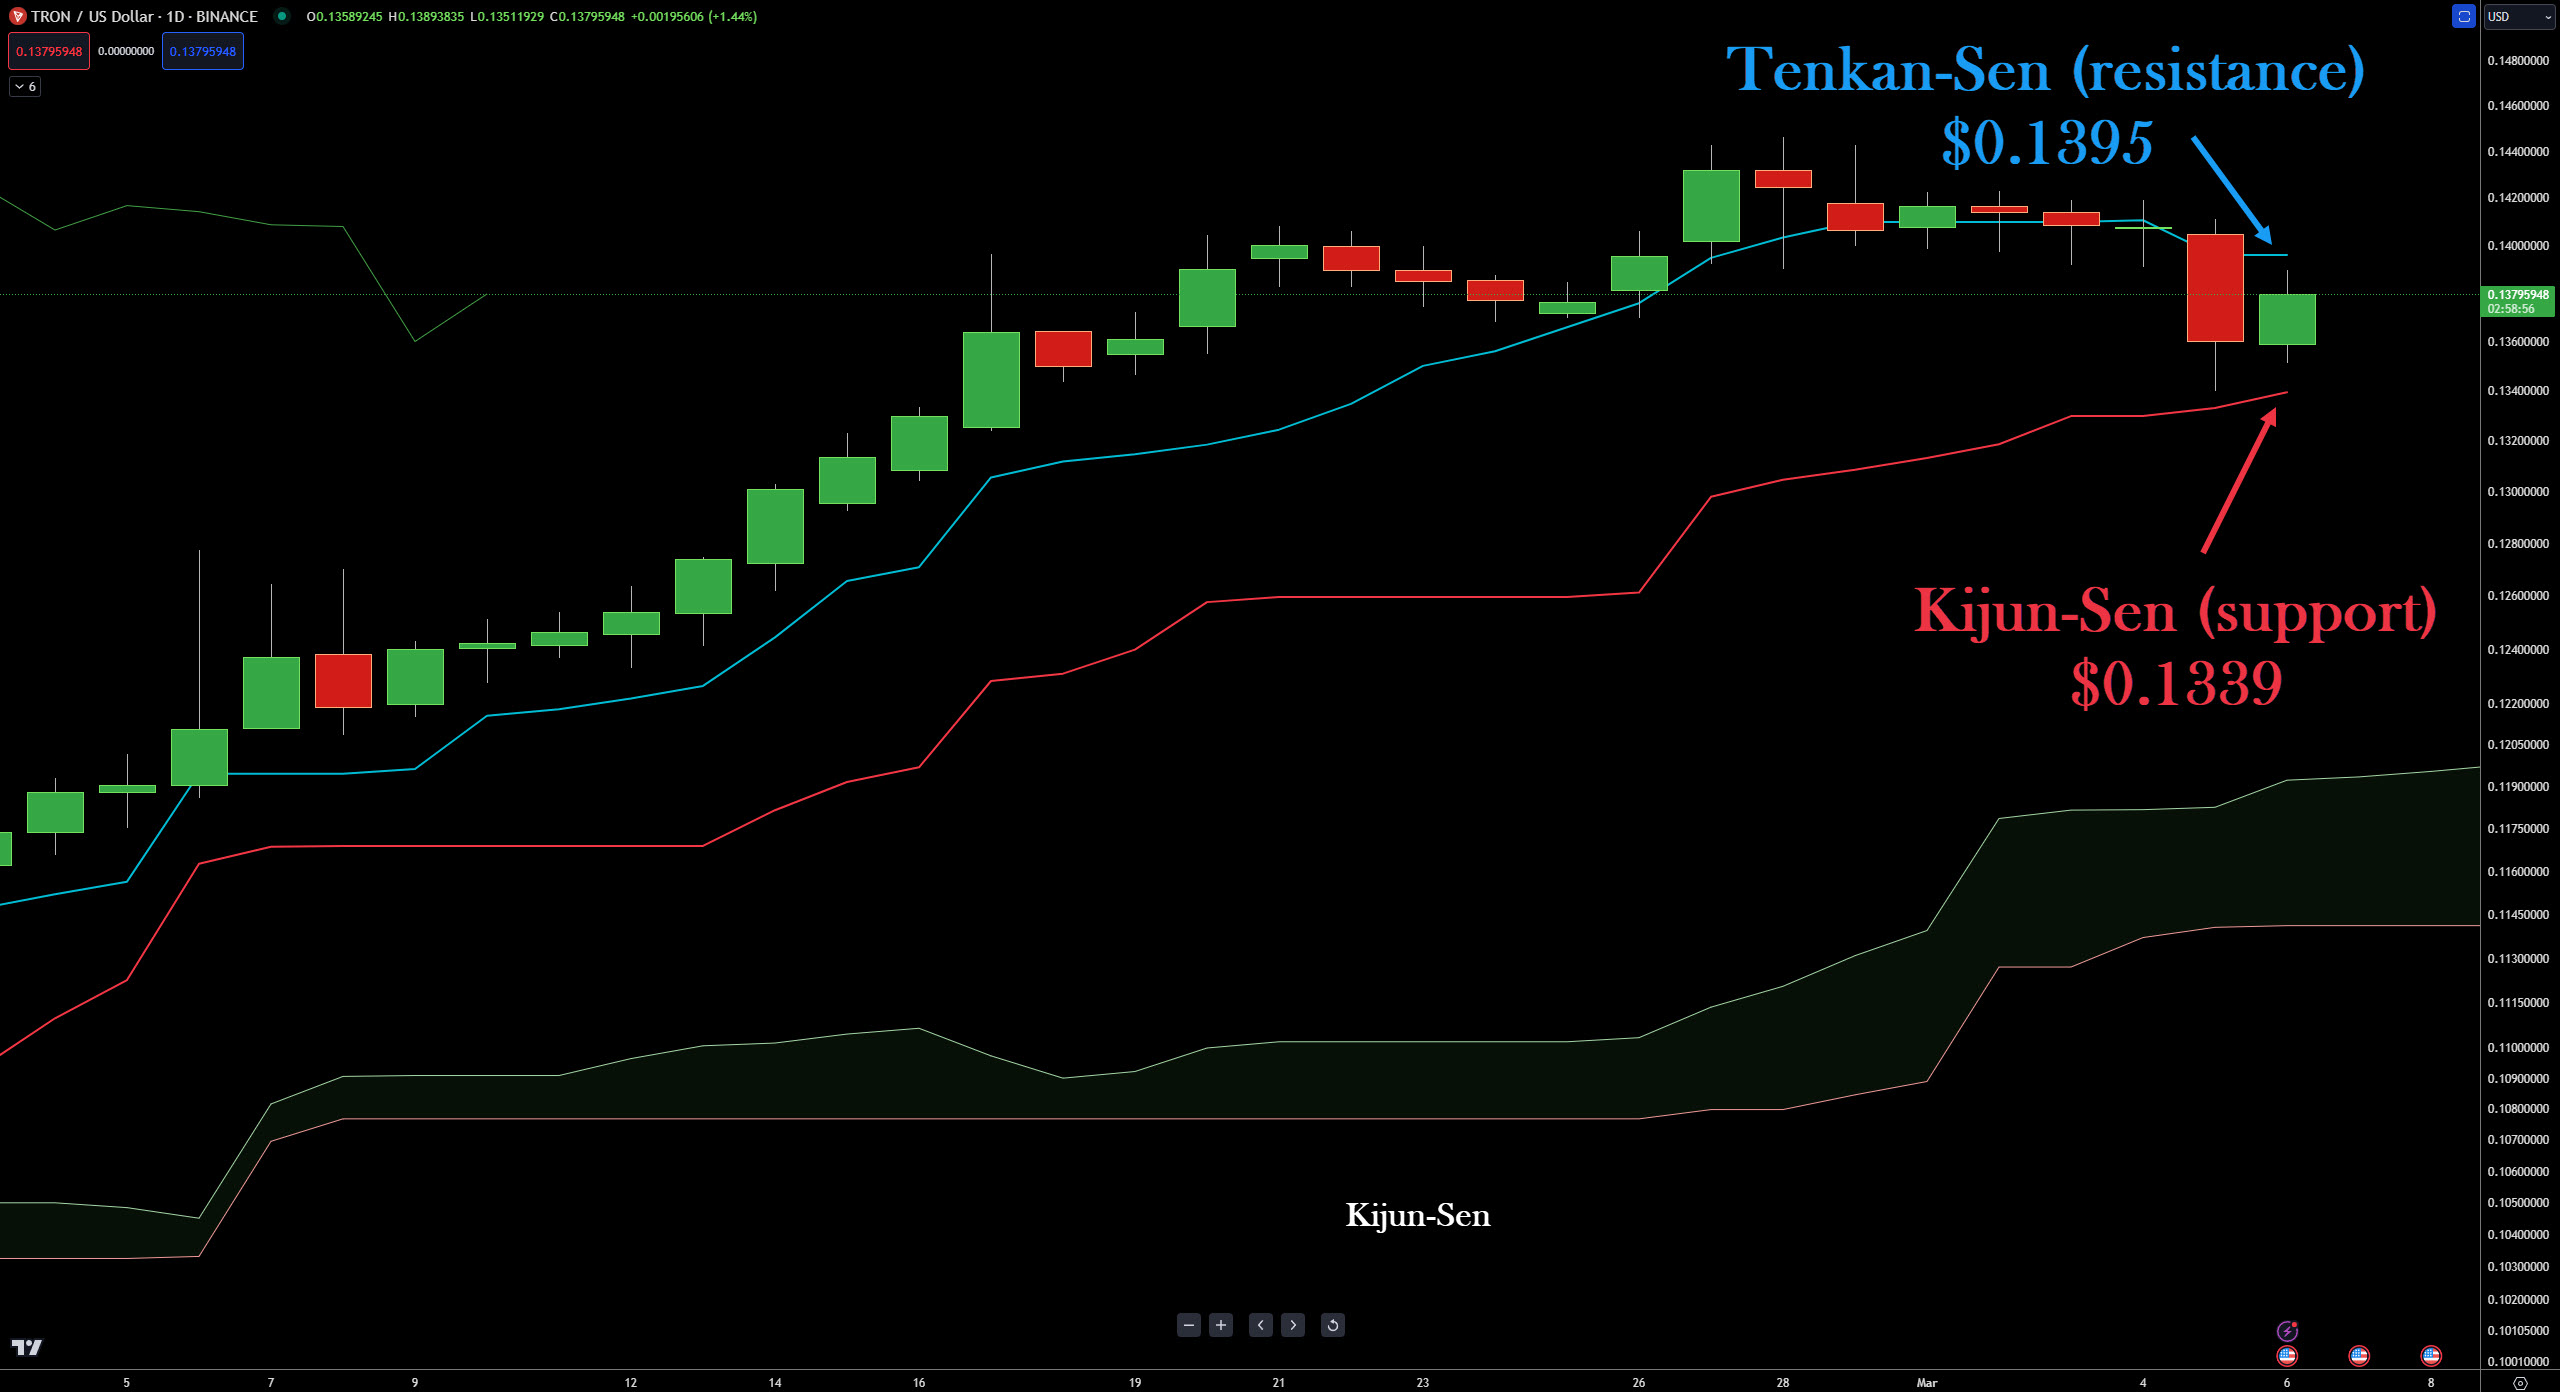
I’m switching to the Ichimoku Kinko Hyo system here for $TRX. This one is simple for bulls: they’re waiting for a re-entry or to add when the daily closes above the Tenkan-Sen, almost smack dab on top of $0.14.
Additionally, the Composite Index (note shown) is now in a historical support zone. ☀️
Shiba Inu
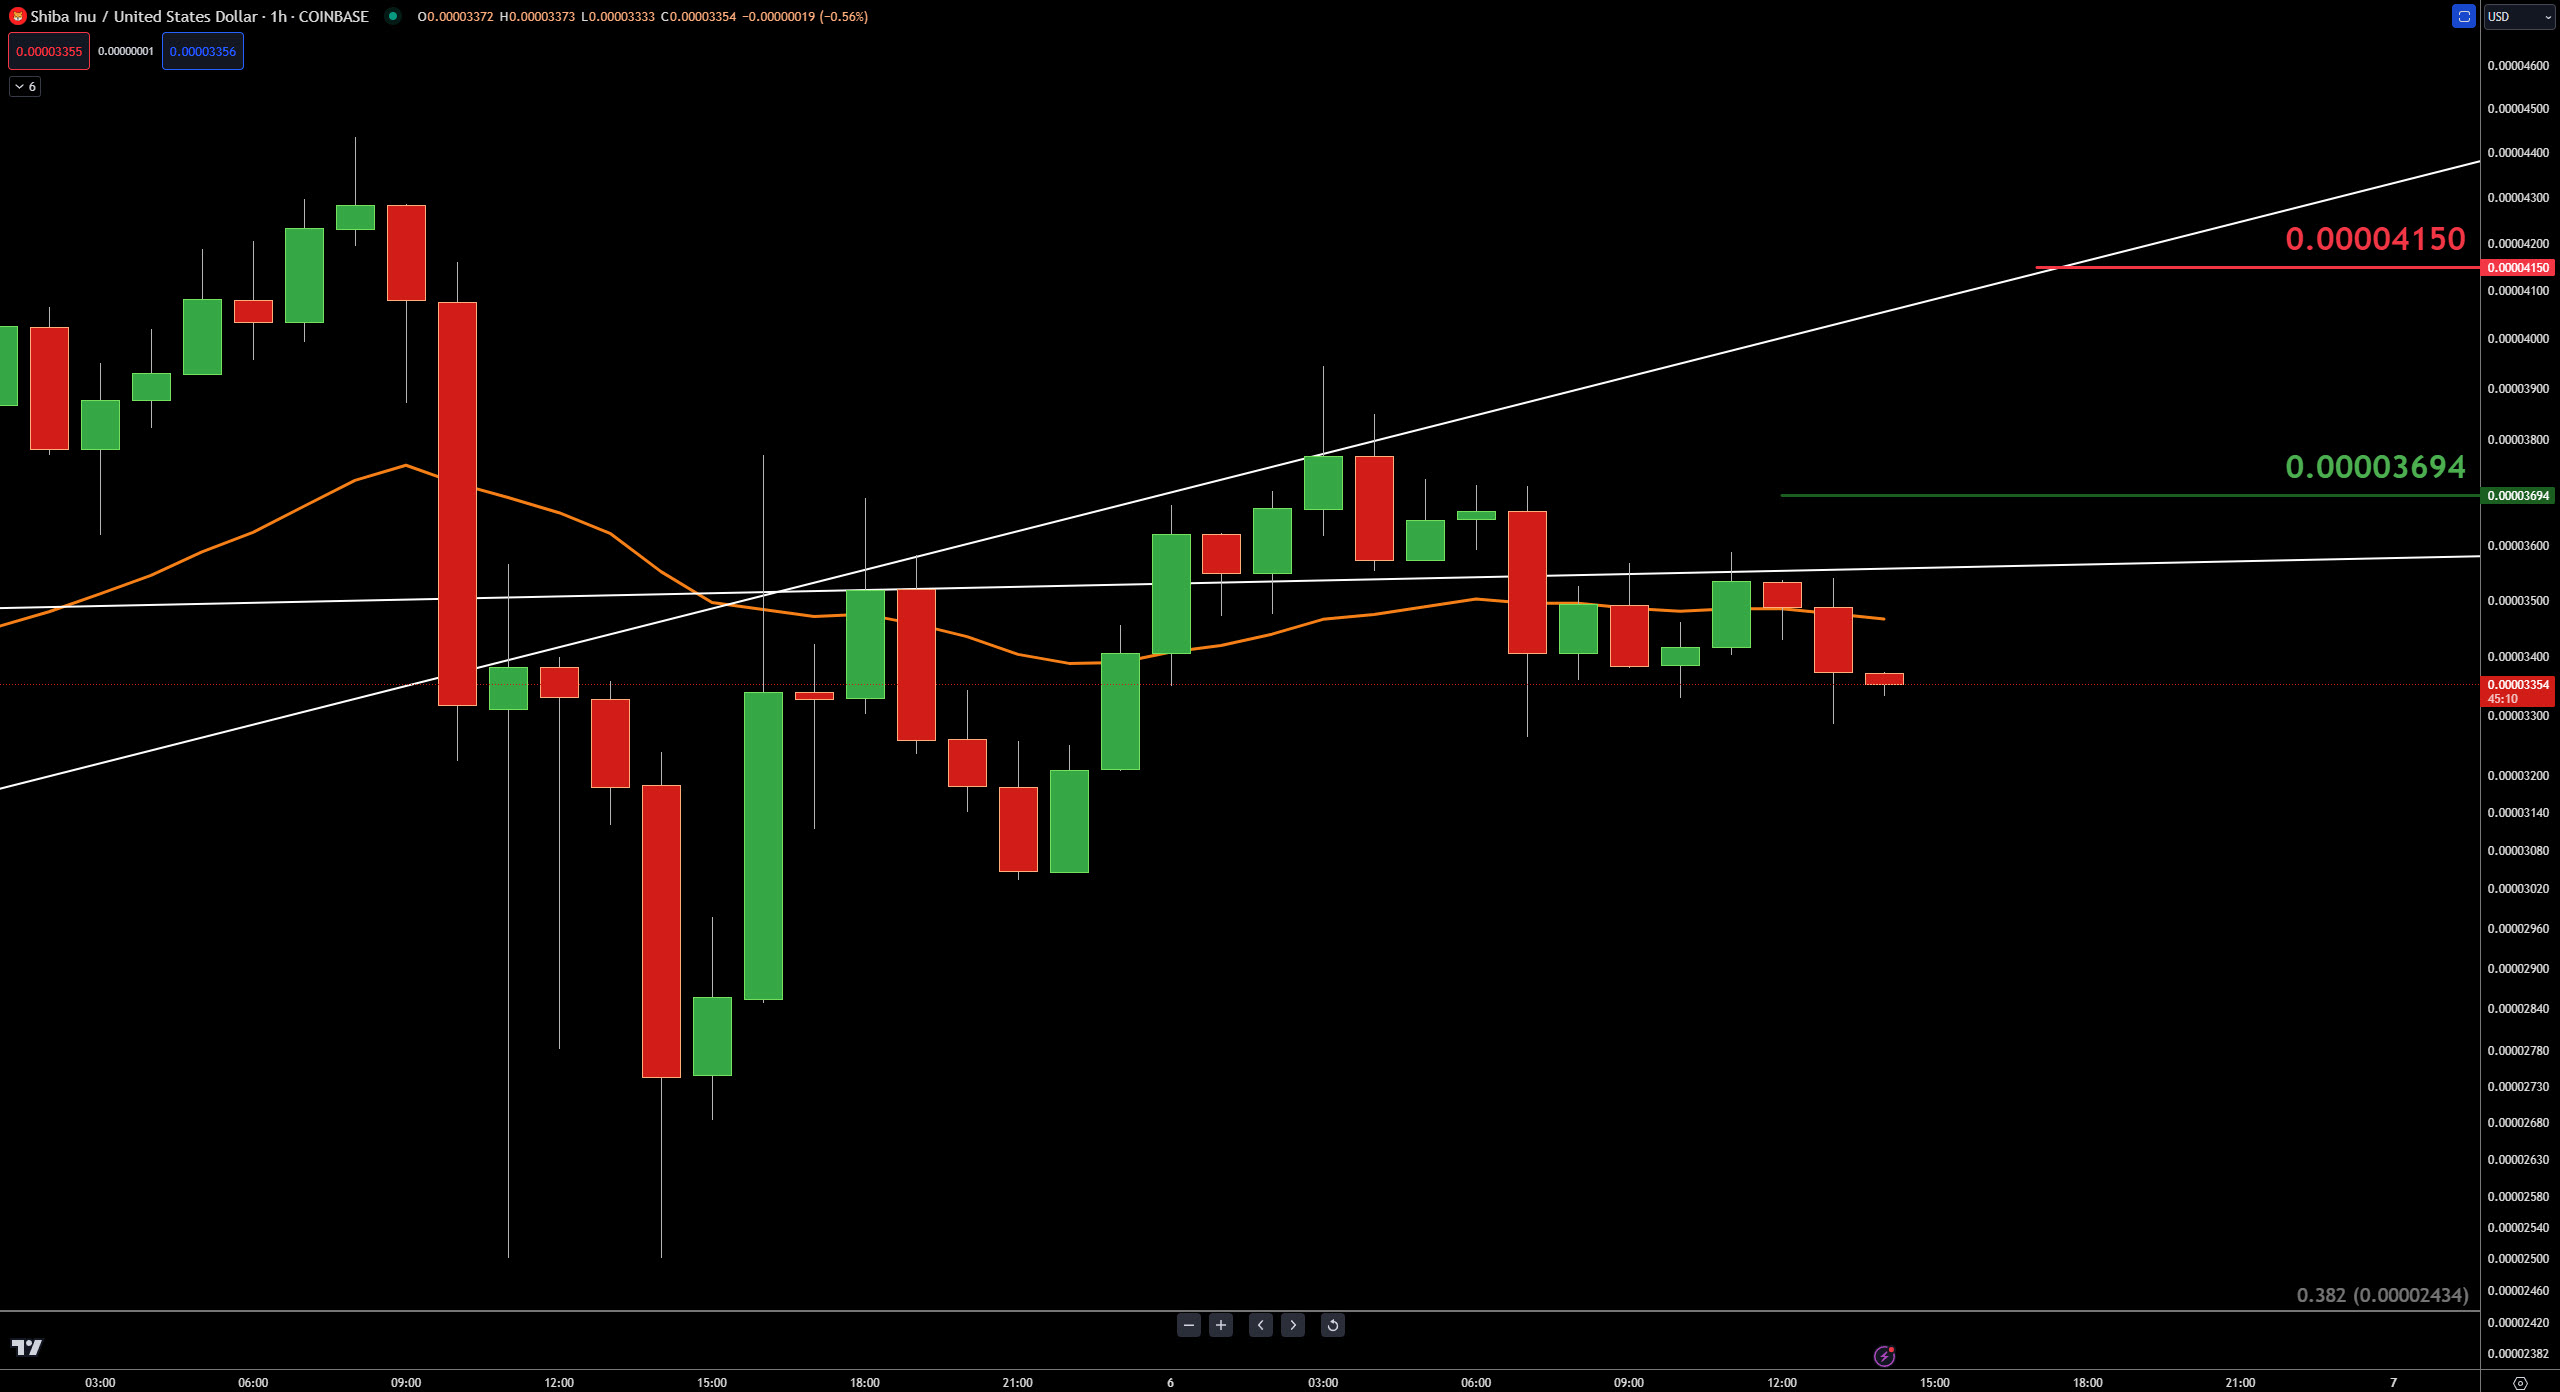
Alright, some of you fine degen folks have e-mailed and messaged asking for a ‘faster’ time frame for $SHIB. Here’s the problem(s) with that:
- This newsletter goes out around 1700-ish EST.
- By the time you read this, anything faster than a daily might be totally irrelevant.
- People in the $SHIB, $DOGE, $PEPE, $BONK, and $FLOKI crowd are scary.
So, just be aware that the hourly chart you’re looking at was done around 1400 EST. The closest white trendline near $0.00003550 is the first resistance zone bulls need to get above, followed by a close above the 0700 EST candlestick’s open.
Upside potential might be limited to the next trendline, around $0.00004150. Any move to or below $0.00003130 and this idea is scratched.
Links
Links That Don’t Suck:
💵 El Salvador’s Bitcoin investment surges to over $150 million in value
👍 Revolut launches direct crypto purchase into MetaMask wallets in bid to simplify Web3
❓ Wondering what caused BTC to spike suddenly? BitGo CEO explains
😳 This is why Binance’s Solana withdrawals are on extended hold
✋ Binance.US faces SEC probe over customer asset handling, cuts two-thirds of staff
Say Hello
💻 Questions? Comments? Email Jon at jmorgan@stocktwits.com 💻