Signs of froth in the market have been building since November and accelerated up in February, with the major indexes adding to their gains and tech giants becoming giant-er. Timing when the music will stop is a fool’s errand, but when it does end, we all inevitably look back through the lens of hindsight at the “obvious” signs things had gotten a bit crazy. 🤪
Some more of those signs of at least a short-term peak in sentiment appeared today, so let’s check them out. 👀
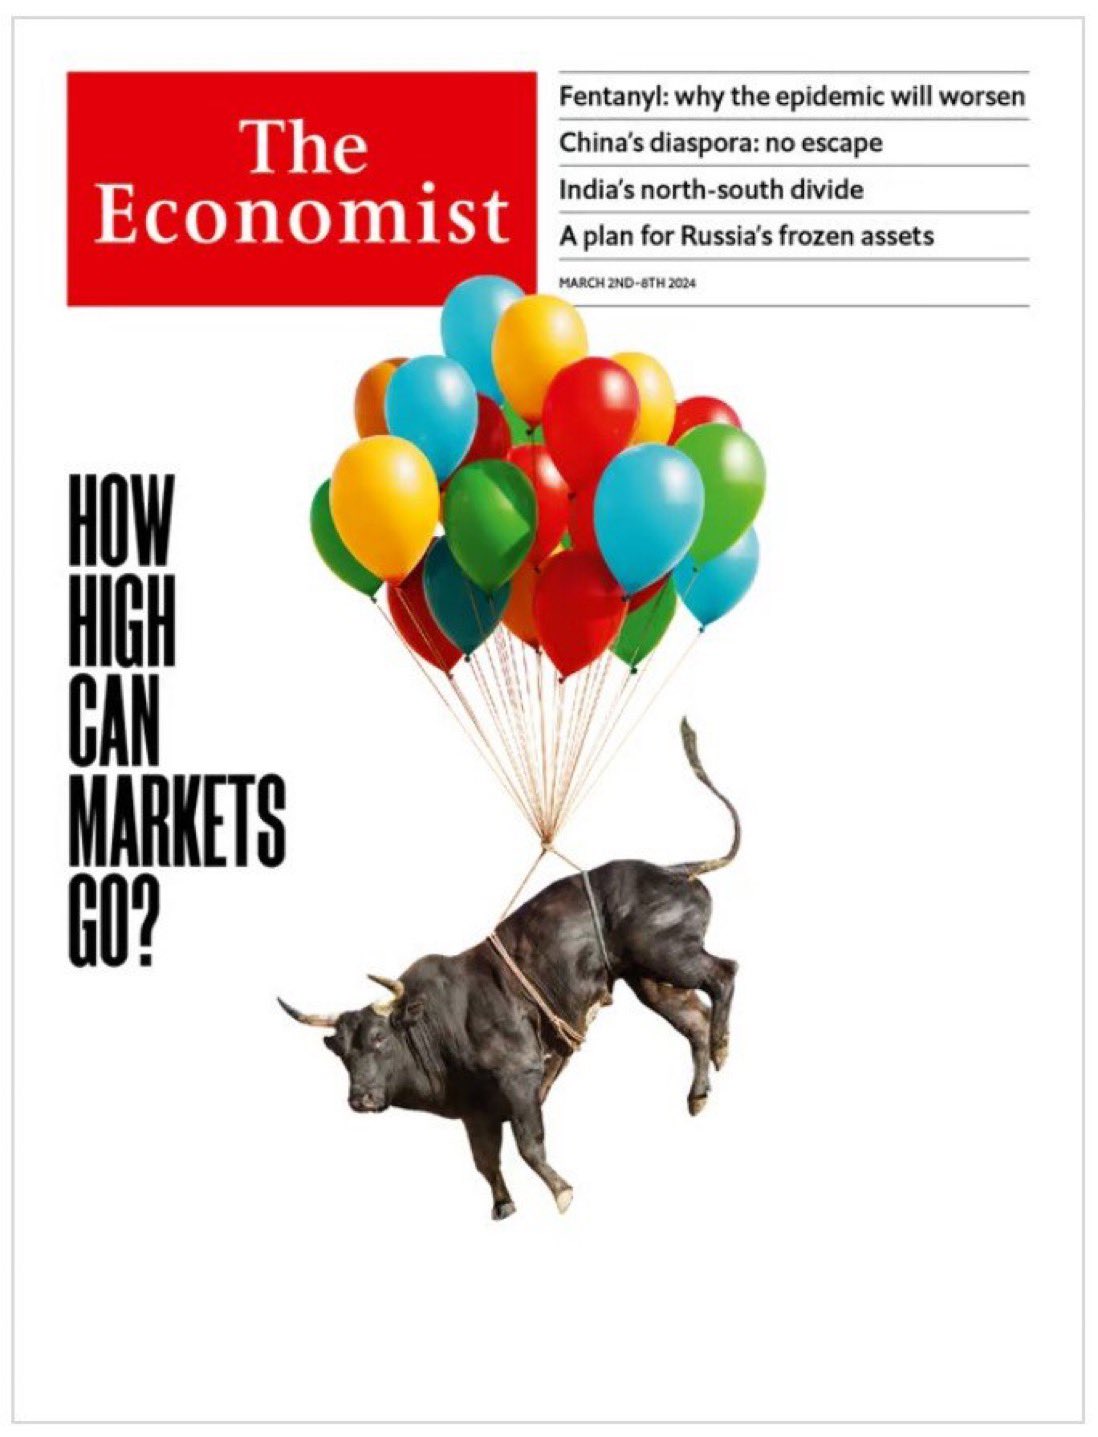
The first is the cover of The Economist, which asks how high markets can go. The consensus view has quietly been that a soft economic landing, AI boom, and resilient consumers would keep the stock market going higher and higher. But this magazine cover (along with the article quote below) is as “in your face” as it gets.
“.. two years of interest-rate rises .. A trade war is raging .. actual wars are raging .. If all that has not extinguished this rally, whatever will?” – The Economist 🫢
Still, others in the Stocktwits community don’t see this “magazine indicator” as useful in the current environment. Instead, they’re staying focused on their specific process and market objectives without getting sucked into all the noise.
Speaking of artificial intelligence (AI), the new gold rush has helped even the dinosaurs of the tech industry return from the dead. Dell shares are surging after the bell to new all-time highs after the company cited rising demand for AI servers as the driver of its earnings beat. Meanwhile, IBM has quietly been trending higher for similar reasons after over a decade of nothingness. 👴
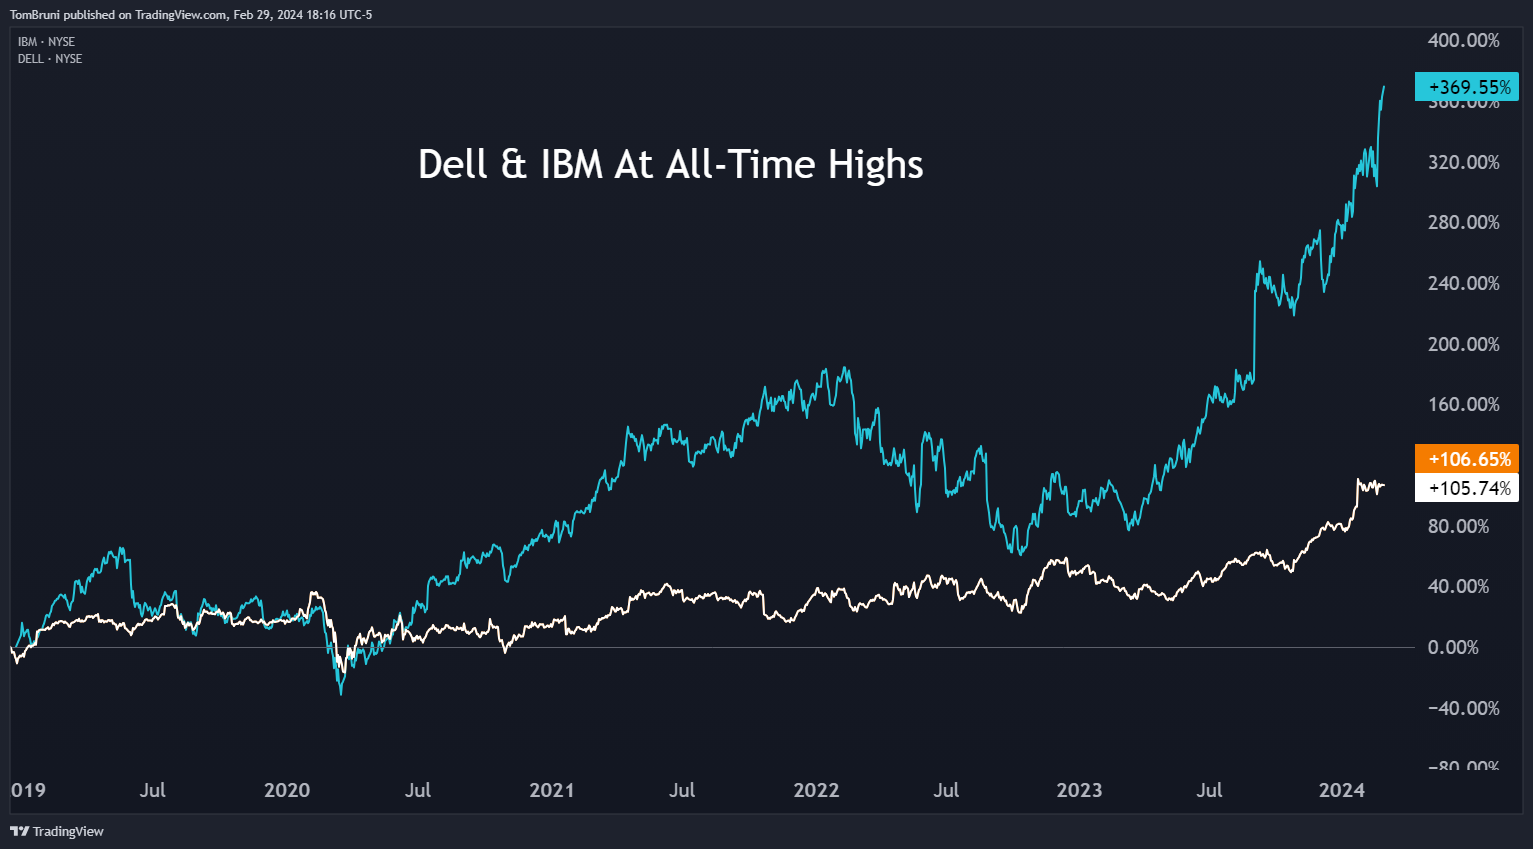
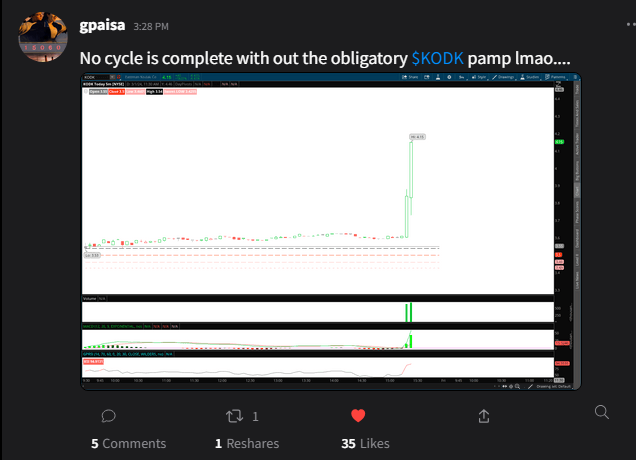
While at least part of Dell and IBM’s stock price advance is rooted in fundamentals, others like Eastman Kodak are just rampant speculation. The COVID-era darling jumped more than 50% today on no news, with Stocktwits user gpaisa rightly pointing out that no market cycle would be complete without these types of “crazy” pumps. 🫨
Fundamentals have again taken a back seat to FOMO, with investors and traders abandoning risk management in hopes of striking gold. Of course, we don’t mean actual gold, which continues to do nothing but frustrate everyone who owns it. But digital gold in the form of crypto, AI, and other tech continues to be the vehicle of choice for the current bout of speculation. 🤑
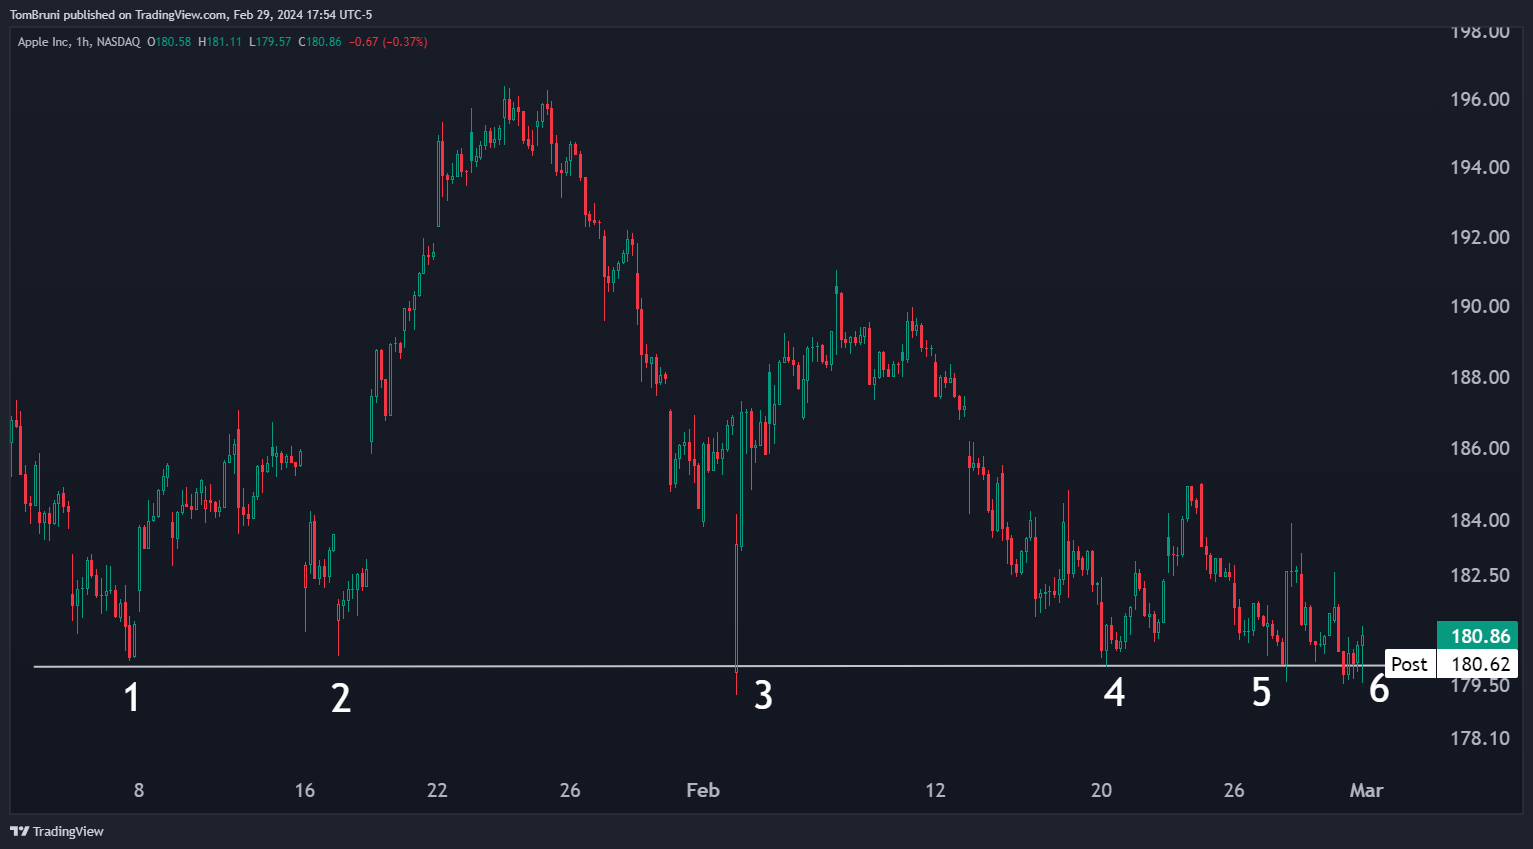
Meanwhile, some market bears are pointing to Apple as a potential warning sign of downside to come. The stock is trading at the same level it was in late 2021, with its hourly chart below showing sellers continue to push prices down to that 180 level. If it breaks, it could spell trouble for the now second-largest company on the planet and the many passive indexes that hold it. ⚠️
We’ll have to see how this all plays out, but as we’ve been saying, having a risk management plan for this type of market environment is essential. It can stay silly for longer than many expect, but fundamentals eventually shift the market’s tone from FOMO back to fear. And when that happens, prices can fall just as quickly (if not quicker) than they rose. 🙃
P.S. If you want more info on the Apple thesis above and its impact on the market, check out the latest episode of Trends With Friends below, where Howard, Phil, and JC discuss it at length. 👇