Make sure you check out the TL;DR (Too Long;Didn’t Read) below each section if you want to avoid the technical analysis mambo jumbo.
The Good
Who won the award for best performer of the week? Hint: the world’s richest man Tweets about this crypto every once in a while and has publicly supported its use – you can even buy an electric car with it.
Not much of a challenge here. Dogecoin ($DOGE.X) absolutely slaughtered its peers in its performance for the week. Its +40% gain is nearly 4x higher than the next in line, Ethereum ($ETH.X), at +13%.
The most important technical conditions that Dogecoin accomplished this week were a successful breakout above the top of its daily Ichimoku Cloud and the RSI reaching above 70 to convert into a bull market.
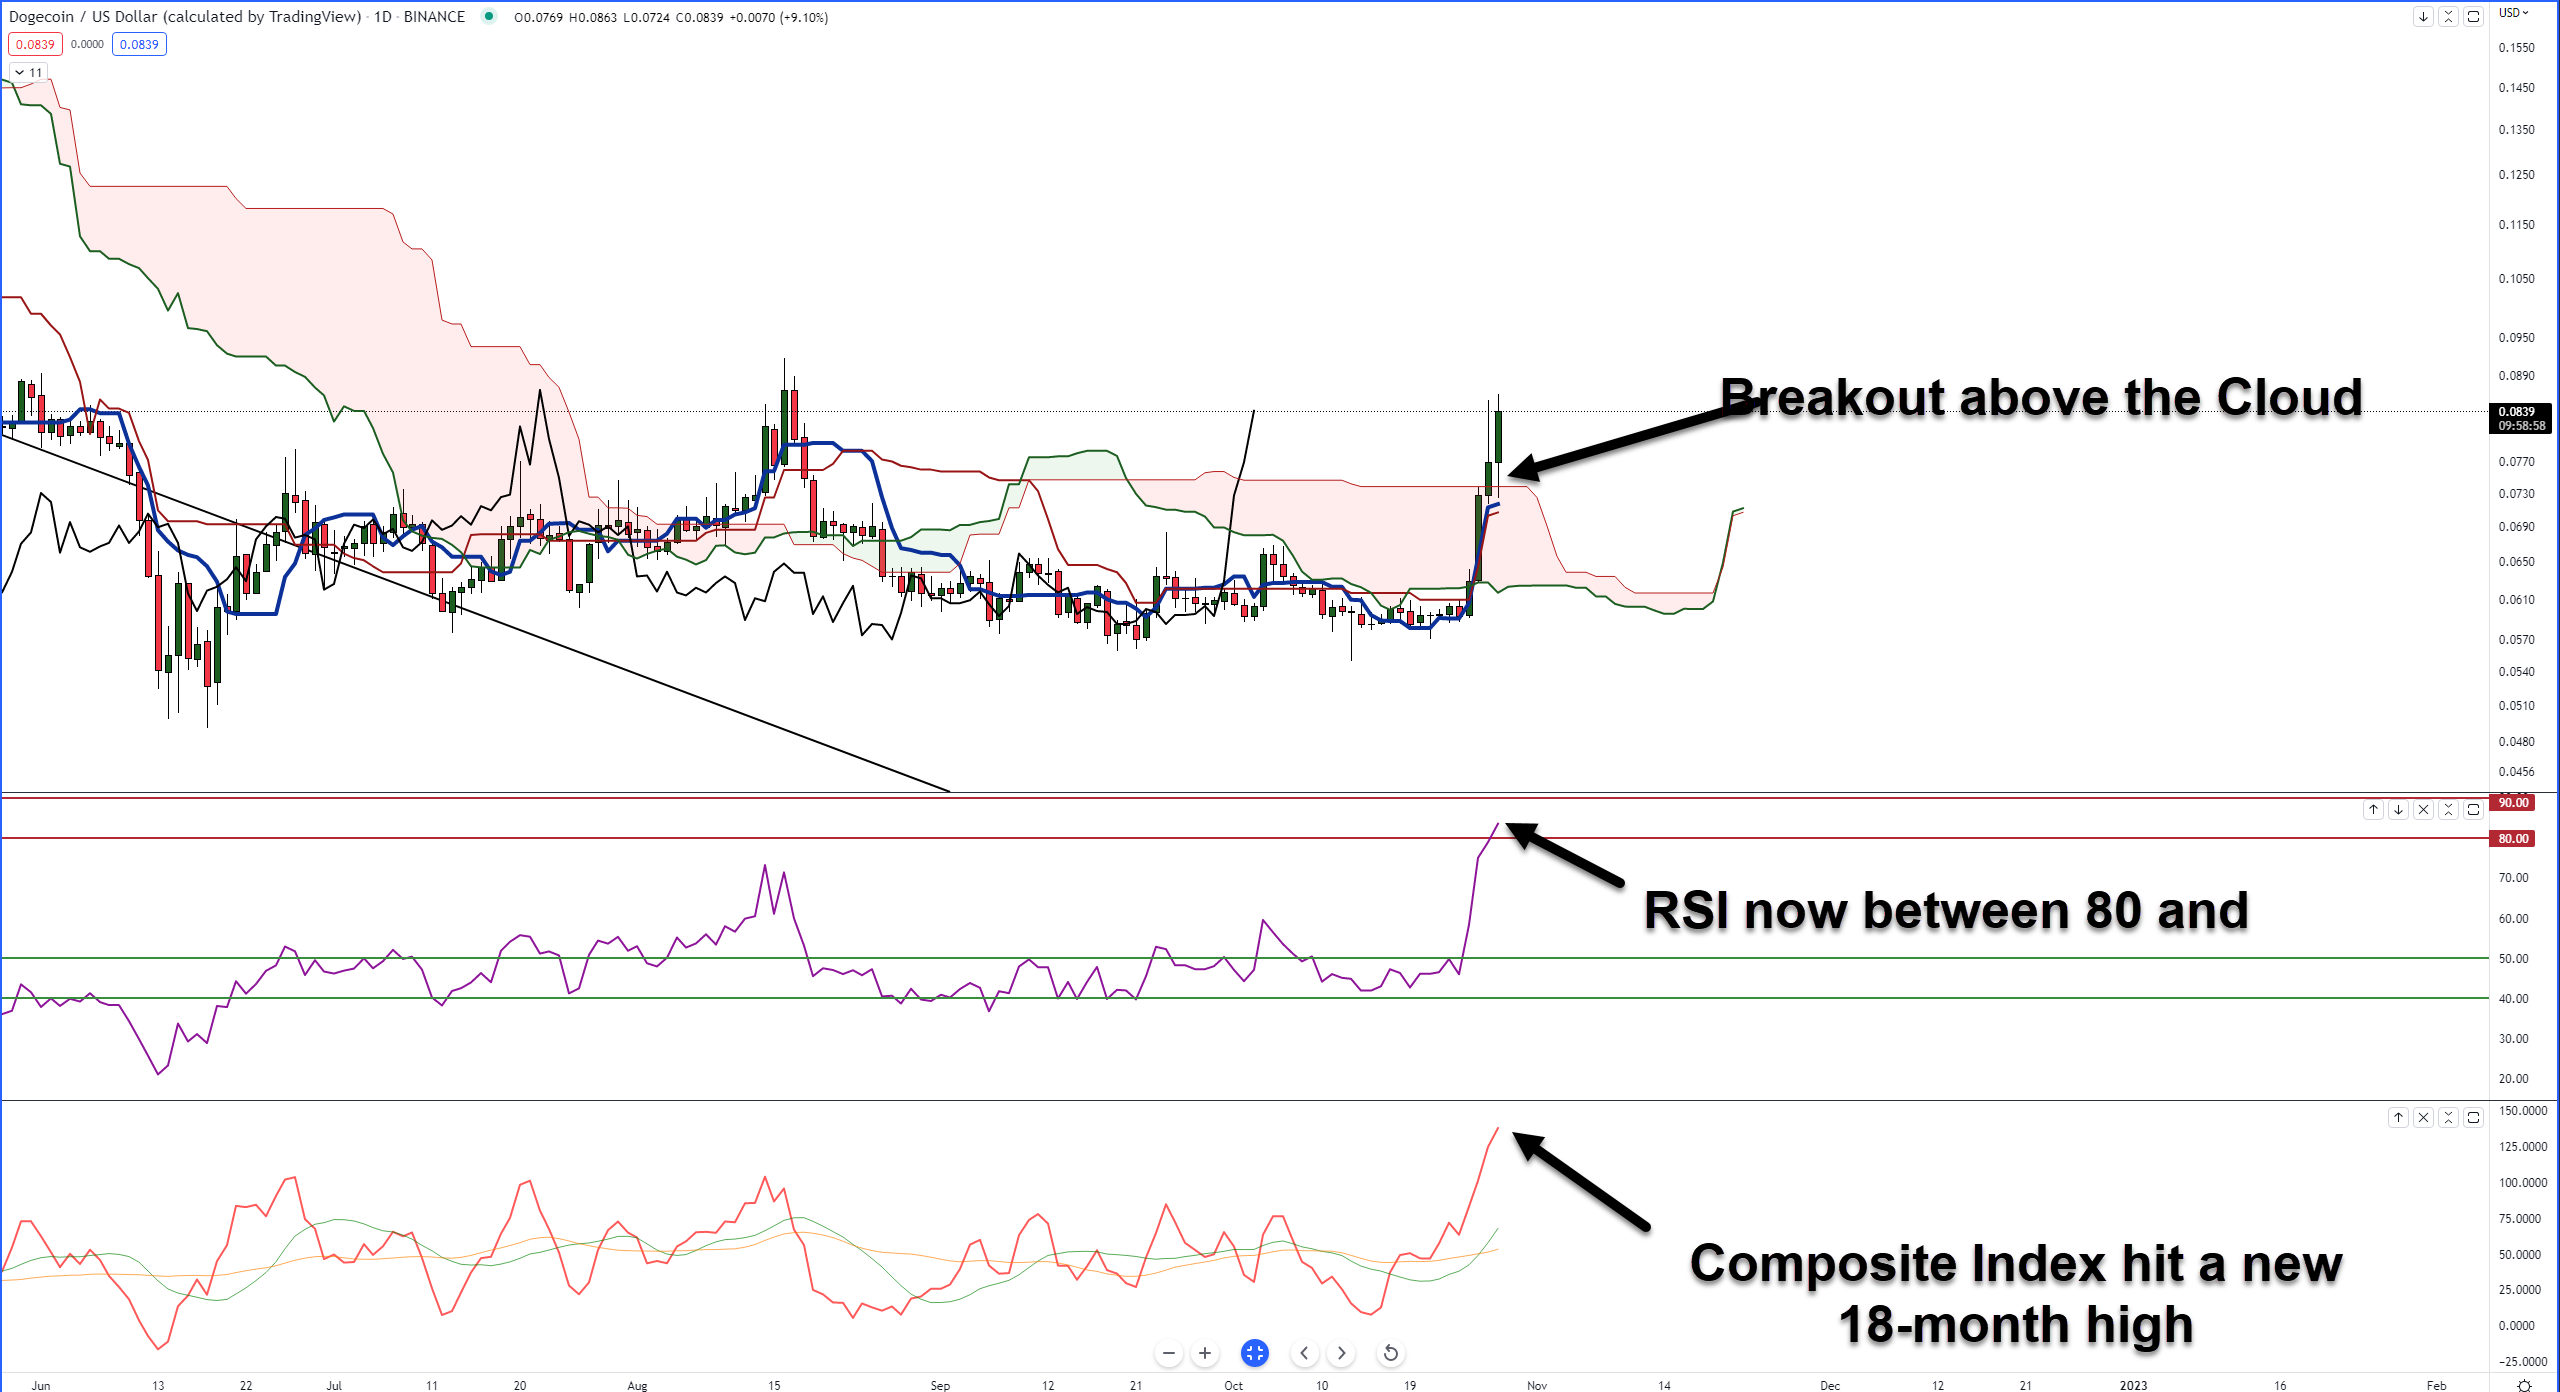
However, the weekend is coming up, and with the RSI now at the first overbought level in a bull market (80) and the Composite Index hitting an 18-month high, a pullback is increasingly likely. And for Ichimoku traders, a pullback to retest the breakout above the Cloud is very normal.
TL;DR Bulls
Dogecoin is just one of those cryptocurrencies that sometimes doesn’t care about technicals or fundamentals. Like a jerk in a buffet line, Dogecoin might just keep doing whatever it wants, no matter what. Ichimoku resistance on the weekly chart (not shown) doesn’t show up until around the $0.11 value area.
TL;DR Bears
A pullback to test the top of the Ichimoku Cloud is increasingly likely. Analysts and traders are watching the $0.074 level to see if it will hold as support or fail – if Dogecoin retraces for a retest.
The Bad
Not too long ago, Quant ($QNT.X) was one of the best performers and the only winner in a week of losers. Now it’s dead last with a -4.71% loss for the week. However, looking at it from a 3-month or a 6-month perspective, it’s the only $2 billion-plus crypto that is positive. +57$ and +81%, respectively.
So, all in all, not bad – but still the biggest loser.
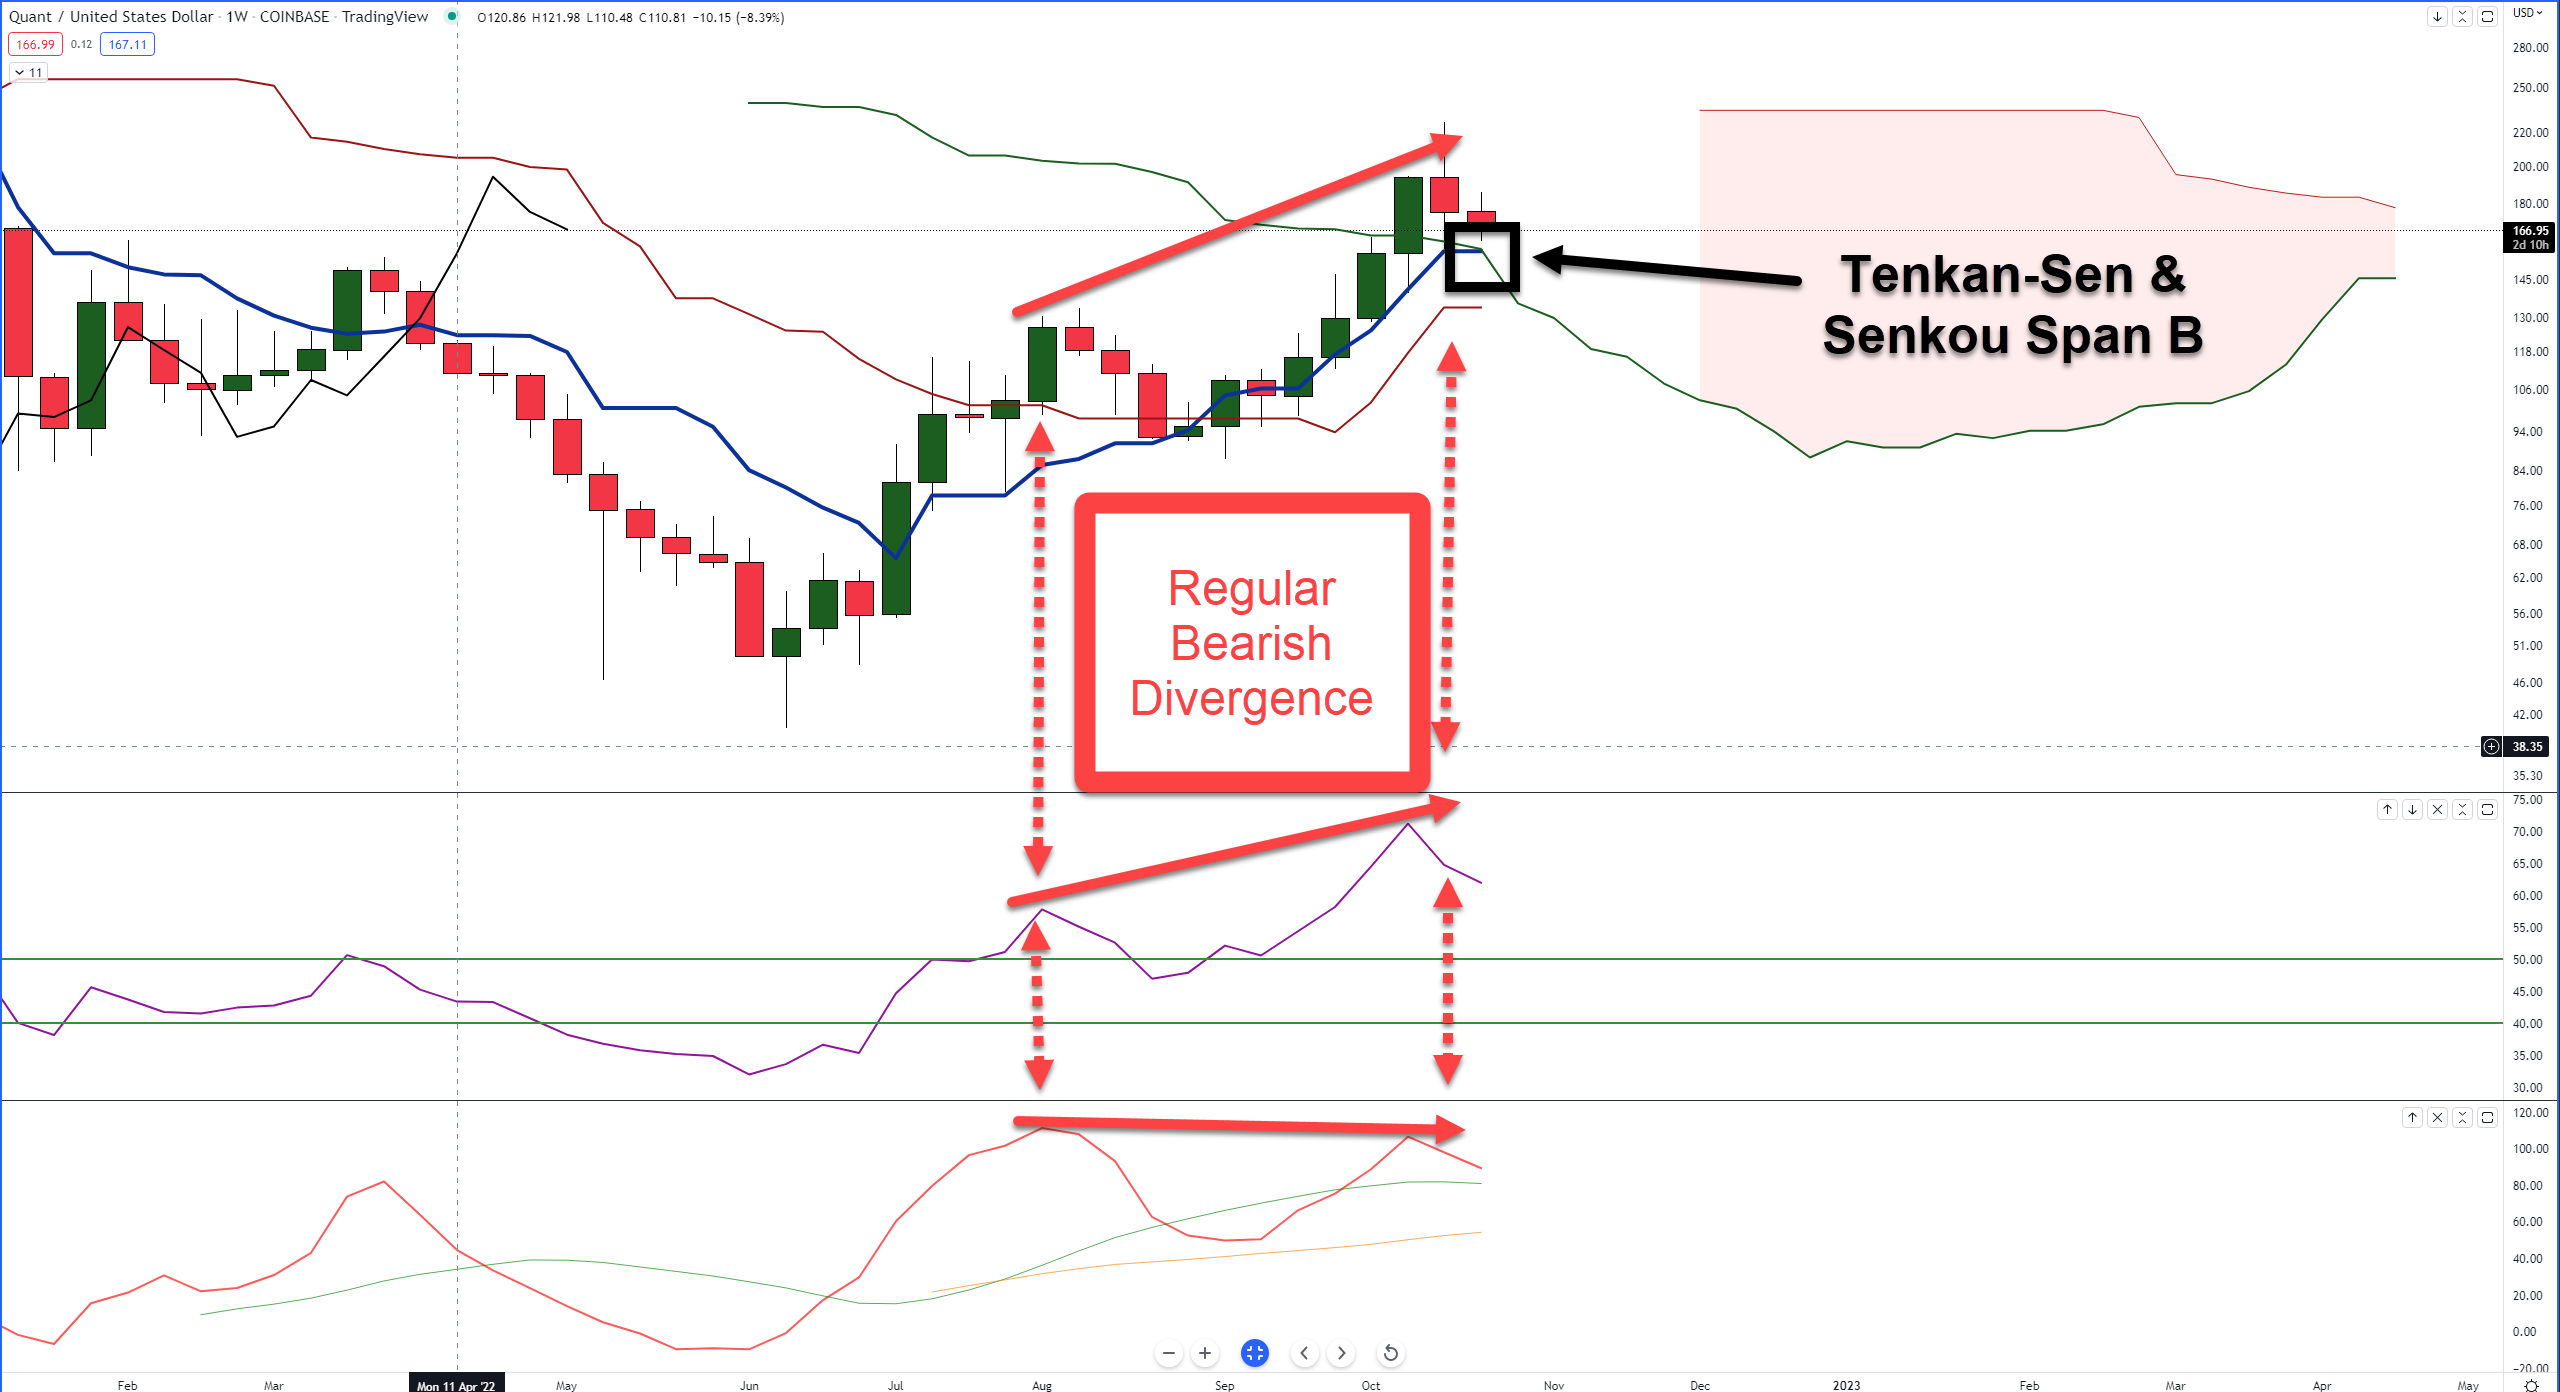
On Quant’s weekly Ichimoku chart, there’s significant support structure now near $158 where Senkou Span B and the Tenkan-Sen exist. However, regular bearish divergence between the Composite Index and both the candlestick chart and RSI – but the RSI has not yet hit its first overbought level at 80.
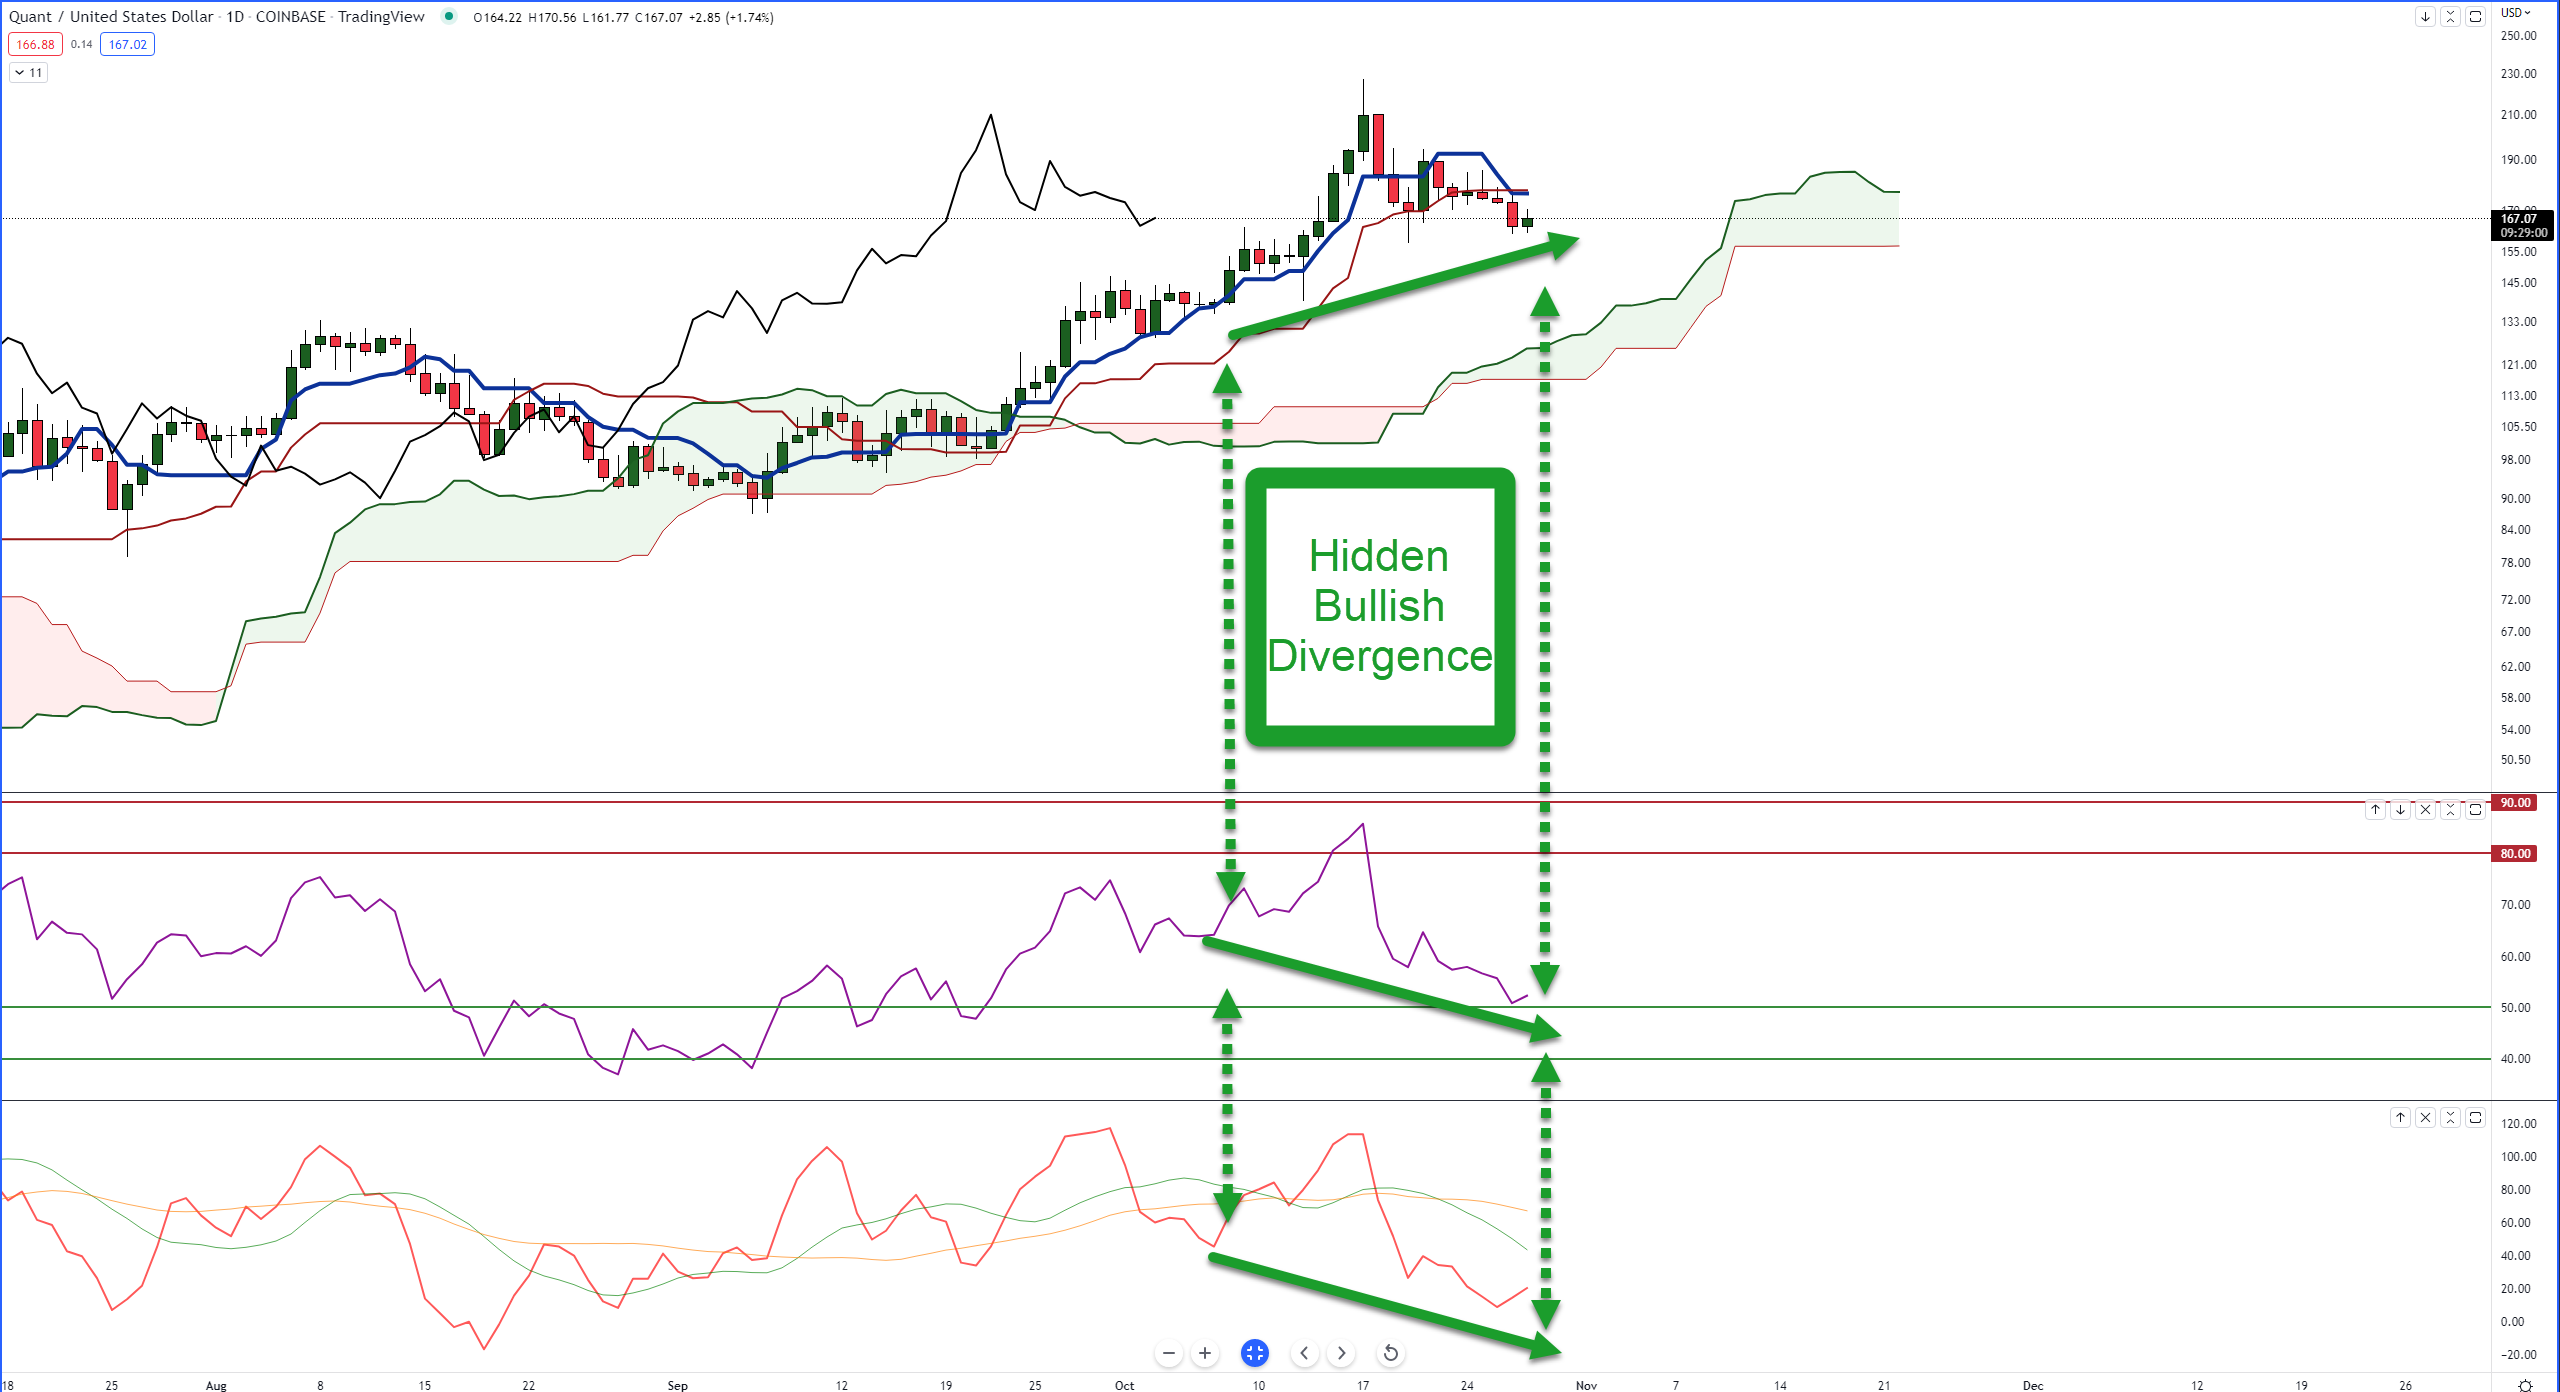
From a daily chart perspective, it’s a bit mixed. The RSI and Composite Index oscillators are very supportive of a probable bounce. Hidden bullish divergence exists between both oscillators and the candlestick chart -, but price is below the Tenkan-Sen and Kijun-Sen.
When the weekly and daily charts show mixed biases, it’s often a warning sign that things will get choppy. Given Quant has led the crypto space in it performance, consolidation while the rest of the market catches up is very normal.
TL;DR
Mixed biases on the daily and weekly charts indicate choppy and congested movement is the most likely condition for Quant in the near future.
The Ugly
The crypto winning the award for Ugly goes to Stellar ($XLM.X). How Stellar has maintained such a high market cap amongst its peers is really impressive or really crazy – maybe both. Why?
Because out of all the major $2 billion+ market cap cryptocurrencies out there, Stellar is the only one not to have made a new all-time high in ______. This is where you guess long it’s been since Stellar made a new all-time high.
2022? 2021? 2020? 2019? Wrong.
Stellar has not made a new all-time high since January 3, 2018 – we’re coming up on five years. That’s just nuts. But the ugly doesn’t stop there.
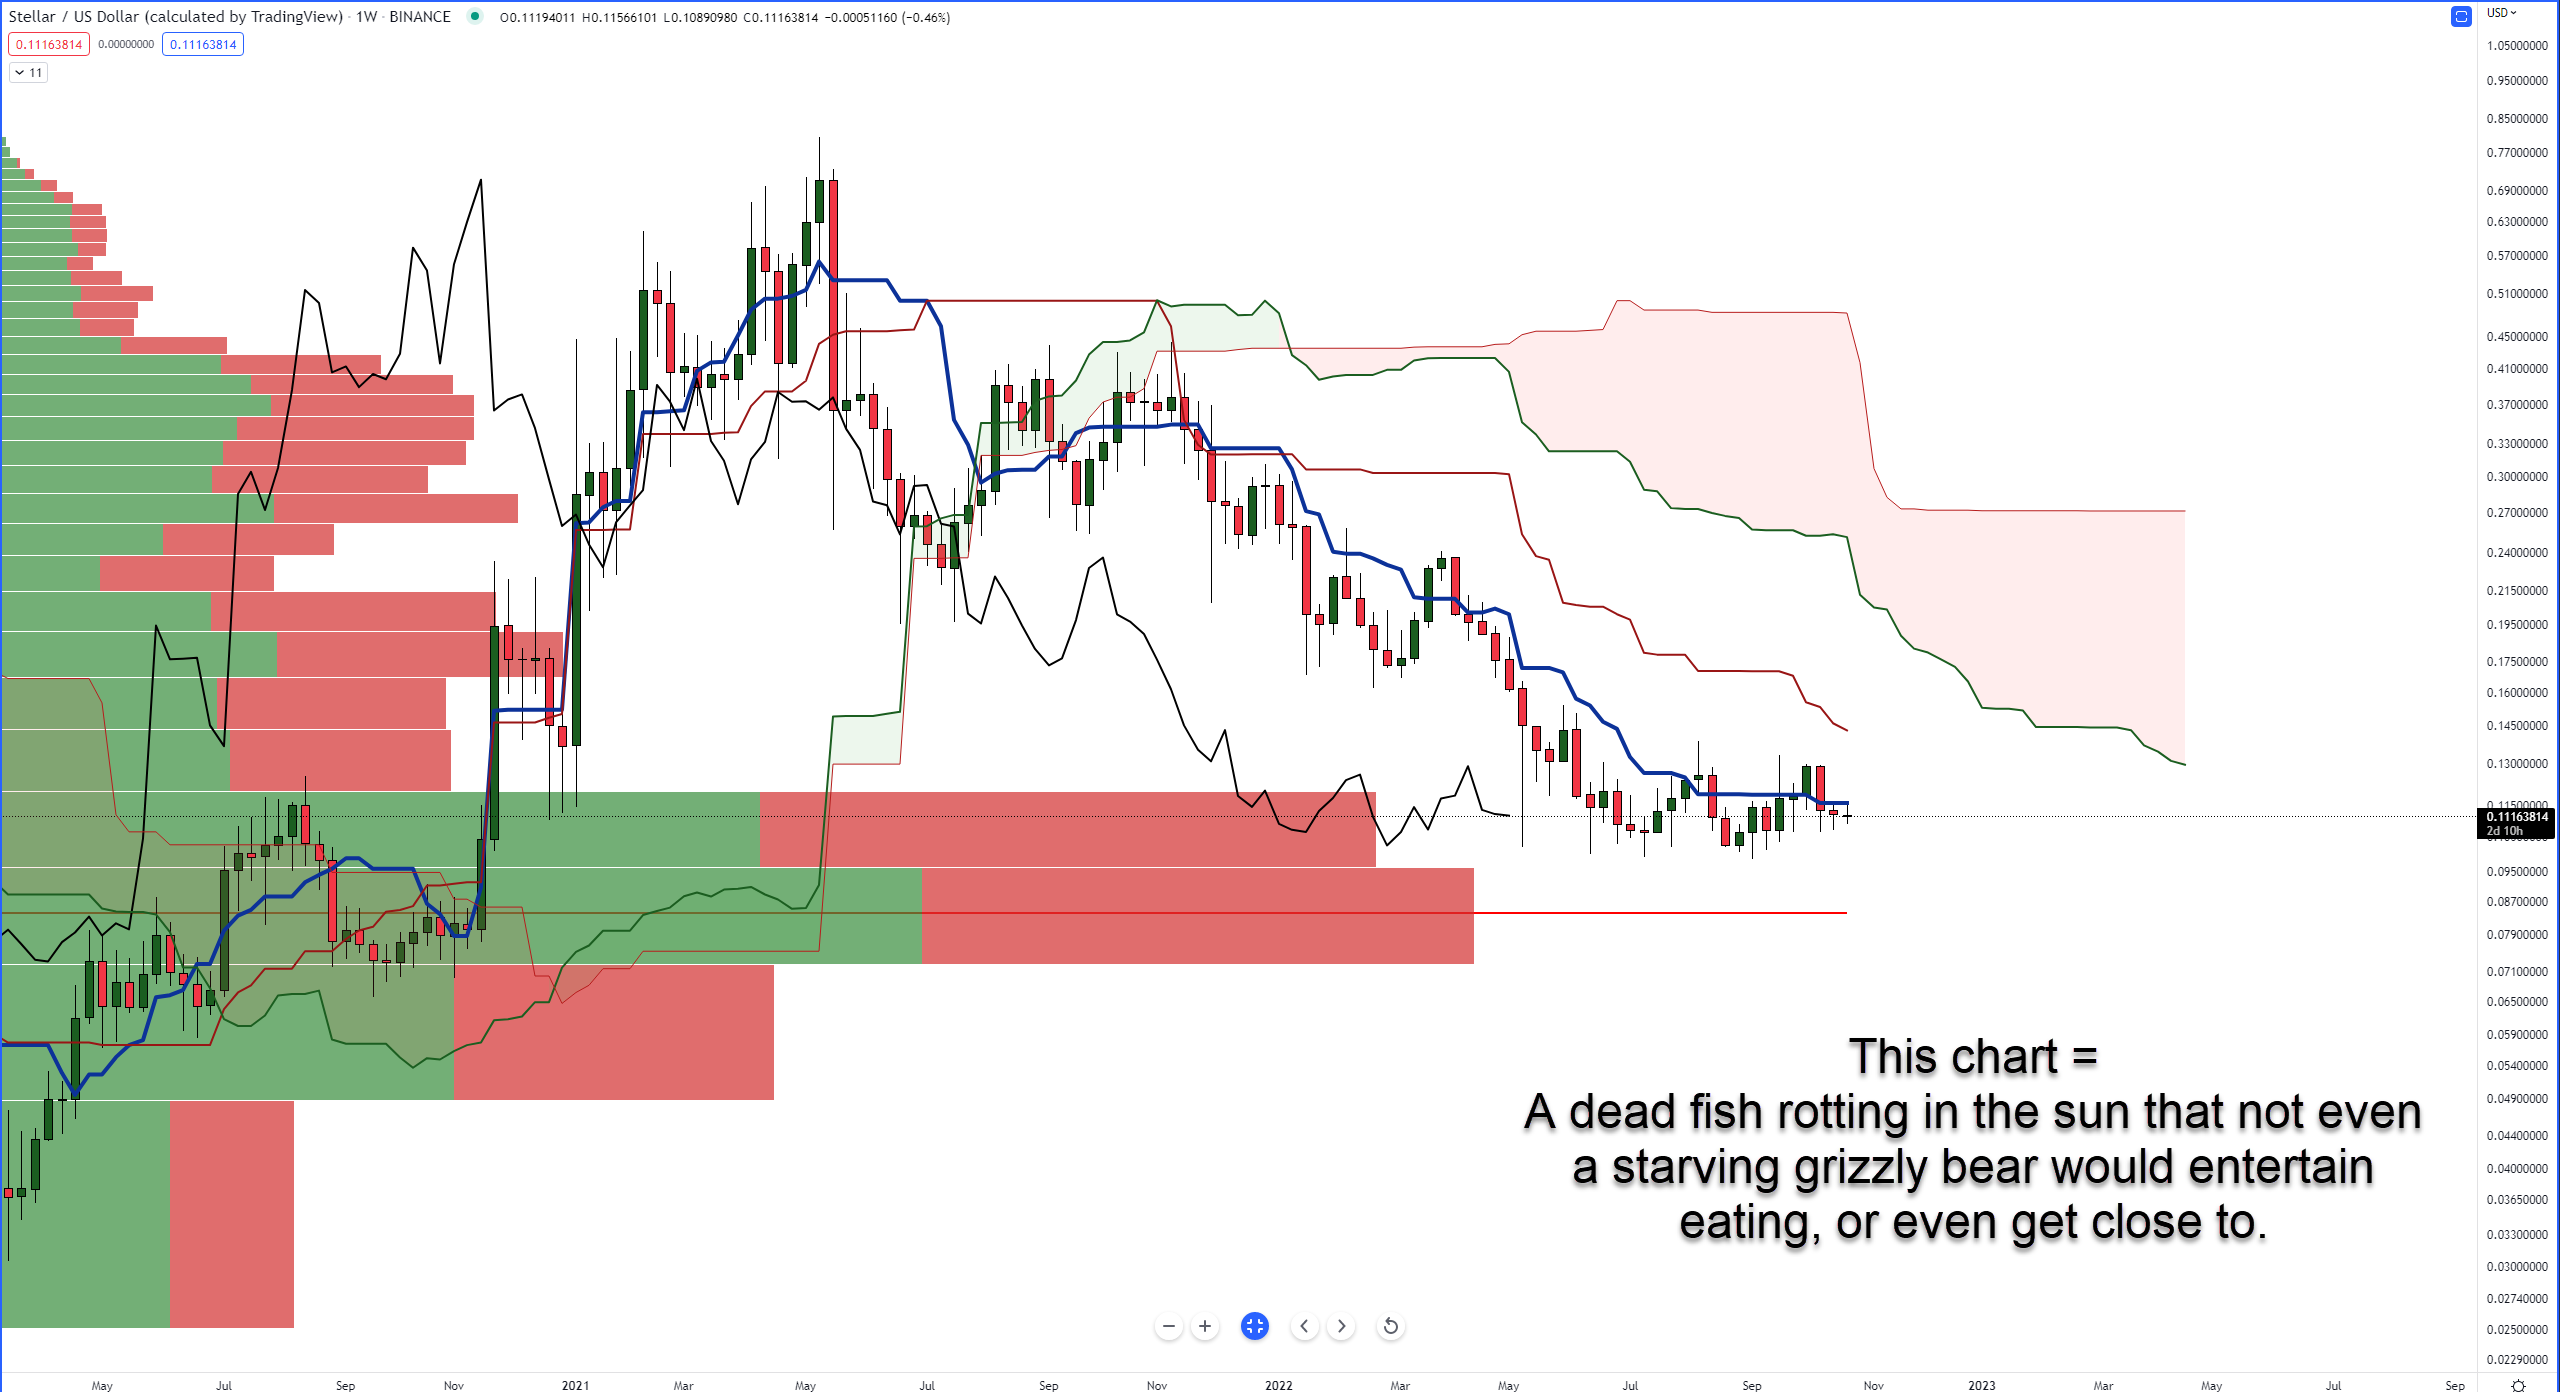
If you draw a Volume Profile starting on the Covid Crash low in March 2020, almost every single top 100 market cap crypto has developed a VPOC right where it’s trading now or slightly above where it is trading.
Stellar hasn’t even managed to accomplish that. It’s developing a high volume node – the second largest and just the VPOC node, but its VPOC from the Covid Crash low is sitting below at $0.084. So the threat of another dip lower is there.
TL;DR
It’s a damn mess, and no one seems to care about it. It’s so close to a capitulation move that even bears are staying away from it. Like a dead fish out of the water, the bears don’t want to eat it, and no one else wants to go up to it to get rid of it. It’s just hanging around and stinking up the place.