Advertisement|Remove ads.
Billion-Dollar Crypto Wipeouts Return


Crypto traders just spent a month playing chicken with leverage and the wreckage is easy to map.
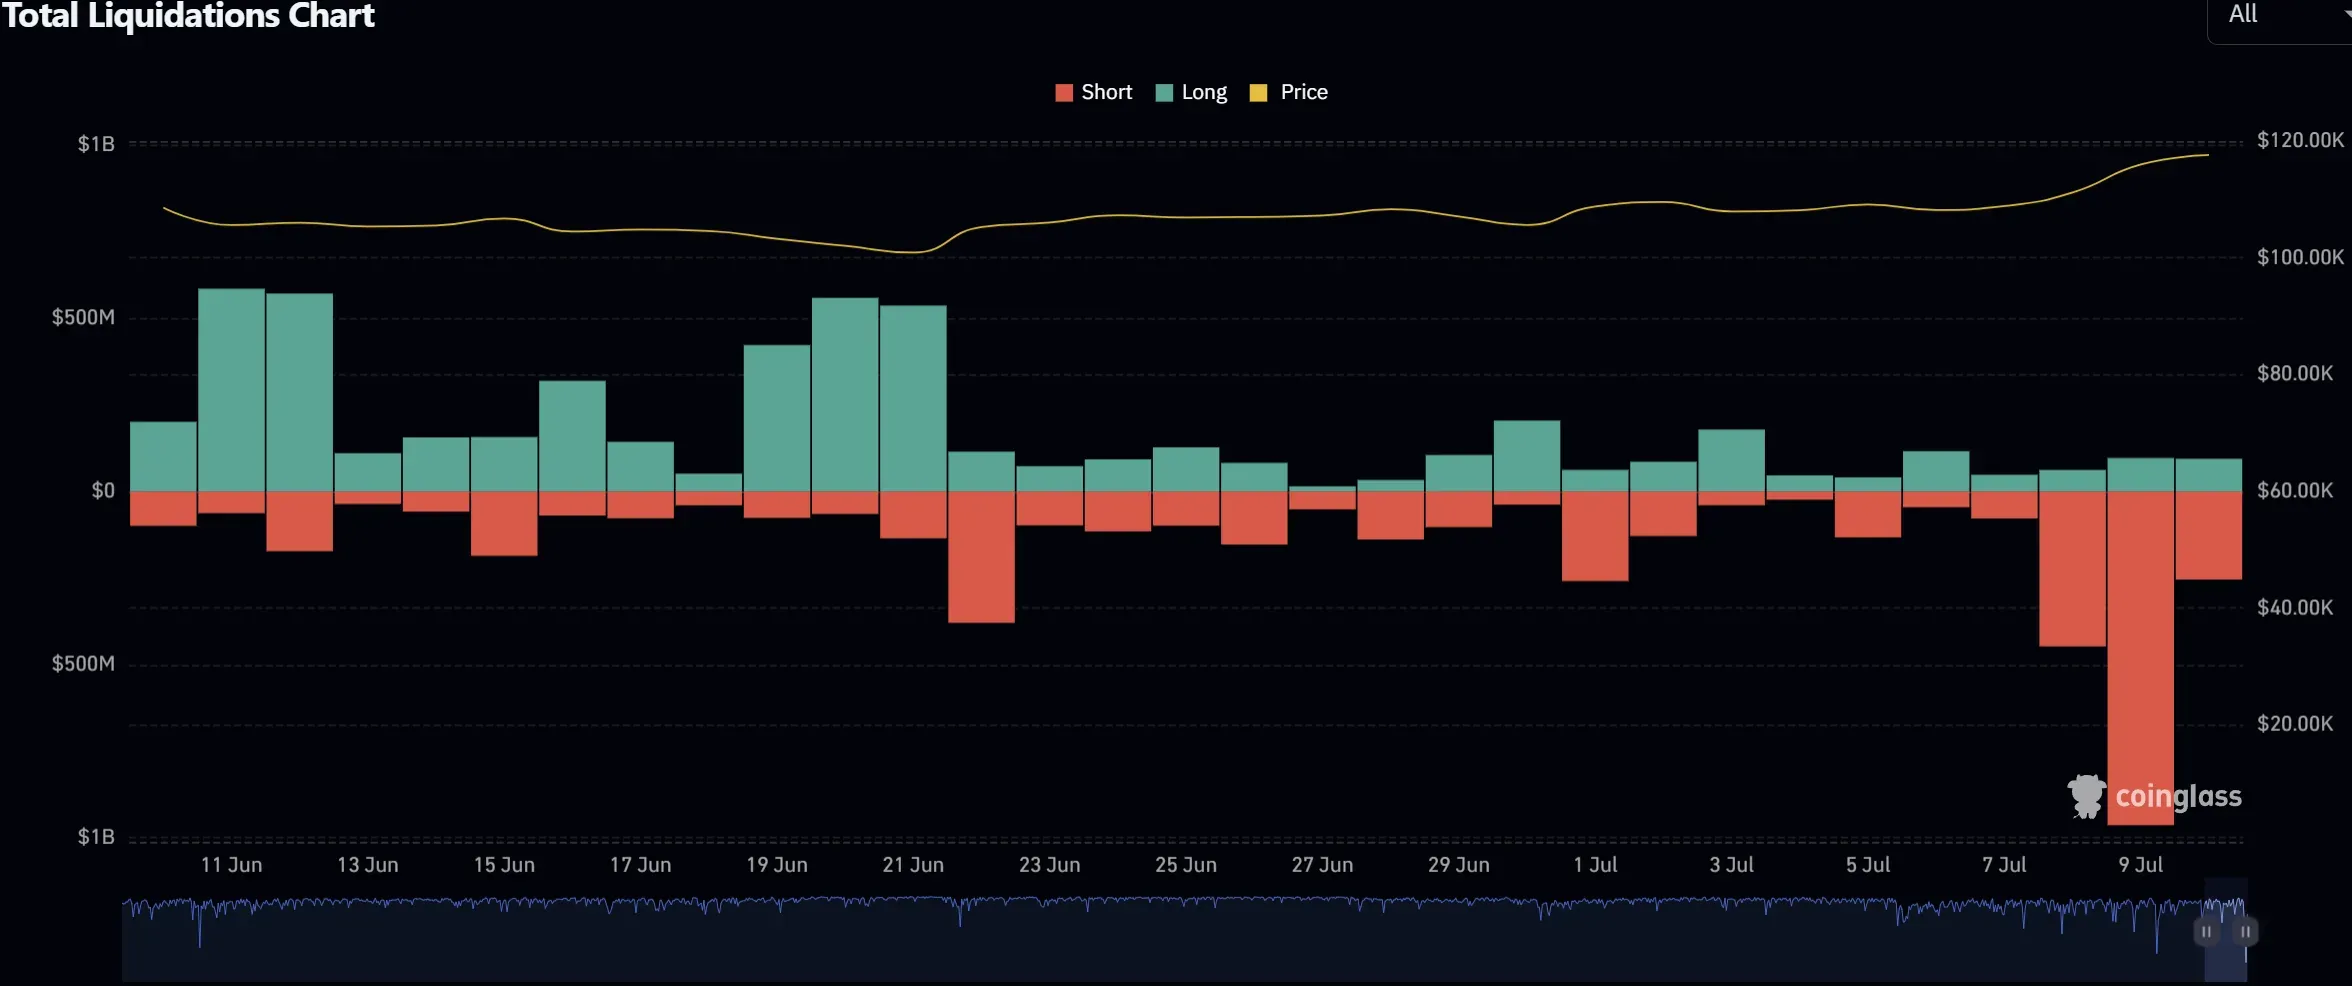
The thirty-day liquidation chart reads like a seismograph that won’t stay quiet: green spikes on June 11-12 wiped roughly $600 million in long liquidation two days running as Bitcoin slipped under macro anxiety. A week later the Fed growled about rate path and another $900 million in longs went to money heaven.
Advertisement|Remove ads.
By June 23 the crowd flipped short, only to watch a $350 million red bar print when Bitcoin (BTC) bounced. The pattern held into July 1’s window-dressing squeeze and then detonated July 9 when nearly $1 billion in short liquidation hit as price ripped toward $120,000.
Every tall bar tracks a violent wick on the price line, a reminder that volatility, not volume, shreds collateral.
Advertisement|Remove ads.
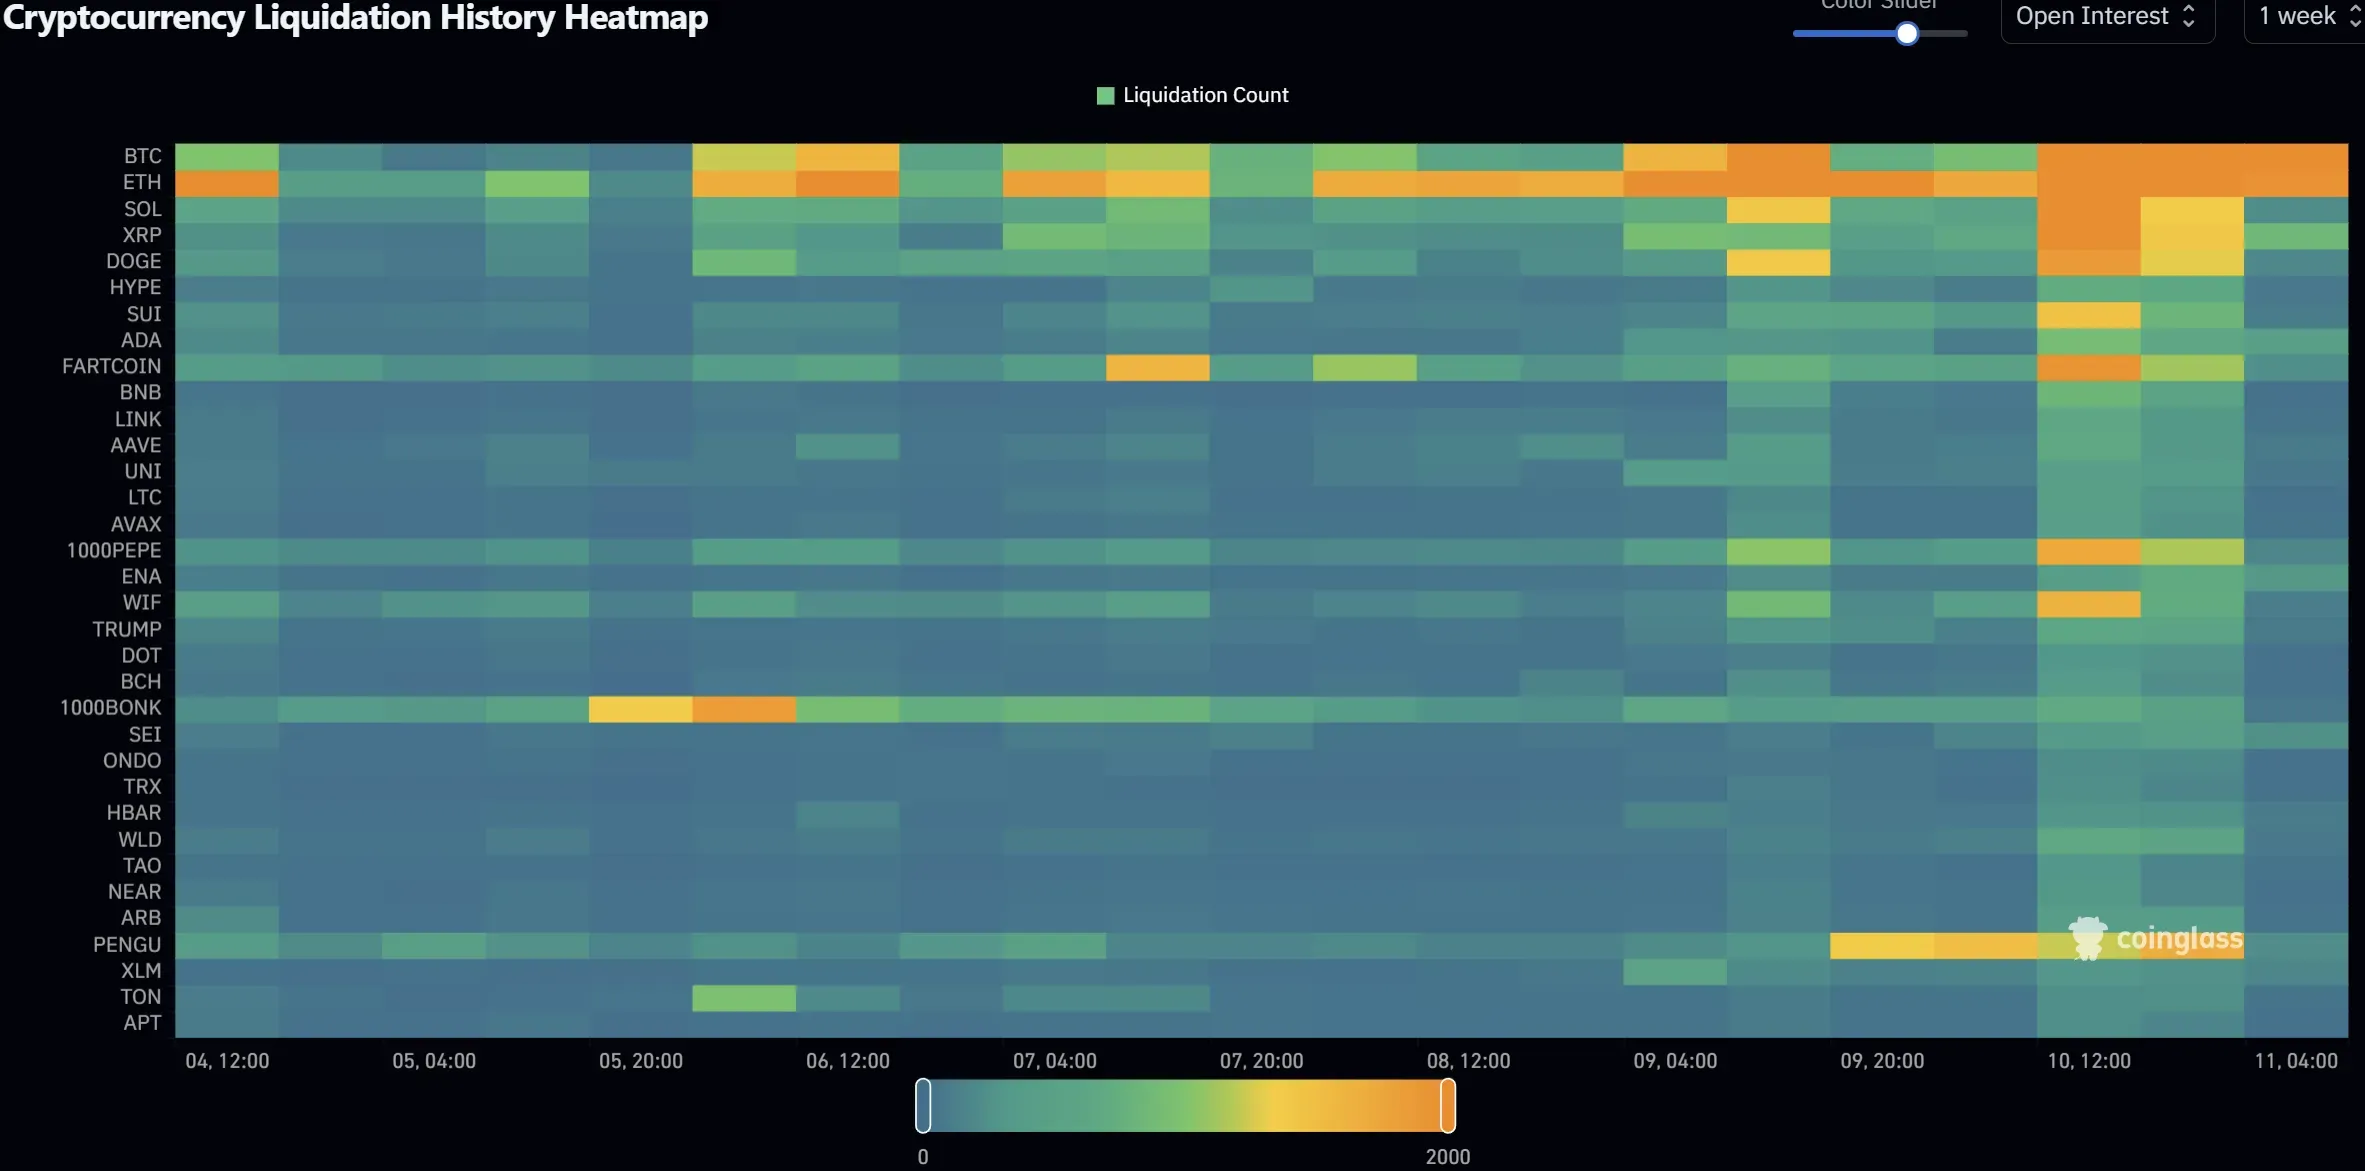
Zoom into the week of July 4-11 and the heat map glows like a bad sunburn.
A Friday payroll beat produced 1,500 BTC stop-outs plus 1,200 Ethereum (ETH), flipping majors from green to orange in a single hour. Meme-coin tourists arrived next: 1,000 BONK (BONK) lit multiple orange boxes over the July 5-6 weekend as retail chased the wrong candle.
By July 9 the board was wall-to-wall orange with BTC maxing the 2,000-count cap and nearly every top-twenty token recording 800 or more forced closes.
Advertisement|Remove ads.
Notice the domino: majors flash first, alt rows follow within three hourly cells. Low-beta names like TON, APT, and NEAR stayed blue or green, proving that little leverage equals little drama when volatility spikes.
Big picture: the roulette wheel is spinning faster.
Two separate billion-dollar liquidation events in thirty days show traders rebuild leverage almost instantly after each wipeout. Head-count ceilings jumped from 1,200 last month to 2,000 and have already been tagged twice.
Advertisement|Remove ads.
Macro headlines still pull the trigger (payroll surprises, hawkish Fed remarks) and technical breakouts occurred within minutes of every orange cluster.
One practical rule keeps paying rent: if the day’s liquidations top $600 million or if there is any print with 1,500 forced closes, a counter-move usually hunts the opposite side’s stops inside forty-eight hours.
Respect volatility, monitor liquidation prints, and size trades like you enjoy keeping your collateral instead of donating it to the funding pool.
Advertisement|Remove ads.
Also See: Band Protocol Turns Data Into an Edge
For updates and corrections, email newsroom[at]stocktwits[dot]com.
Comments posted here will also appear on symbol pages.
Latest News
/filters:format(webp)https://news.stocktwits-cdn.com/large_grocery_shopping_inflation_original_jpg_3bbd9af886.webp)
/filters:format(webp)https://st-everywhere-cms-prod.s3.us-east-1.amazonaws.com/Rounak_Author_Image_7607005b05.png) Rounak Jain·9m ago
Rounak Jain·9m ago/filters:format(webp)https://news.stocktwits-cdn.com/large_Getty_Images_1401171512_7_jpg_ff7adea960.webp)
/filters:format(webp)https://news.stocktwits-cdn.com/IMG_6979_jpg_a2a1032fdc.webp) Ahmed Farhath·21m ago
Ahmed Farhath·21m ago/filters:format(webp)https://news.stocktwits-cdn.com/large_new_york_stock_exchange_jpg_e1f85c0d8c.webp)
/filters:format(webp)https://news.stocktwits-cdn.com/Anushka_Basu_make_me_smile_in_the_picture_b92832aa_af59_4141_aacc_4180d2241ba8_1_2_png_1086e0ed8c.webp) Anushka Basu·25m ago
Anushka Basu·25m ago/filters:format(webp)https://news.stocktwits-cdn.com/large_Getty_Images_2262715245_jpg_18e5b55d66.webp)
/filters:format(webp)https://st-everywhere-cms-prod.s3.us-east-1.amazonaws.com/Prabhjote_DP_67623a9828.jpg) Prabhjote Gill·50m ago
Prabhjote Gill·50m ago/filters:format(webp)https://st-everywhere-cms-prod.s3.us-east-1.amazonaws.com/large_parazero_technologies_drone_representative_resized_f67140d5c3.jpg) Rounak Jain·1h ago
Rounak Jain·1h ago/filters:format(webp)https://news.stocktwits-cdn.com/large_Getty_Images_2274484367_jpg_e7062348b5.webp) Rounak Jain·2h ago
Rounak Jain·2h ago