MSTR’s Michael Saylor Drops Another ‘Orange Dots’ Hint—As STRC Demand Rises Worldwide


- Strategy chairman Michael Saylor shared a chart showing the company’s Bitcoin purchase history, hinting at a potential new buy.
- Strategy currently holds 738,731 BTC acquired through 102 purchases at an average price of $75,863 per Bitcoin.
- Rising global demand for Strategy’s Perpetual Stretch instrument and growing institutional interest have supported the company’s Bitcoin acquisition strategy.
Advertisement|Remove ads.
Michael Saylor, executive chairman of Strategy (MSTR), has hinted that the company might be getting ready to buy more Bitcoin (BTC).
On Sunday, Saylor posted a StrategyTracker chart that showed Strategy's history of buying Bitcoin and said, "Stretch the Orange Dots." The orange dots on the chart show the company's individual Bitcoin purchases over time.
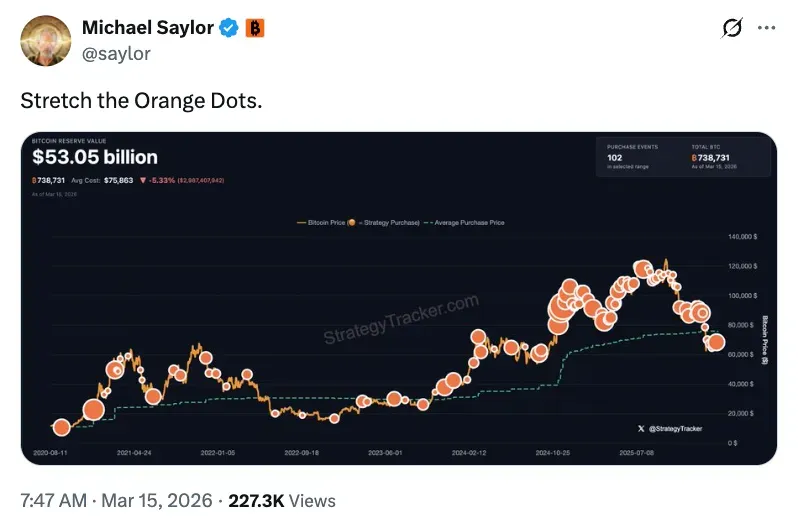
Strategy currently has about 738,731 BTC, obtained through 102 purchases. The average price it paid for each Bitcoin was about $75,863. As of Sunday, the company's Bitcoin reserves are worth about $53.05 billion at current market prices.
Advertisement|Remove ads.
Saylor has posted similar charts before announcing new purchases, which has led market watchers to expect another buy soon.
STRC Demand Grows Around The World
Strategy buys Bitcoin using corporate financing tools such as convertible debt and equity-linked instruments like Perpetual Stretch (STRC). The Roxom platform data show STRC growing around the world. Borja Martel Seward, Roxom CEO, recently shared a map showing strong demand for STRC across North America, Europe, Asia, and South America.
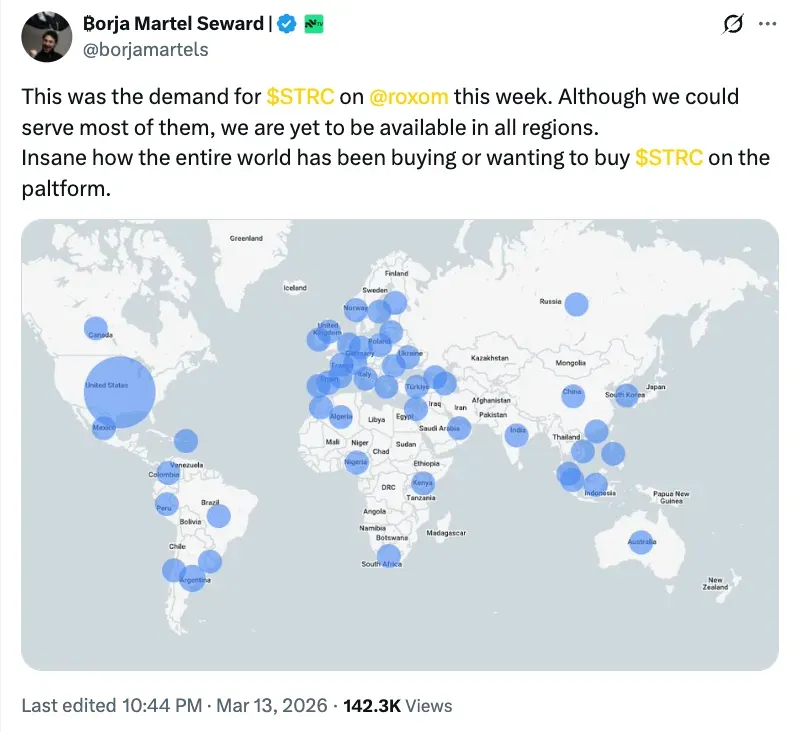
“This was the demand for $STRC on @roxom this week,” Seward wrote. “Insane how the entire world has been buying or wanting to buy $STRC on the platform.”
Advertisement|Remove ads.
Elequin Capital LP, a New York-based hedge fund, increased its stake in Strategy by 134.9% in the third quarter, according to a recent filing with the U.S. Securities and Exchange Commission (SEC). The company bought 17,683 additional shares, bringing its total to 30,794. At the time of the filing, the investment was worth about $9.92 million and made up 0.5% of Elequin Capital's portfolio, making Strategy the hedge fund's ninth-largest holding.
Bitcoin Catching Up
Some analysts believed that Bitcoin might still rise relative to other macro assets. Market commentator Gordon noted that investors on Wall Street were increasingly suggesting that Bitcoin could catch up with gold, silver, and global liquidity over this year. Bitcoin (BTC) was trading at $71,729.14, up about 0.7% over the past 24 hours.

Bitcoin was trailing moves in global liquidity and precious metals. Some analysts interpreted this as a potential signal for future upside if historical correlations hold.
Advertisement|Remove ads.
Moreover, Bitcoin’s 200-week chart moving averages showed that it was trading above key long-term support levels following the most recent halving cycle.
Historically, Bitcoin corrections have often found support near the 200-week arithmetic and geometric moving averages, before entering new expansion phases during subsequent market cycles.
Get updates to this story developing directly on Stocktwits.
Advertisement|Remove ads.
For updates and corrections, email newsroom[at]stocktwits[dot]com.
Comments posted here will also appear on symbol pages.
Latest News
/filters:format(webp)https://news.stocktwits-cdn.com/large_Getty_Images_2238365646_jpg_b148b3ee9b.webp)
/filters:format(webp)https://news.stocktwits-cdn.com/shivani_photo_jpg_dd6e01afa4.webp) Shivani Kumaresan·10m ago
Shivani Kumaresan·10m ago/filters:format(webp)https://news.stocktwits-cdn.com/large_SK_Hynix_resized_jpg_c0818a3b7e.webp)
/filters:format(webp)https://st-everywhere-cms-prod.s3.us-east-1.amazonaws.com/IMG_9209_1_d9c1acde92.jpeg) Yuvraj Malik·29m ago
Yuvraj Malik·29m ago/filters:format(webp)https://news.stocktwits-cdn.com/large_paypal_OG_jpg_20b795c771.webp)
/filters:format(webp)https://news.stocktwits-cdn.com/Aashika_Suresh_Profile_Picture_jpg_2acd6f446c.webp) Aashika Suresh·1h ago
Aashika Suresh·1h ago/filters:format(webp)https://news.stocktwits-cdn.com/large_Getty_Images_615650710_jpg_d79a3ffa96.webp)
/filters:format(webp)https://news.stocktwits-cdn.com/IMG_8805_JPG_6768aaedc3.webp) Deepti Sri·1h ago
Deepti Sri·1h ago/filters:format(webp)https://news.stocktwits-cdn.com/large_Goldman_Sachs_resized_c6a47f630c.webp) Aashika Suresh·2h ago
Aashika Suresh·2h ago/filters:format(webp)https://news.stocktwits-cdn.com/large_Lucid_jpg_221b9d07ec.webp) Shivani Kumaresan·2h ago
Shivani Kumaresan·2h ago