Advertisement|Remove ads.
2008-Style Mortgage Stress Returns As Gold, Stocks Slide — Bitcoin Eyes A High-Risk Zone


- Global markets showed signs of stress as U.S. stocks declined for a fourth straight week.
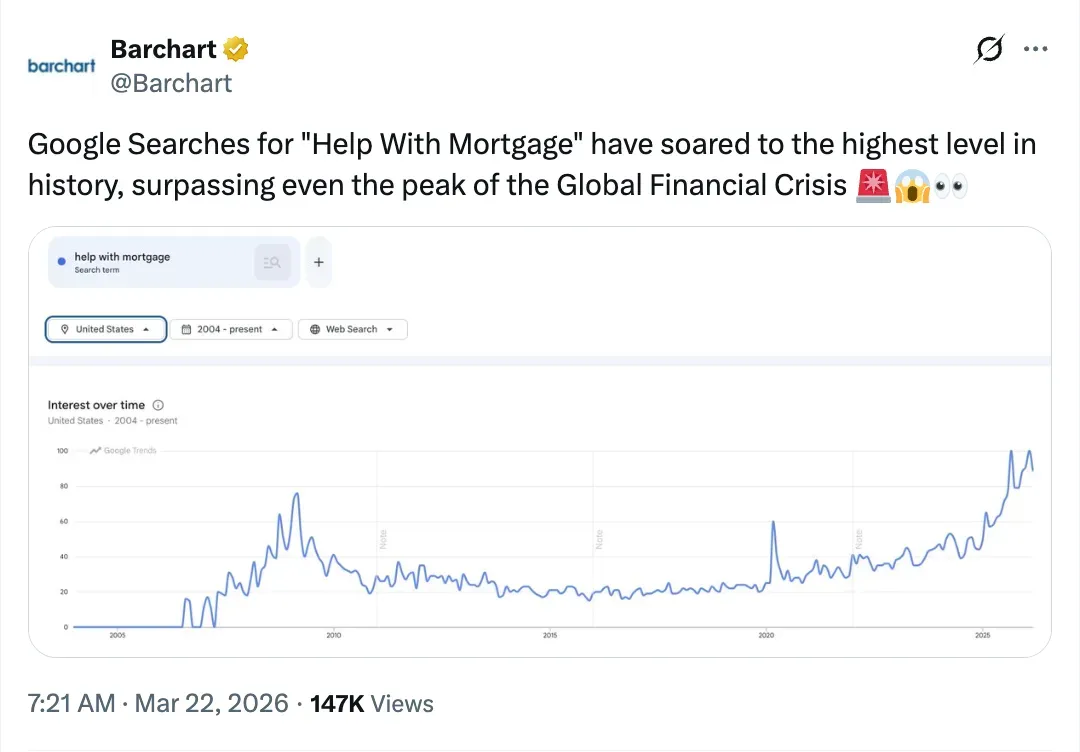
- Google searches for “help with mortgage” exceeded levels last seen during the 2008 financial crisis.
- Gold posted its steepest weekly decline since 1983, with analysts relating the drop to liquidity pressures.
Advertisement|Remove ads.
Global markets are showing signs of stress, with Google searches for "Help With Mortgage" surpassing levels seen during the 2008 financial crisis.
As rising tensions between the US and Iran spread throughout financial markets, U.S. stocks have now dropped for a fourth week in a row. Treasury yields are rising at the fastest rate in months, while the S&P 500 has fallen from its January peak, wiping out trillions in market value, as per reports.
Conventional safe havens are performing poorly simultaneously. Despite the ongoing geopolitical conflict, gold saw its steepest weekly decline since 1983. Nic Puckrin, CEO of research firm Coin Bureau, argued that gold’s decline is not a failure of its safe-haven role but rather a result of consolidation and liquidity reshuffling.
Advertisement|Remove ads.
Puckrin shared on X that, following a robust rally that was fueled in part by central bank accumulation after Russia's reserves were frozen in 2022, along with significant ETF inflows, gold had become a crowded market.
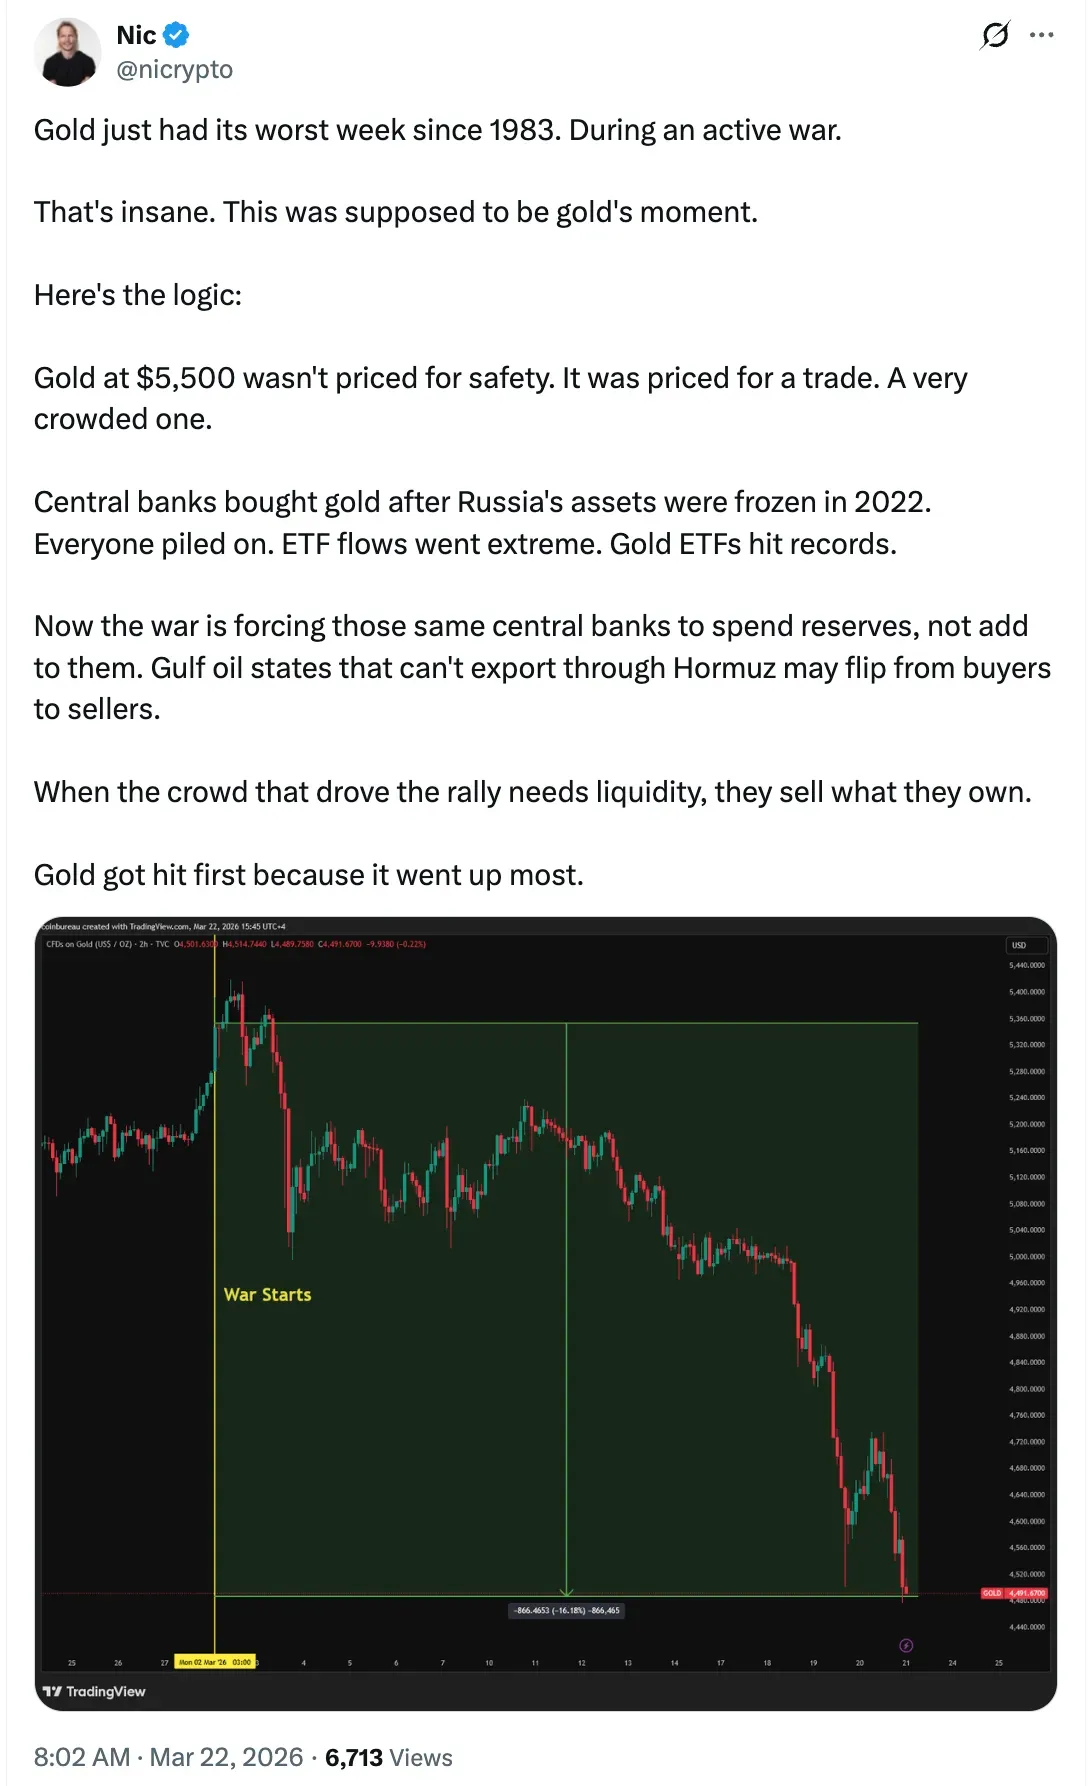
According to him, buyers are now in need of liquidity as tensions rise, especially in energy-dependent areas where disrupted oil flows may be compelling people to sell it for cash.
Bitcoin Tests Key Levels
In light of this, data on derivatives have pointed to a possible catalyst for Bitcoin (BTC). CoinGlass's liquidation heatmaps show a dense cluster of short positions above current levels, particularly in the $70,000-$75,000 range.
Advertisement|Remove ads.
To close positions, liquidations usually compel traders to repurchase the asset, driving up the price.
Bitcoin was trading at $68,722, down over 2% in the last 24 hours. On Stocktwits, retail sentiment around BTC dropped from ‘bullish’ to ‘neutral’ zone, accompanied by ‘low’ chatter levels over the past day.
In contrast, CME data for Gold futures show open interest has slightly tanked around the 430,000 level, indicating that positions are being closed rather than added, even though trading volume has increased recently, peaking near 400,000 contracts.
Advertisement|Remove ads.
The difference between falling gold prices and rising liquidation risk in Bitcoin suggests that the market is changing. Investors are getting out of crowded positions in traditional safe havens, while crypto markets are becoming more driven by leveraged positions.
However, Momentum indicators further support this, showing that Bitcoin is entering a lower-momentum phase that typically precedes consolidation. At the same time, the buildup of short positions suggests prices could rise, potentially triggering a squeeze.
Read also: Iran Issues Six-Point Ultimatum For Peace As Strait Of Hormuz Tensions Heat Up
Advertisement|Remove ads.
For updates and corrections, email newsroom[at]stocktwits[dot]com.
Comments posted here will also appear on symbol pages.
Latest News
/filters:format(webp)https://news.stocktwits-cdn.com/large_Getty_Images_2222922178_jpg_42dd8f319f.webp)
/filters:format(webp)https://news.stocktwits-cdn.com/unnamed_jpg_9dff551b50.webp) Anan Ashraf·7h ago
Anan Ashraf·7h ago/filters:format(webp)https://news.stocktwits-cdn.com/large_Getty_Images_2268819372_jpg_5a03fc4a3d.webp) Anan Ashraf·8h ago
Anan Ashraf·8h ago/filters:format(webp)https://news.stocktwits-cdn.com/large_Michael_Bury_resized_jpg_14e6fc7c2b.webp)
/filters:format(webp)https://news.stocktwits-cdn.com/Whats_App_Image_2026_05_11_at_09_45_43_1_jpeg_a08c0cf251.webp) Aveek Bhowmik·9h ago
Aveek Bhowmik·9h ago/filters:format(webp)https://news.stocktwits-cdn.com/large_nyse_OG_2_jpg_0e4e1c68f2.webp)
/filters:format(webp)https://news.stocktwits-cdn.com/1707726834303_jpg_11f20a9aa9.webp) Shashank Nayar·9h ago
Shashank Nayar·9h ago/filters:format(webp)https://news.stocktwits-cdn.com/large_rivian_r2_jpg_135a2923eb.webp) Anan Ashraf·9h ago
Anan Ashraf·9h ago/filters:format(webp)https://news.stocktwits-cdn.com/Getty_Images_2250240969_jpg_dd9be8c5ea.webp) Shashank Nayar·10h ago
Shashank Nayar·10h ago