After a strong run throughout the summer, it’s been a rough two weeks for energy-related commodities and stocks. Today, an accelerating decline helped bring the sector back to the forefront of investors’ conversation. Let’s take a look at why. 👇
In very short-term fundamental news, gasoline inventories surprised to the upside today on weak demand. That caused the commodity to extend its recent selloff. But more importantly, we also saw heating oil and crude oil selloff in tandem after holding relatively strong during gasoline’s pullback.
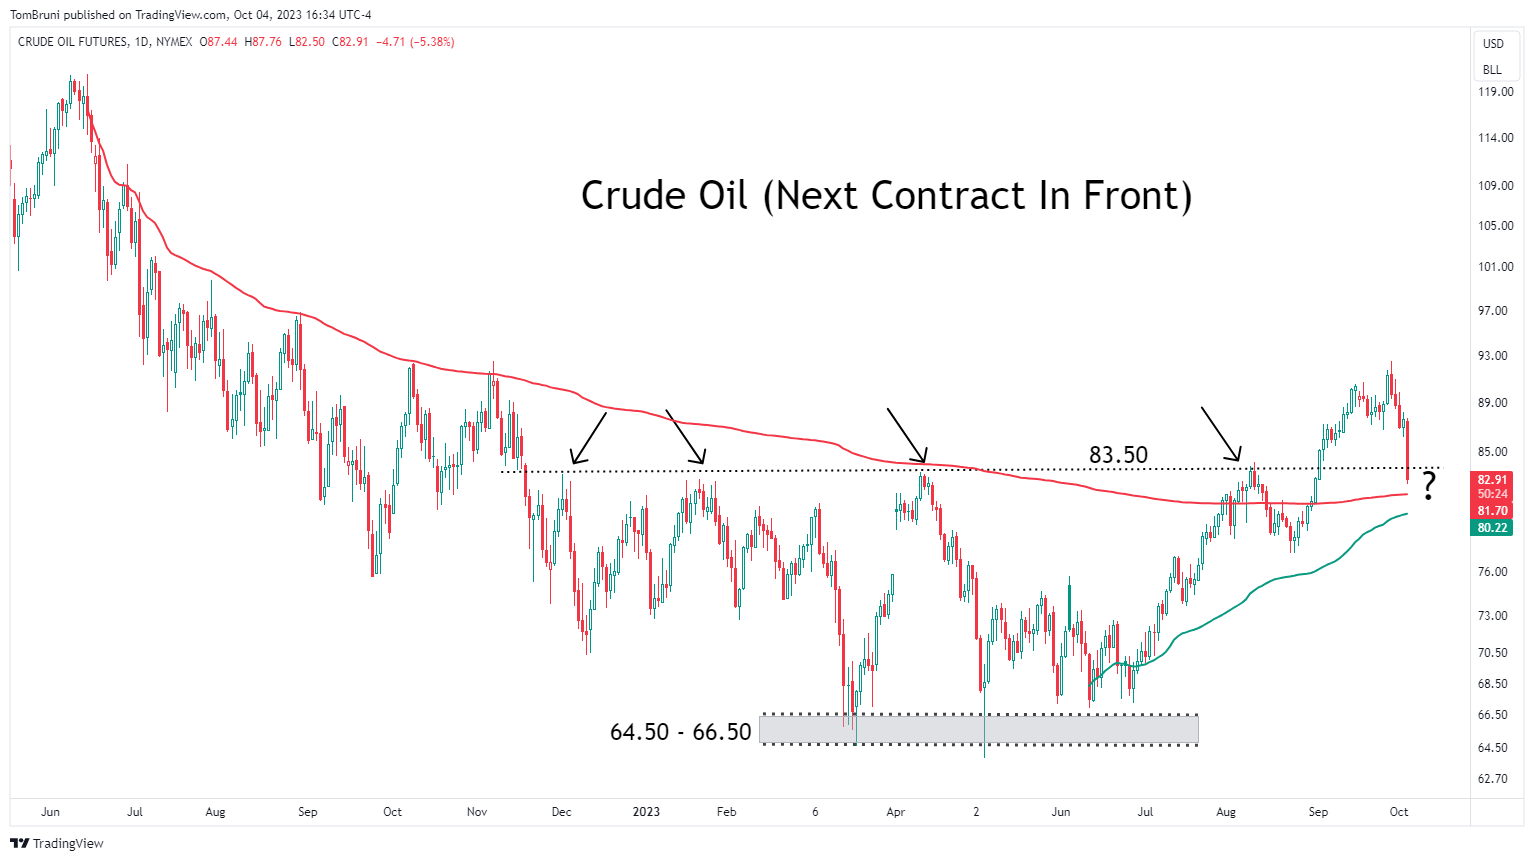
So where will crude oil and the energy sector find support? Some traders are looking at the low 80s as a potential area of support. Not only is 83.50 the level prices recently broke out above, but the volume weighted average price (VWAP) from the June 2022 highs (red line) and June 2023 lows (green line) are also in this area. 🎯
Many see this confluence of technical levels as a potential area where buyers could step back in after a sharp week-long pullback. H/T/ to Brian Shannon for sharing a similar view today. 🫡
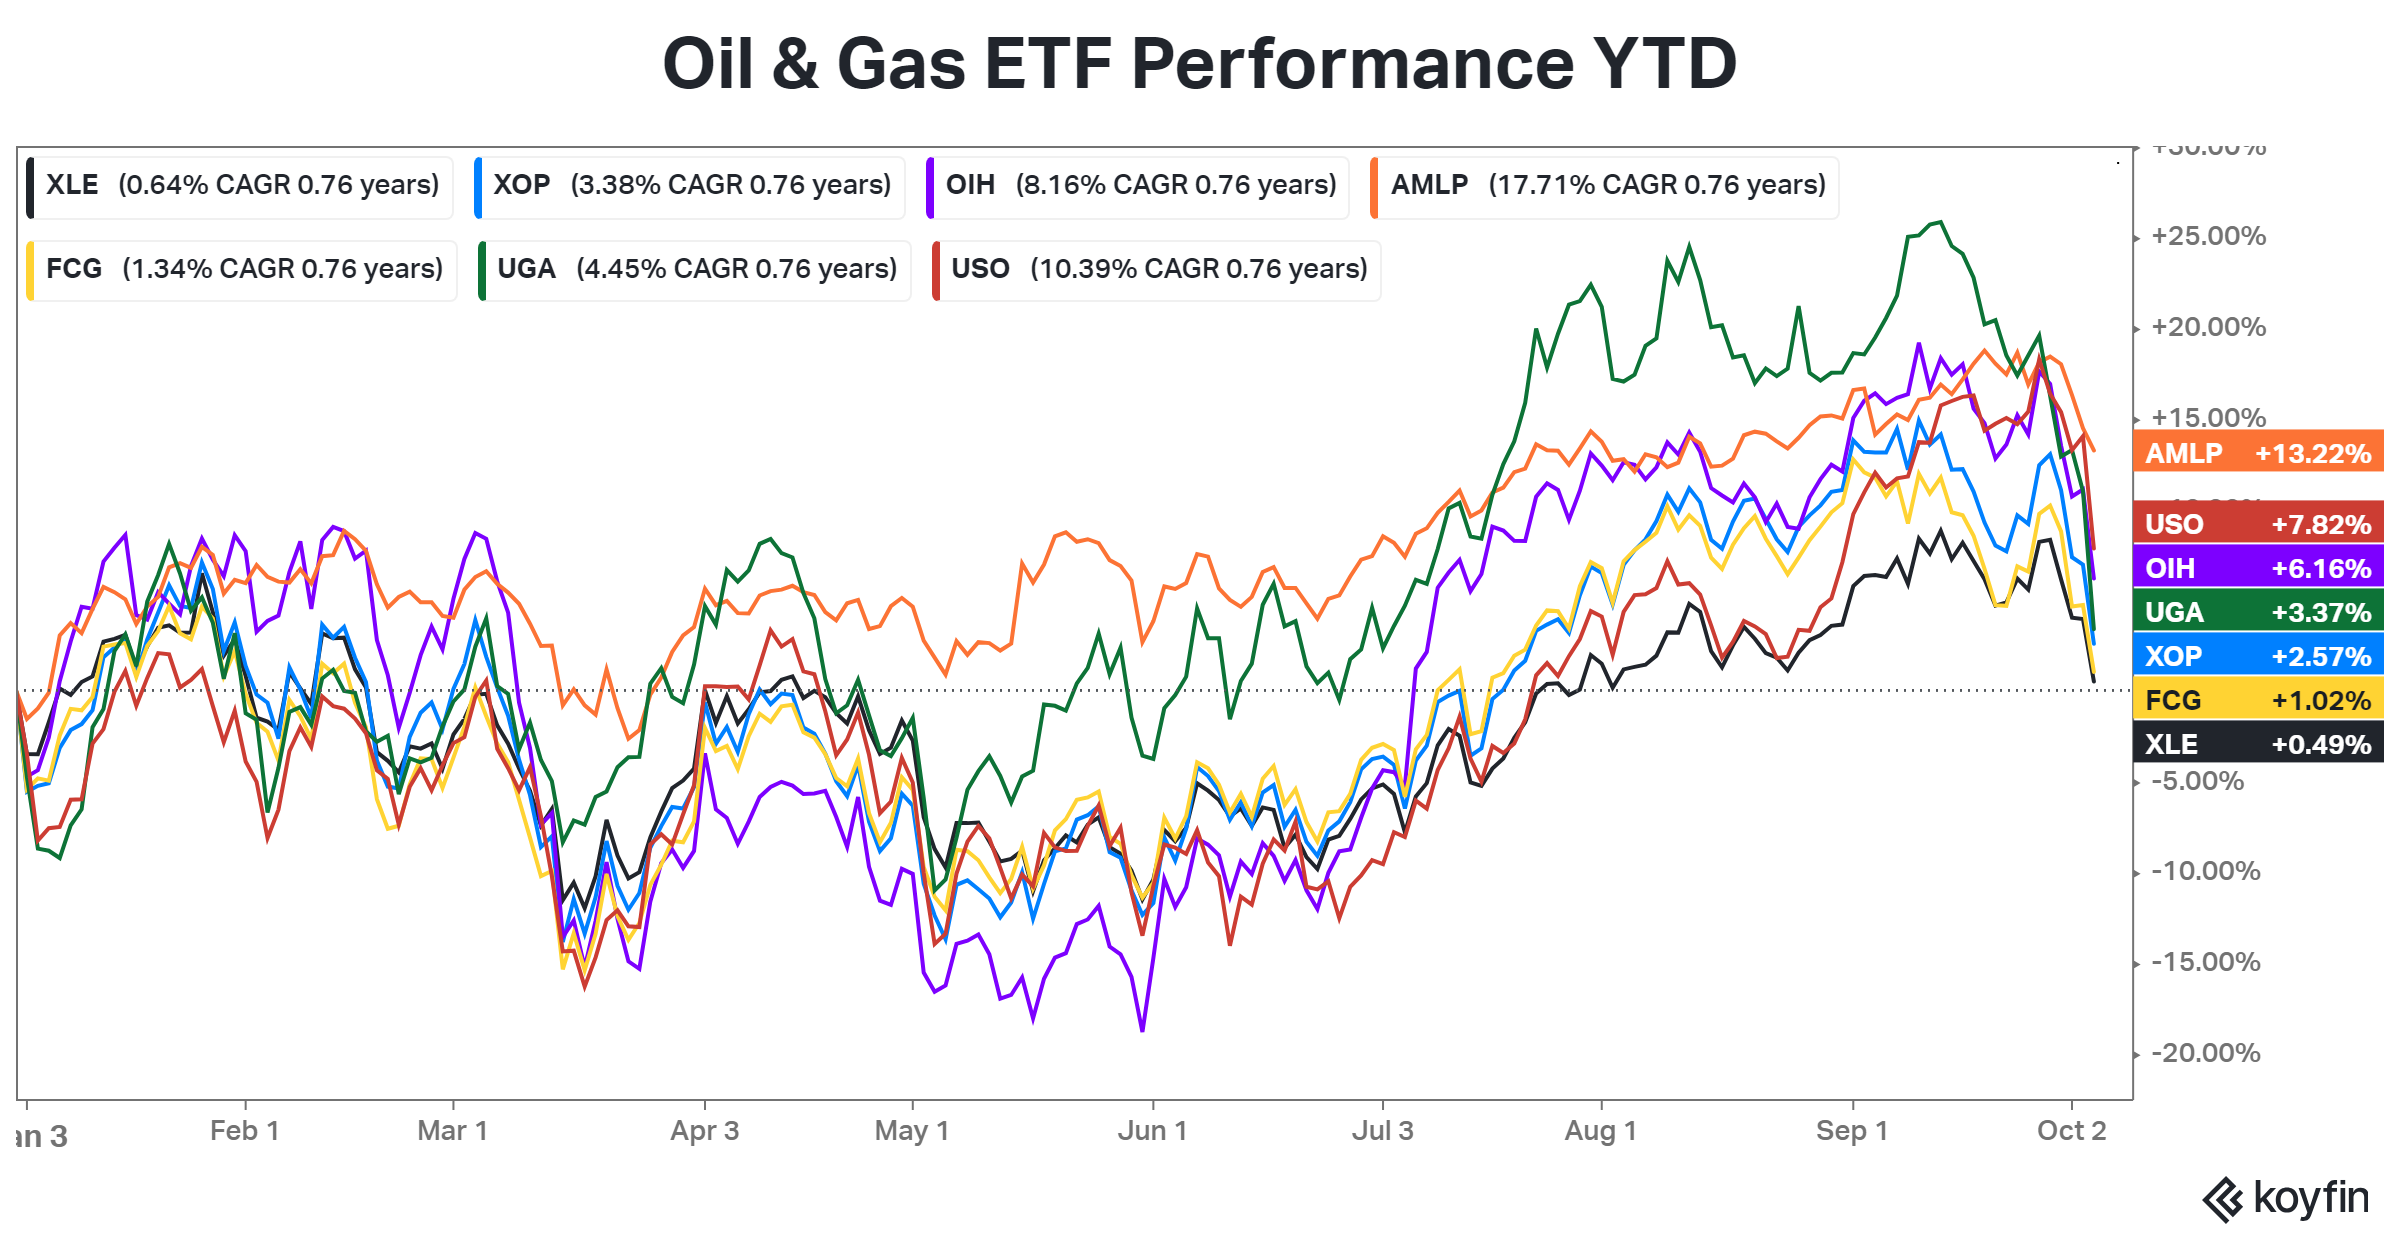
As for many of the popular energy-related ETFs, they’ve given back some of their summer gains but are hanging onto positive territory on a year-to-date basis. The question now is whether investors will use this weakness to buy the dip or if this year’s volatility is enough to keep them on the sidelines. 😬
As for renewable energy, the solar, wind, and other renewable energy sectors have struggled. Uranium has been a standout on the upside since we discussed it in June but has recently pulled back with the rest of the traditional energy sector.
Despite the weakness in solar and wind stocks, analysts have been behind the curve in downgrading them and are now chasing prices lower. For example, Sunnova Energy and Sunrun fell to 52-week lows after Truist downgraded them from buy to hold. 👎
However, some traders view this as a potential sign that sentiment is turning too pessimistic on the space, as both stocks are already down over 80% below their highs. The solar ETF $TAN has also fallen over 60% from its 2021 highs. 🌦️
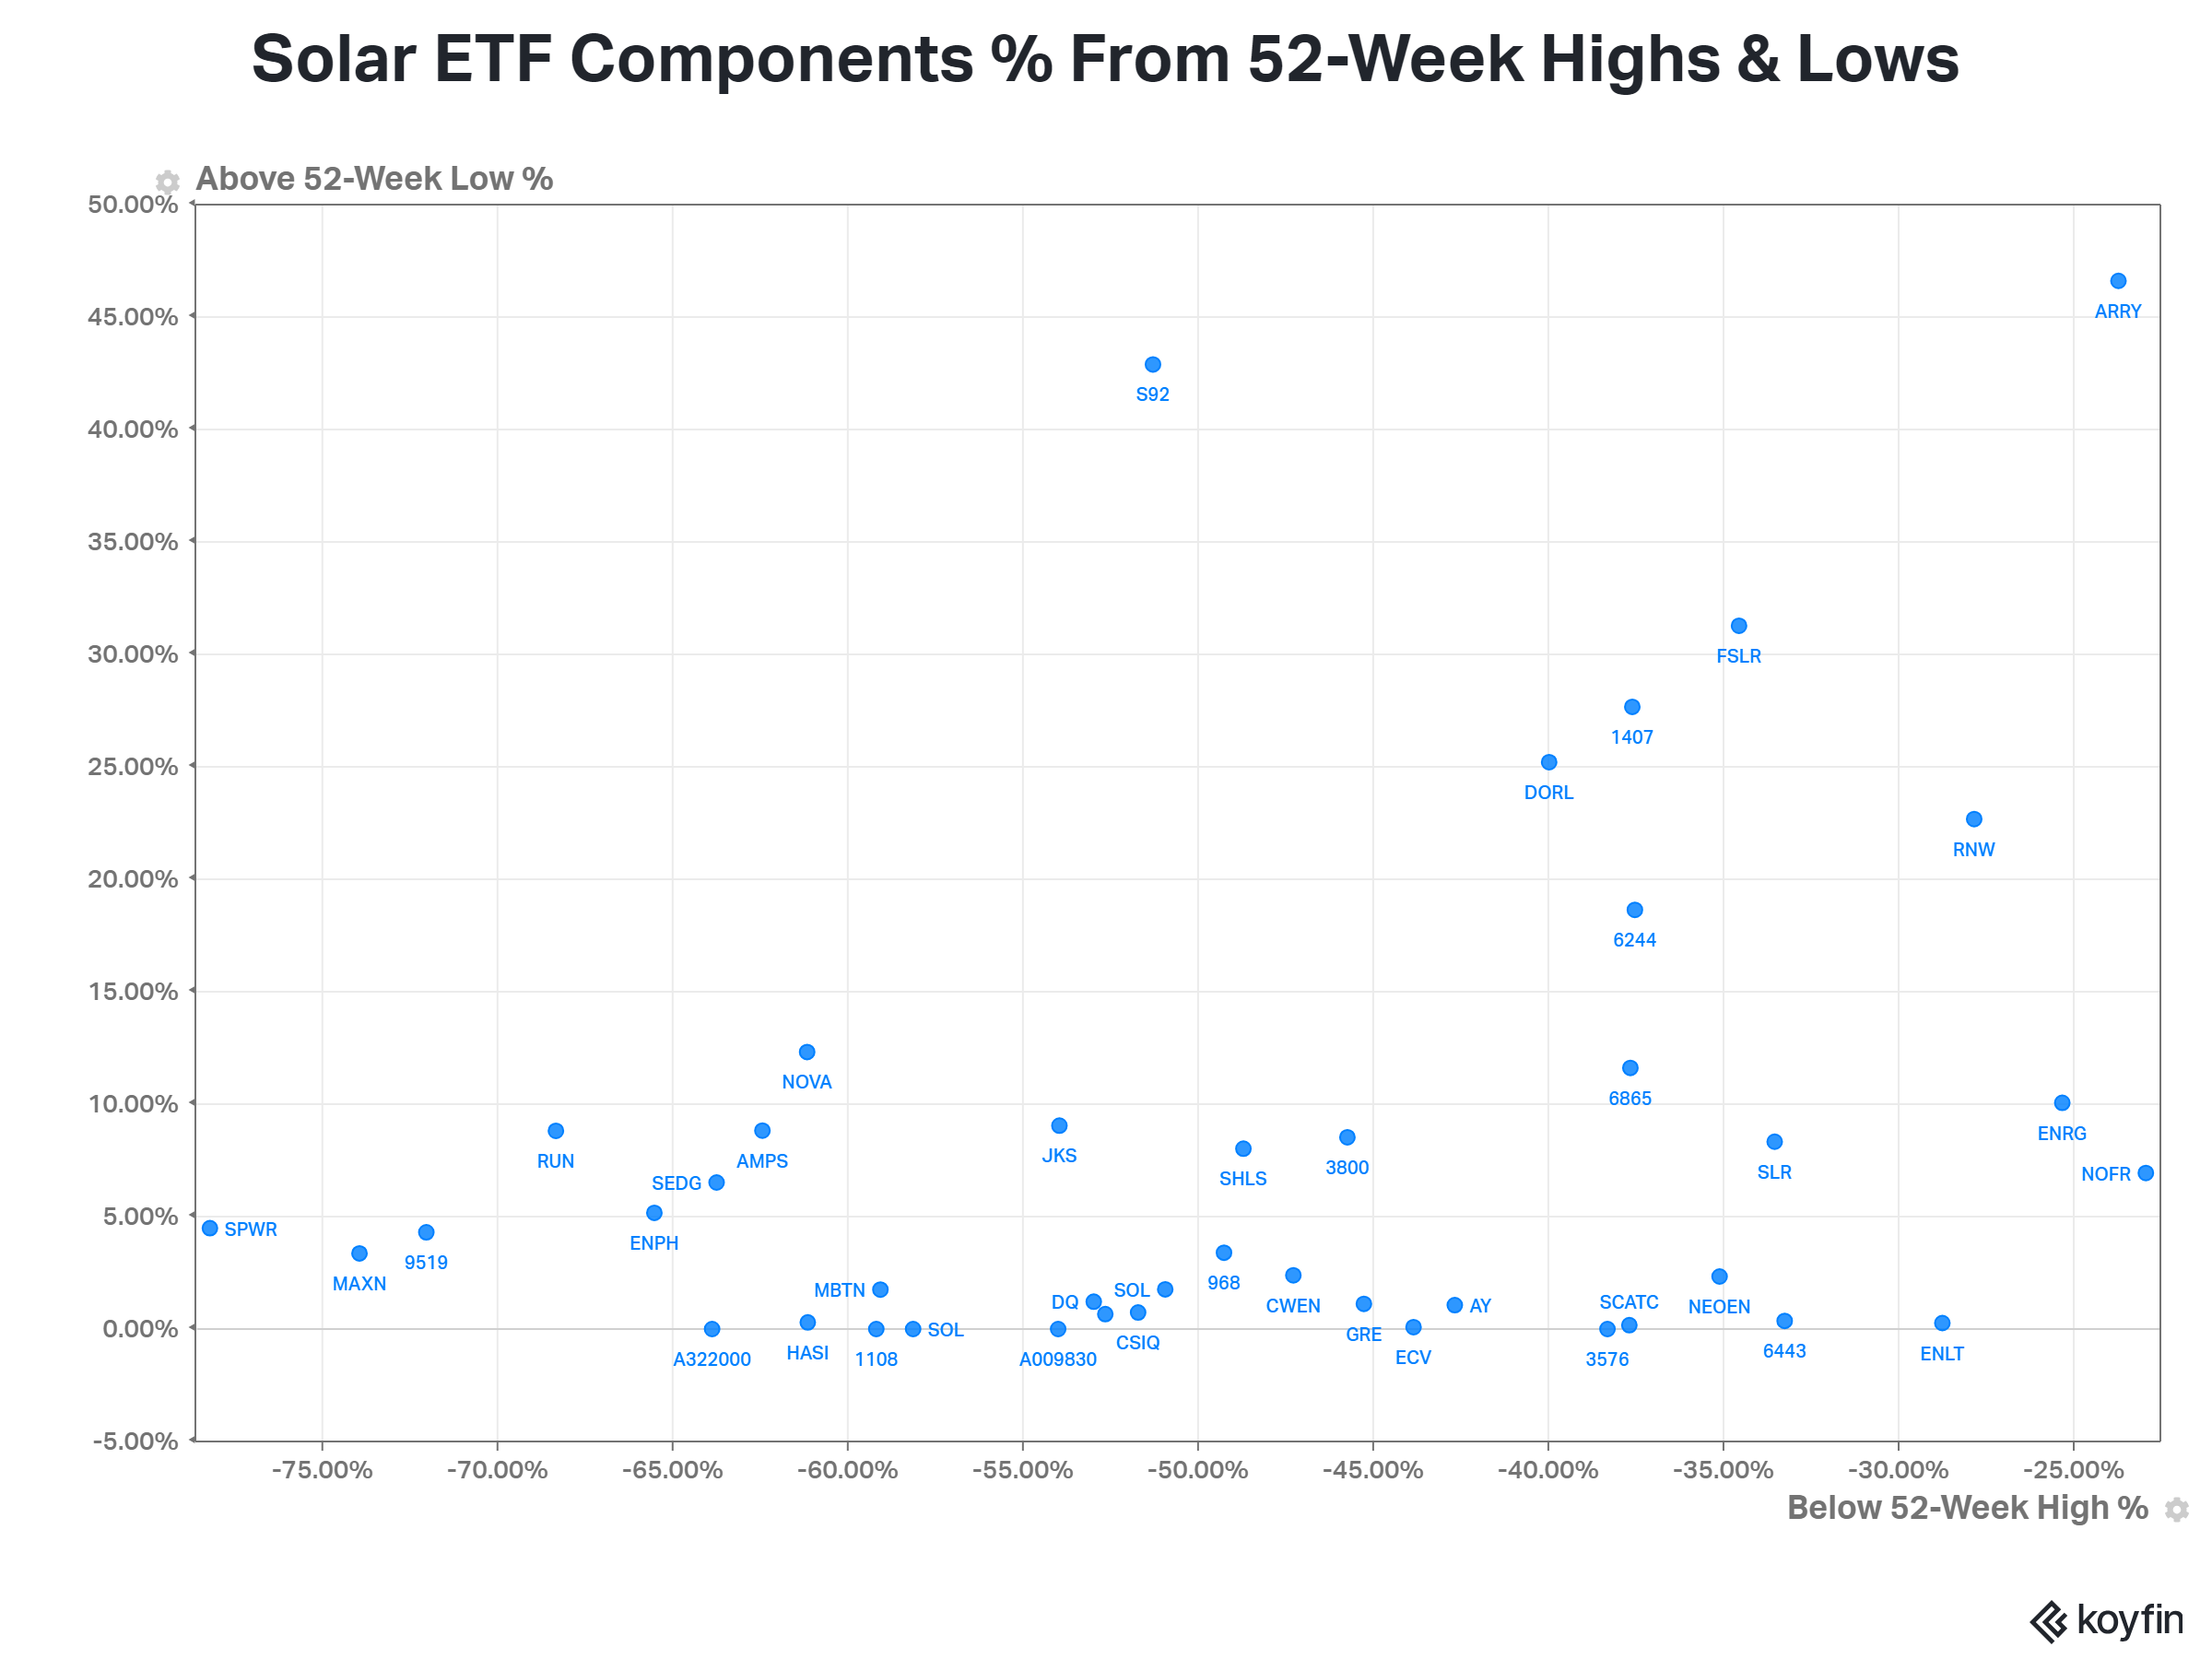
The scatter plot below charts some of the carnage in the sector, plotting the ETF’s components relative to their 52-week highs and lows. As shown by how many dots are near the X-axis, a solid chunk of stocks are sitting at or near their 52-week lows. And most are well below their 52-week highs, with the best component down just over 20%. 😮
So far, in 2023, traditional energy stocks have fared much better than their renewable peers. Nonetheless, investors are watching the entire energy sector closely to see where things ultimately shake out into year end. 👀