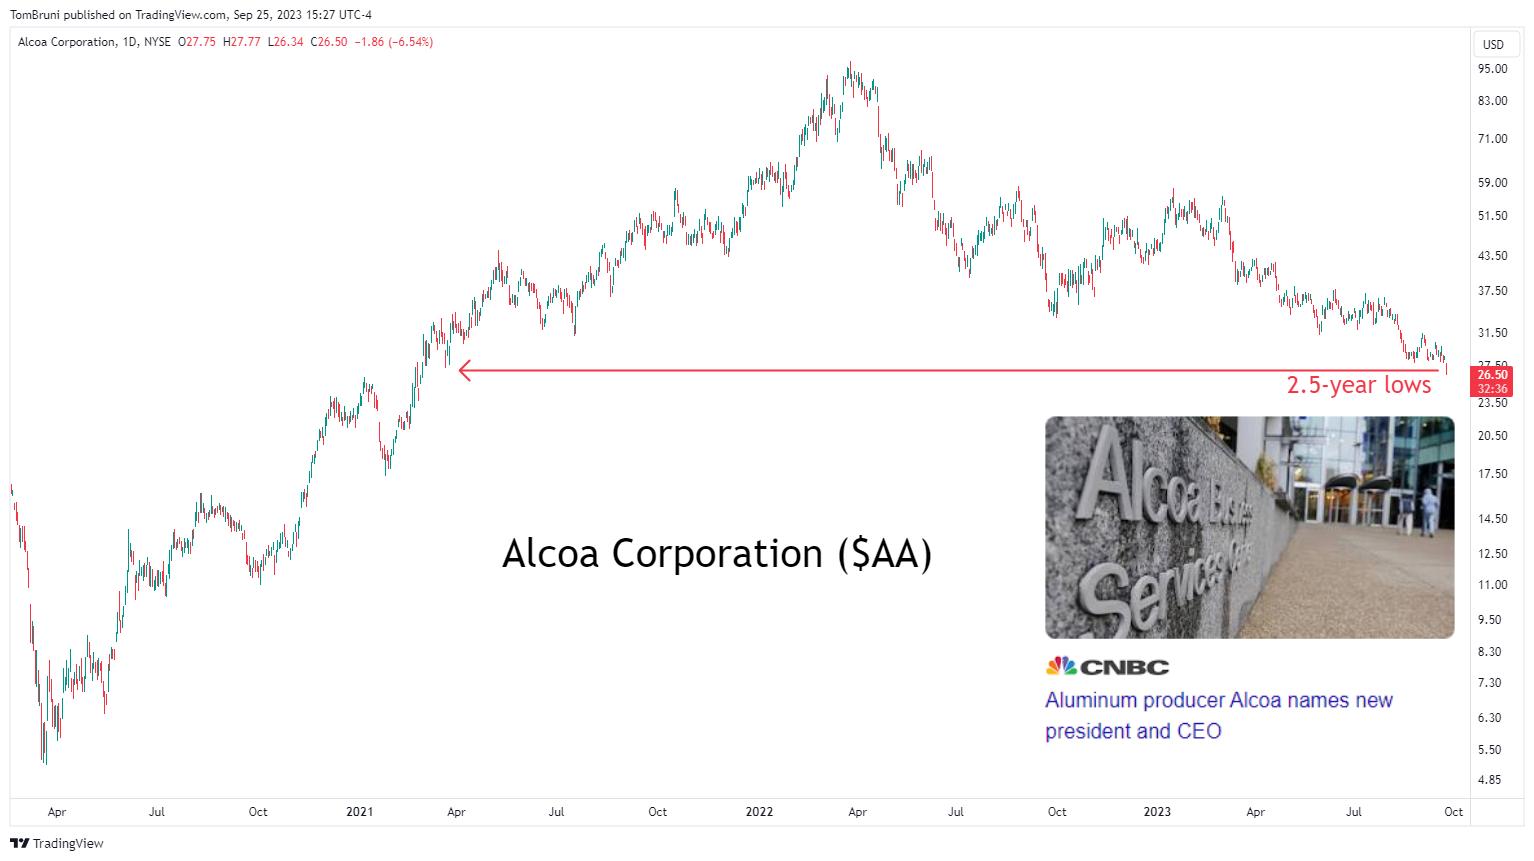
The world’s eighth-largest aluminum maker, Alcoa, threw investors for a loop on Monday, unexpectedly announcing a new chief executive officer (CEO). 😮
Roy Harvey has led the company since November 2016, when it went public, and will remain a strategic adviser until the end of 2023. He’ll be replaced by William Oplinger, who has served as executive vice president and chief operations officer (COO) since February of this year.
Although the company says this reflects its “succession planning process,” the market seemingly did not expect a change. However, it’ll likely have to wait until the company reports third-quarter results in mid-October for more color on the change and potential impacts. 📝
$AA shares fell 6% on the day to fresh 2.5-year lows. It has now given back 70% of its October 2020 to March 2022 gains. 😬
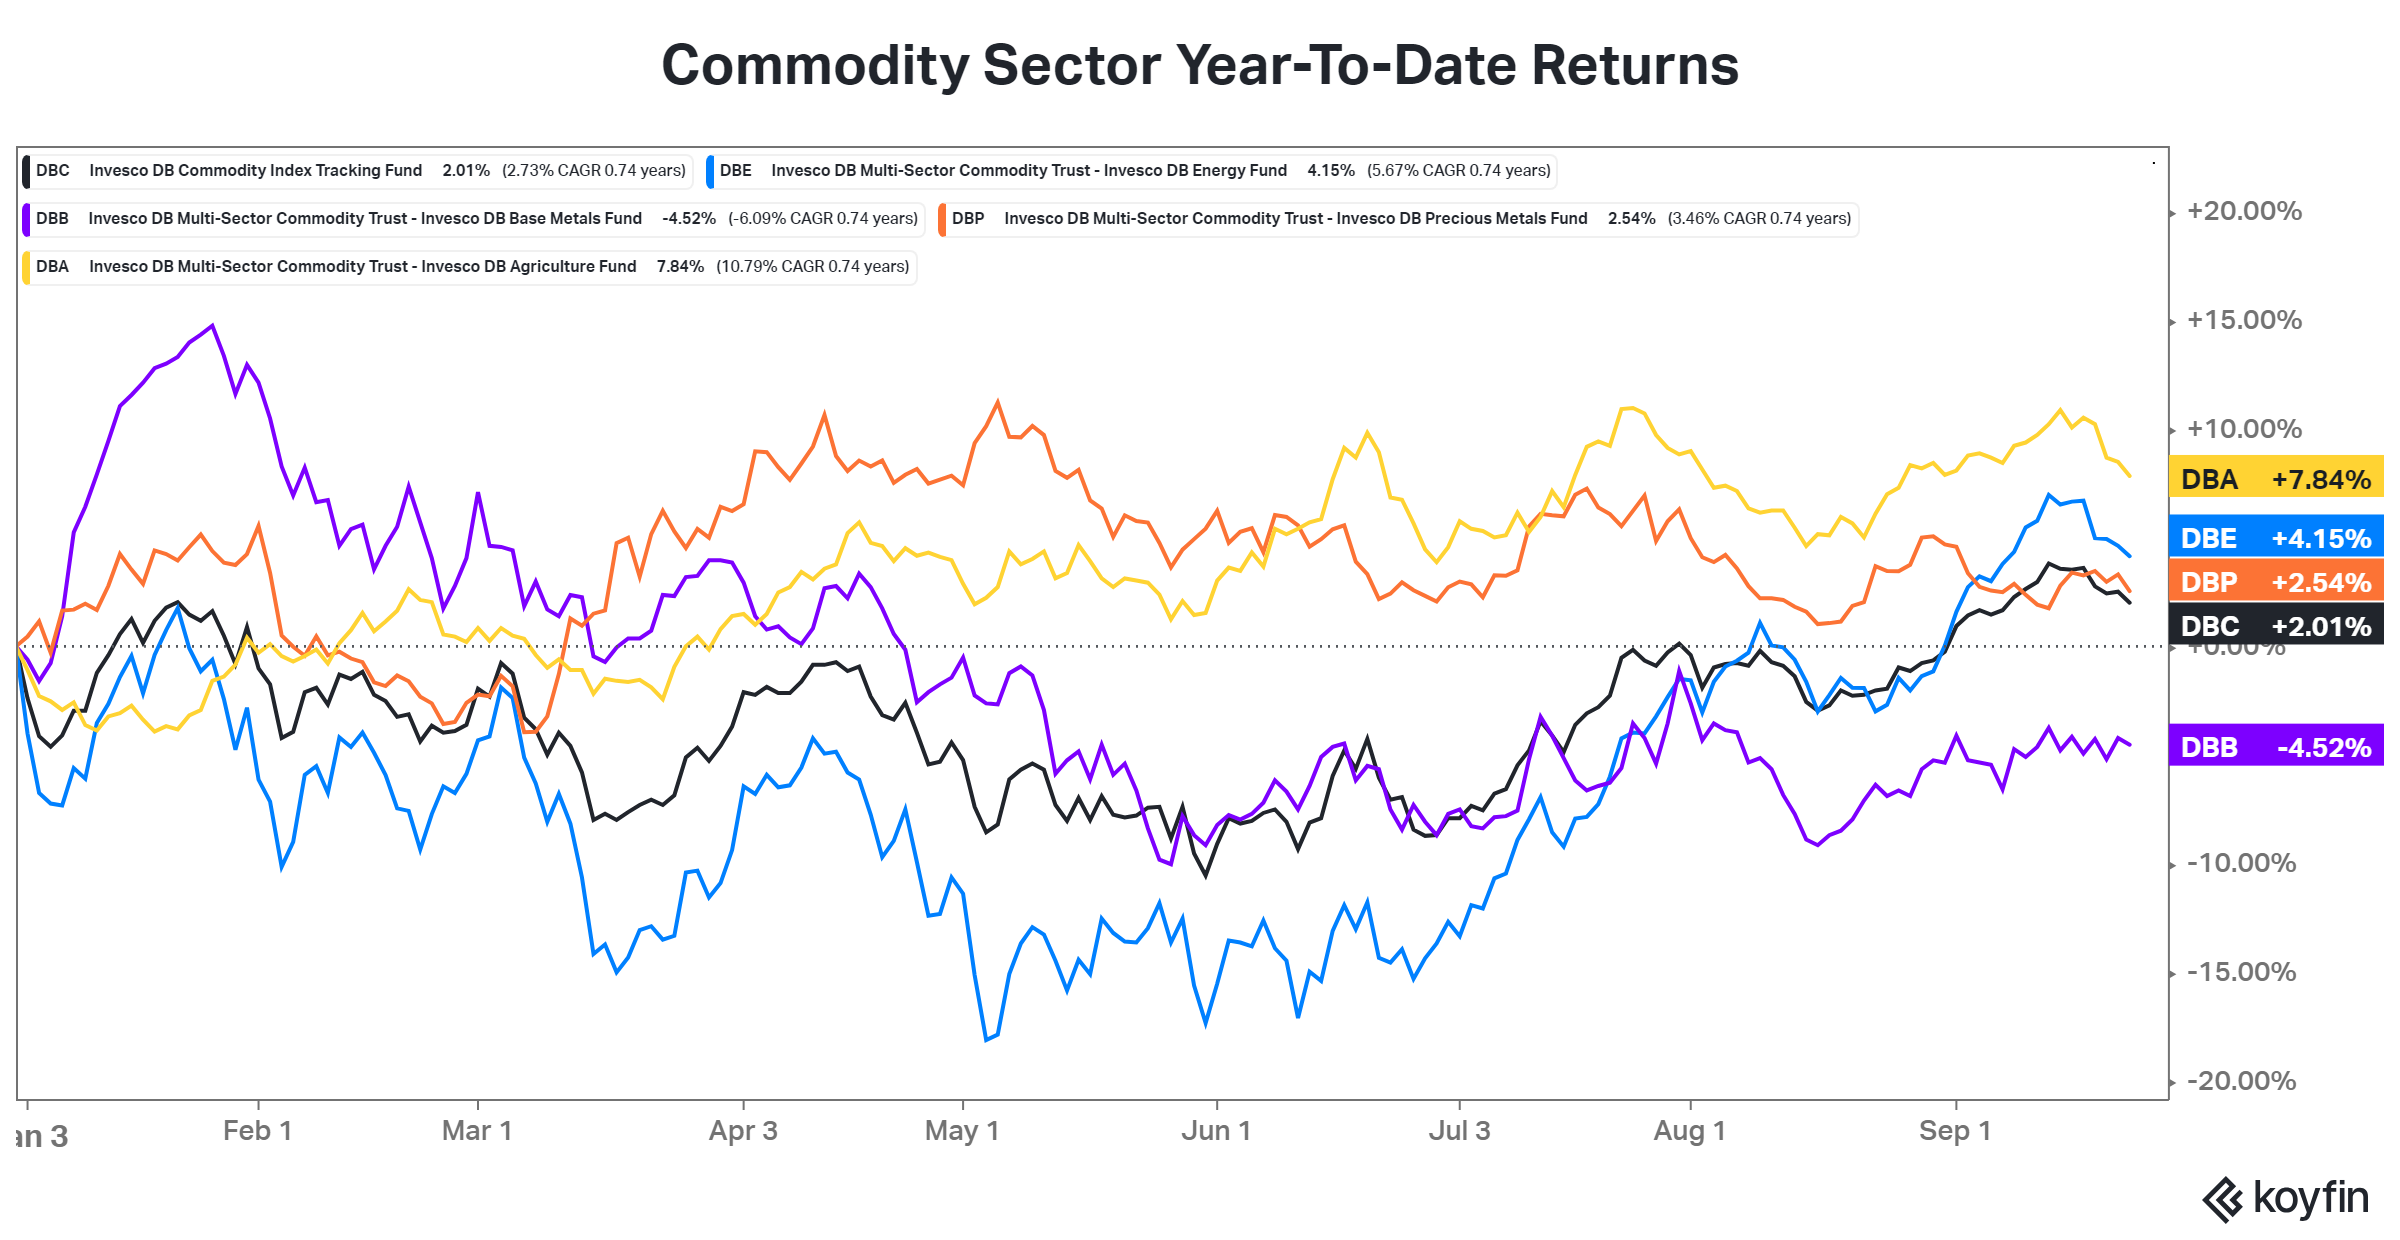
Other companies in its space have not fared particularly well this year either. Although the commodity sector has performed well in aggregate, most of the strength has come from energy and agriculture. The chart below shows the base metals ETF lagging its peers year-to-date, falling nearly 5%. 📉
We’ll have to wait and see if things improve. However, the global economy slowing down will remain a headwind for the group, including copper, aluminum, and zinc. 🤷