Sugar Hits Sweet Spot As Gold Shines

It was a slow day out there, but several commodities caught traders’ eyes. Let’s see which ones. 👀

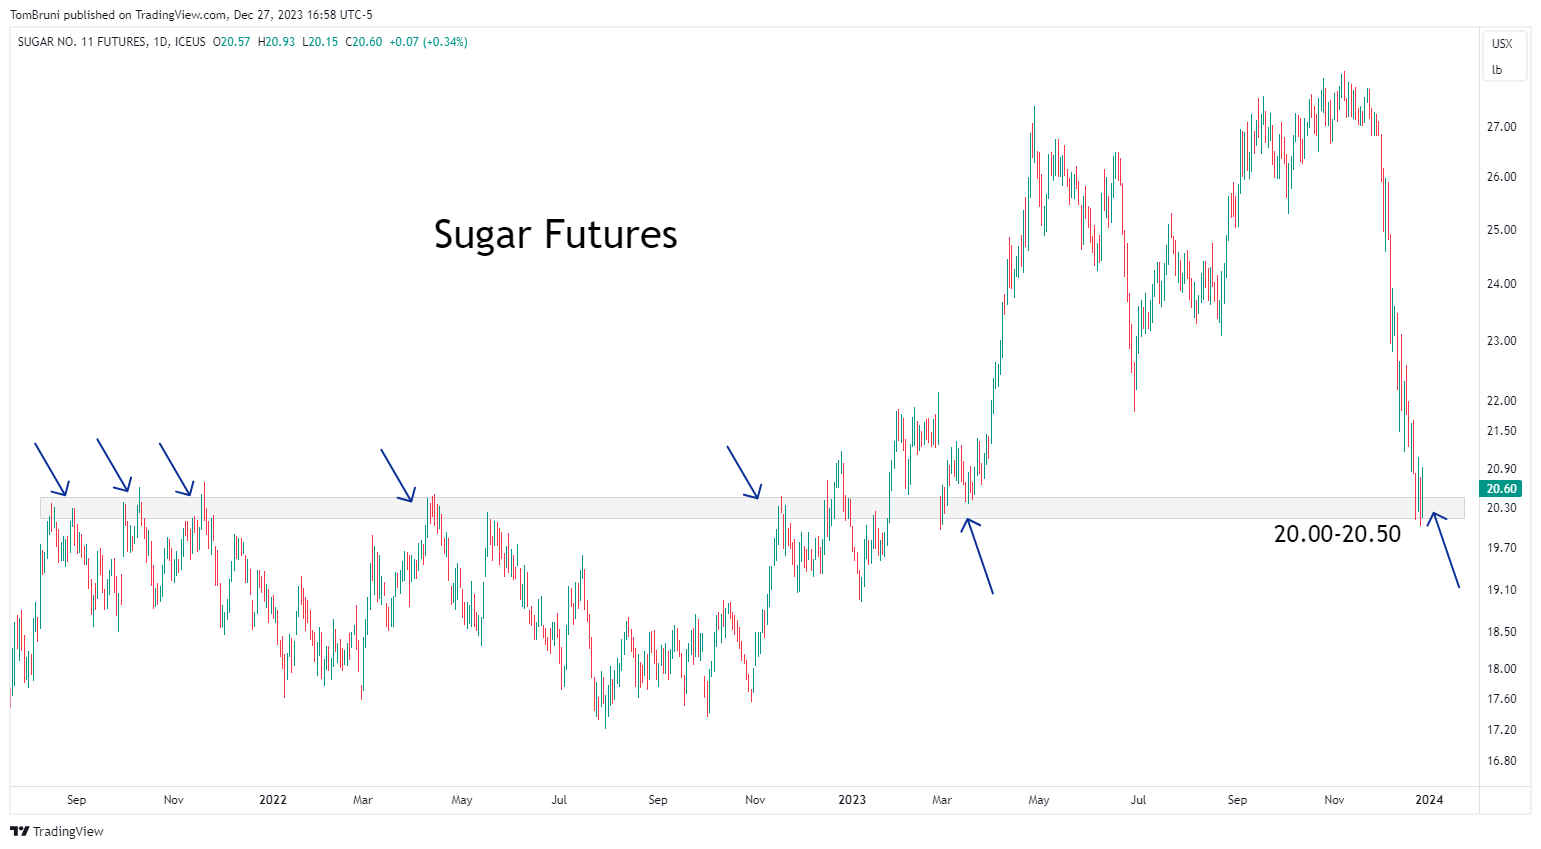
First up is sugar futures, which have experienced a nearly 30% decline since the beginning of November. While its major decline is one reason to be on people’s radars, technical traders say prices have reached the 20-20.50 area that served as an inflection point over the last two years.

They’re looking for prices to dig in here and potentially retrace some of this steep decline over the coming days and weeks. 💵

Meanwhile, on the other end of the spectrum, we’ve got gold futures trying again to break out above resistance near 2,090. The precious metal gave it a go earlier this month, but was unable to close above that level it failed at several times over the last few years.

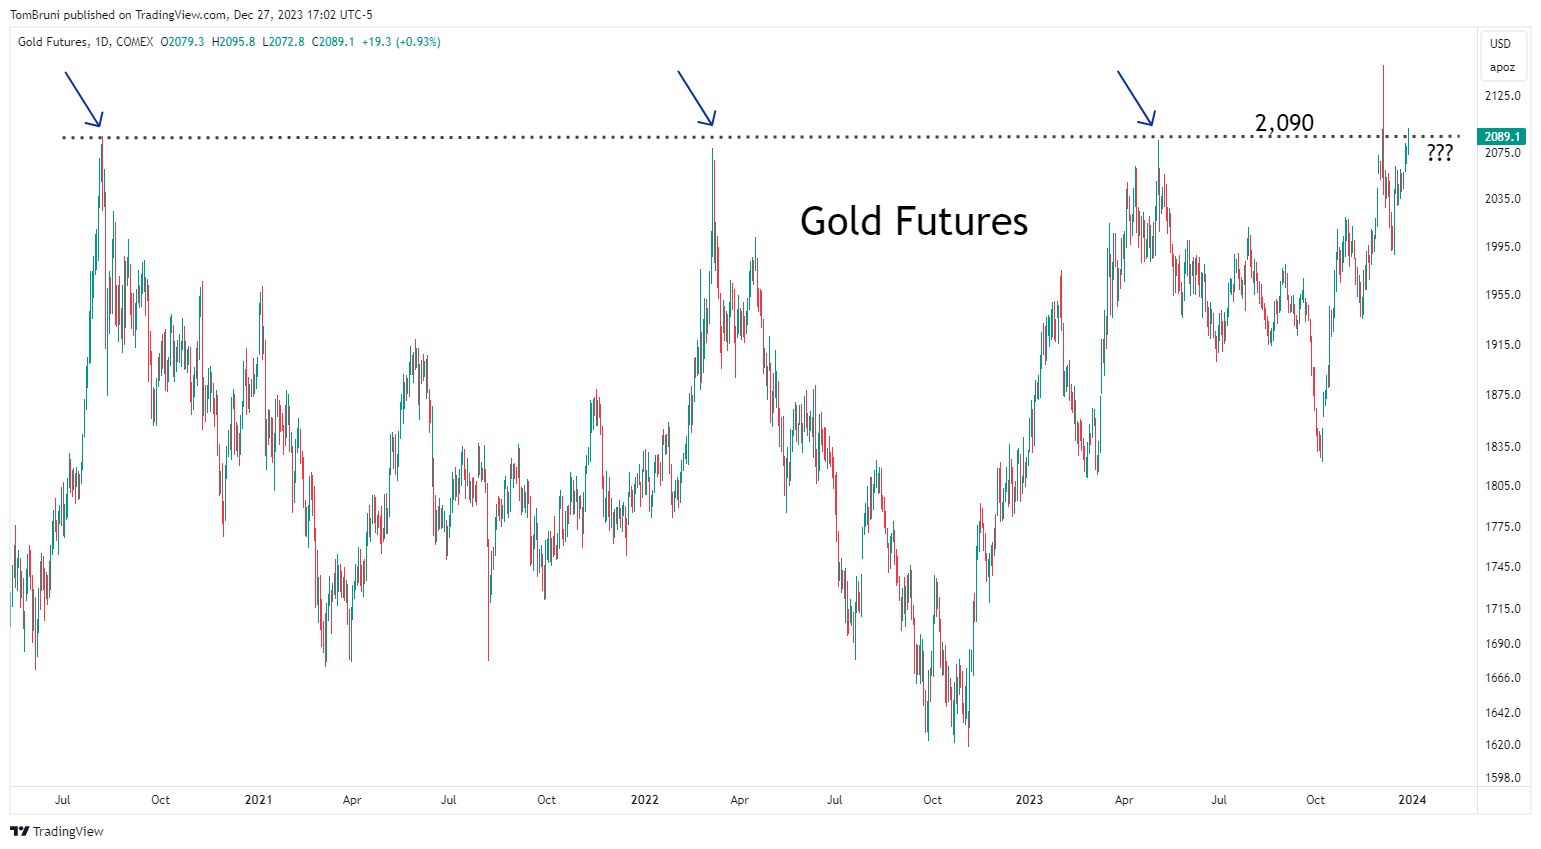
With volumes being lighter during this holiday trading period in the markets, some traders say this is a great opportunity for buyers to step in aggressively and complete this breakout. 🐂

We’ll have to wait and see how these play out. But in the commodities space, these two charts are some of the most widely talked about in our community. 💬

Learn More About...

Crude Tops 90 As Inflation Ticks Up

Before we get into U.S. data, we need to discuss the European Central Bank’s (ECB) rate decision. The central bank surprised markets by raising rates another 25 bps to 4.00%, marking its tenth consecutive hike. 🔺

Unlike the U.S., Europe has not made as much progress in bringing down inflation, and its economy has not been as resilient. The region started raising rates later than the U.S. and experienced more direct impacts of the war in Ukraine, so it’s understandable that they’d be a bit behind the curve in making progress.

Read It

Palladium Perks Up

While we’ve already touched on gold moving to fresh all-time highs over the last two weeks, other precious metals are also catching a bid after a rough few years. 👀

Below is a chart that technical analysts have been eying this week as palladium futures attempt to reverse their downward course. The weekly line chart goes back to 2010 and shows prices bouncing back from the $800 to $900 region, which has served as a transition area for buyers/sellers over the last 14 years. 📊

Read It

Grains Lose Their Gains

Grain commodities were the talk of the town for a bit during the pandemic, as soaring prices pushed up producer and consumer inflation. They’ve not gotten a lot of headlines lately, as a slow and steady decline is less interesting than a sharp increase. 😴

However, they were back in the news today after making a swift move lower. The USDA quarterly grain stocks report showed higher stocks and production than initially anticipated. Wheat was hit the hardest, though soybeans and corn were both down too. 📉

Read It